⤴️-Paid Ad- Check advertising disclaimer here. Add your banner here.🔥


RBFX Support
-
Posts
1,502 -
Joined
-
Last visited
Content Type
Profiles
Forums
Articles
Everything posted by RBFX Support
-
Market Technical Analysis by RoboForex
RBFX Support replied to RBFX Support's topic in Technical Analysis
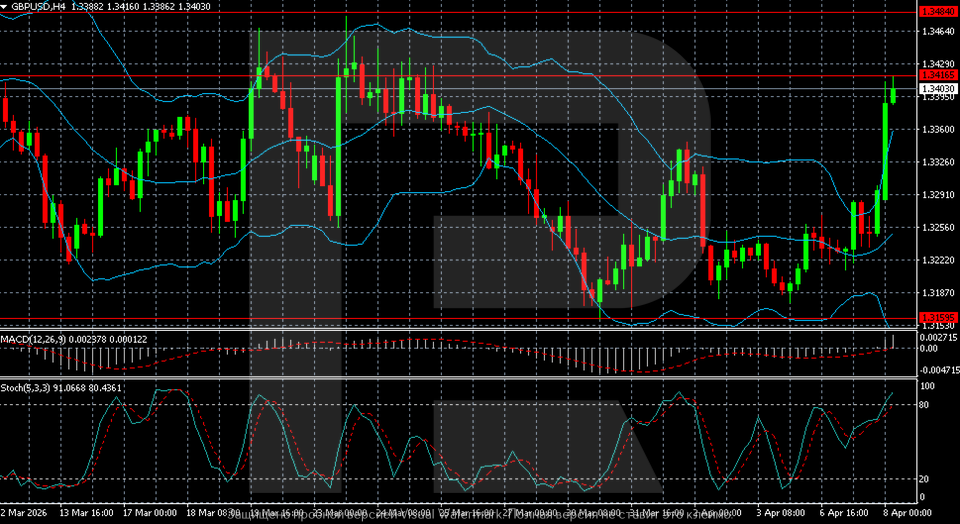
GBPUSD may edge higher: the situation around Hormuz has become slightly calmer The GBPUSD pair strengthened to 1.3403. Energy price risks remain high. Discover more in our analysis for 8 April 2026. Technical outlook On the GBPUSD H4 chart, after declining in late March, the pair formed a local bottom around 1.3150 and began to recover. The latest upward momentum appears fairly strong, with the price quickly returning to the 1.34 area and approaching the key resistance zone of 1.3415–1.3480. The GBPUSD pair is rising within a correction after touching four-week lows earlier. Read more - GBPUSD Forecast Attention! Forecasts presented in this section only reflect the author’s private opinion and should not be considered as guidance for trading. RoboForex bears no responsibility for trading results based on trading recommendations described in these analytical reviews. Sincerely, The RoboForex Team
-
roboforex Market Fundamental Analysis by RoboForex
RBFX Support replied to RBFX Support's topic in Fundamental Analysis
US 500 forecast: the index may enter a sideways channel The US 500 index sees elevated volatility, with a sideways range likely to form. The US 500 forecast for today is negative. US 500 forecast: key takeaways Recent data: US Nonfarm Payrolls came in at 178 thousand in March Market impact: the data is negative for the stock market Fundamental analysis On Friday, 3 April, US employment data for March 2026 was released. At first glance, the figures appear very strong: the economy added 178 thousand jobs compared to a forecast of just 49 thousand. But if you look deeper, the picture is not that optimistic. Out of those 178 thousand jobs, about 76 thousand were doctors and healthcare workers who returned to work after the Kaiser Permanente strike ended. For the US 500, the impact is not entirely positive. A stronger labour market reduces the likelihood of rapid monetary easing. Following the report, expectations increased that the Federal Reserve will maintain a more hawkish stance and will not rush to cut rates. RoboForex Market Analysis & Forex Forecasts Attention! Forecasts presented in this section only reflect the author’s private opinion and should not be considered as guidance for trading. RoboForex bears no responsibility for trading results based on trading recommendations described in these analytical reviews. Sincerely, The RoboForex Team -
Market Technical Analysis by RoboForex
RBFX Support replied to RBFX Support's topic in Technical Analysis
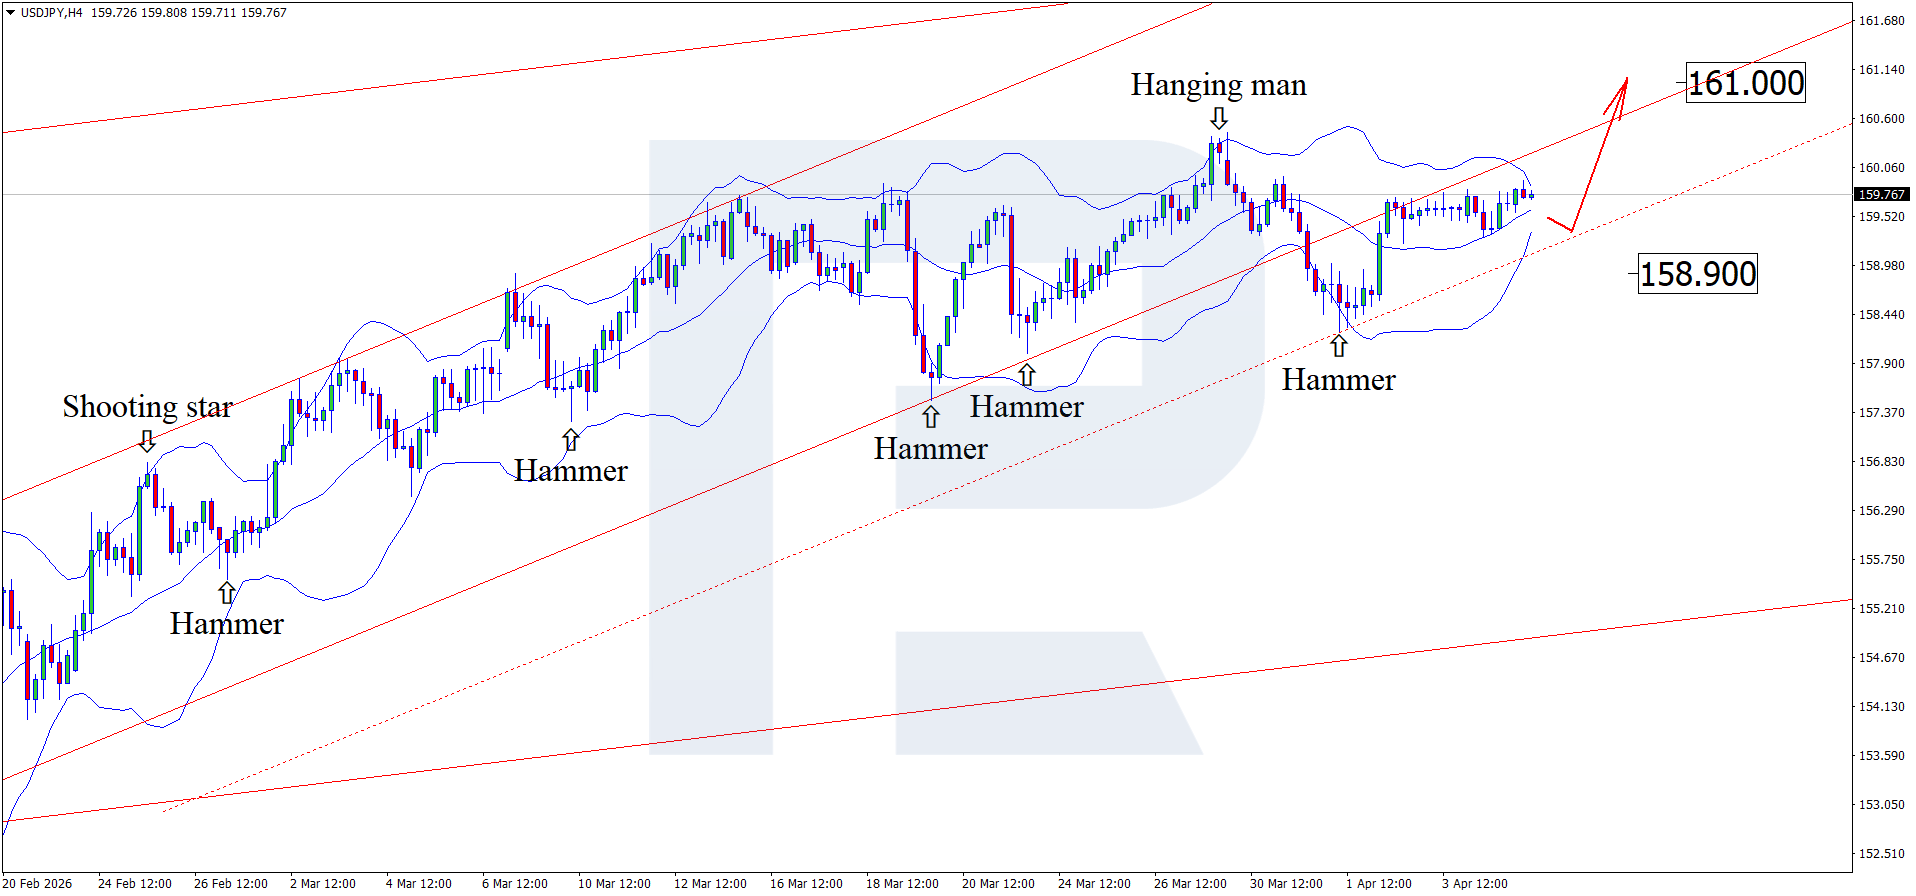
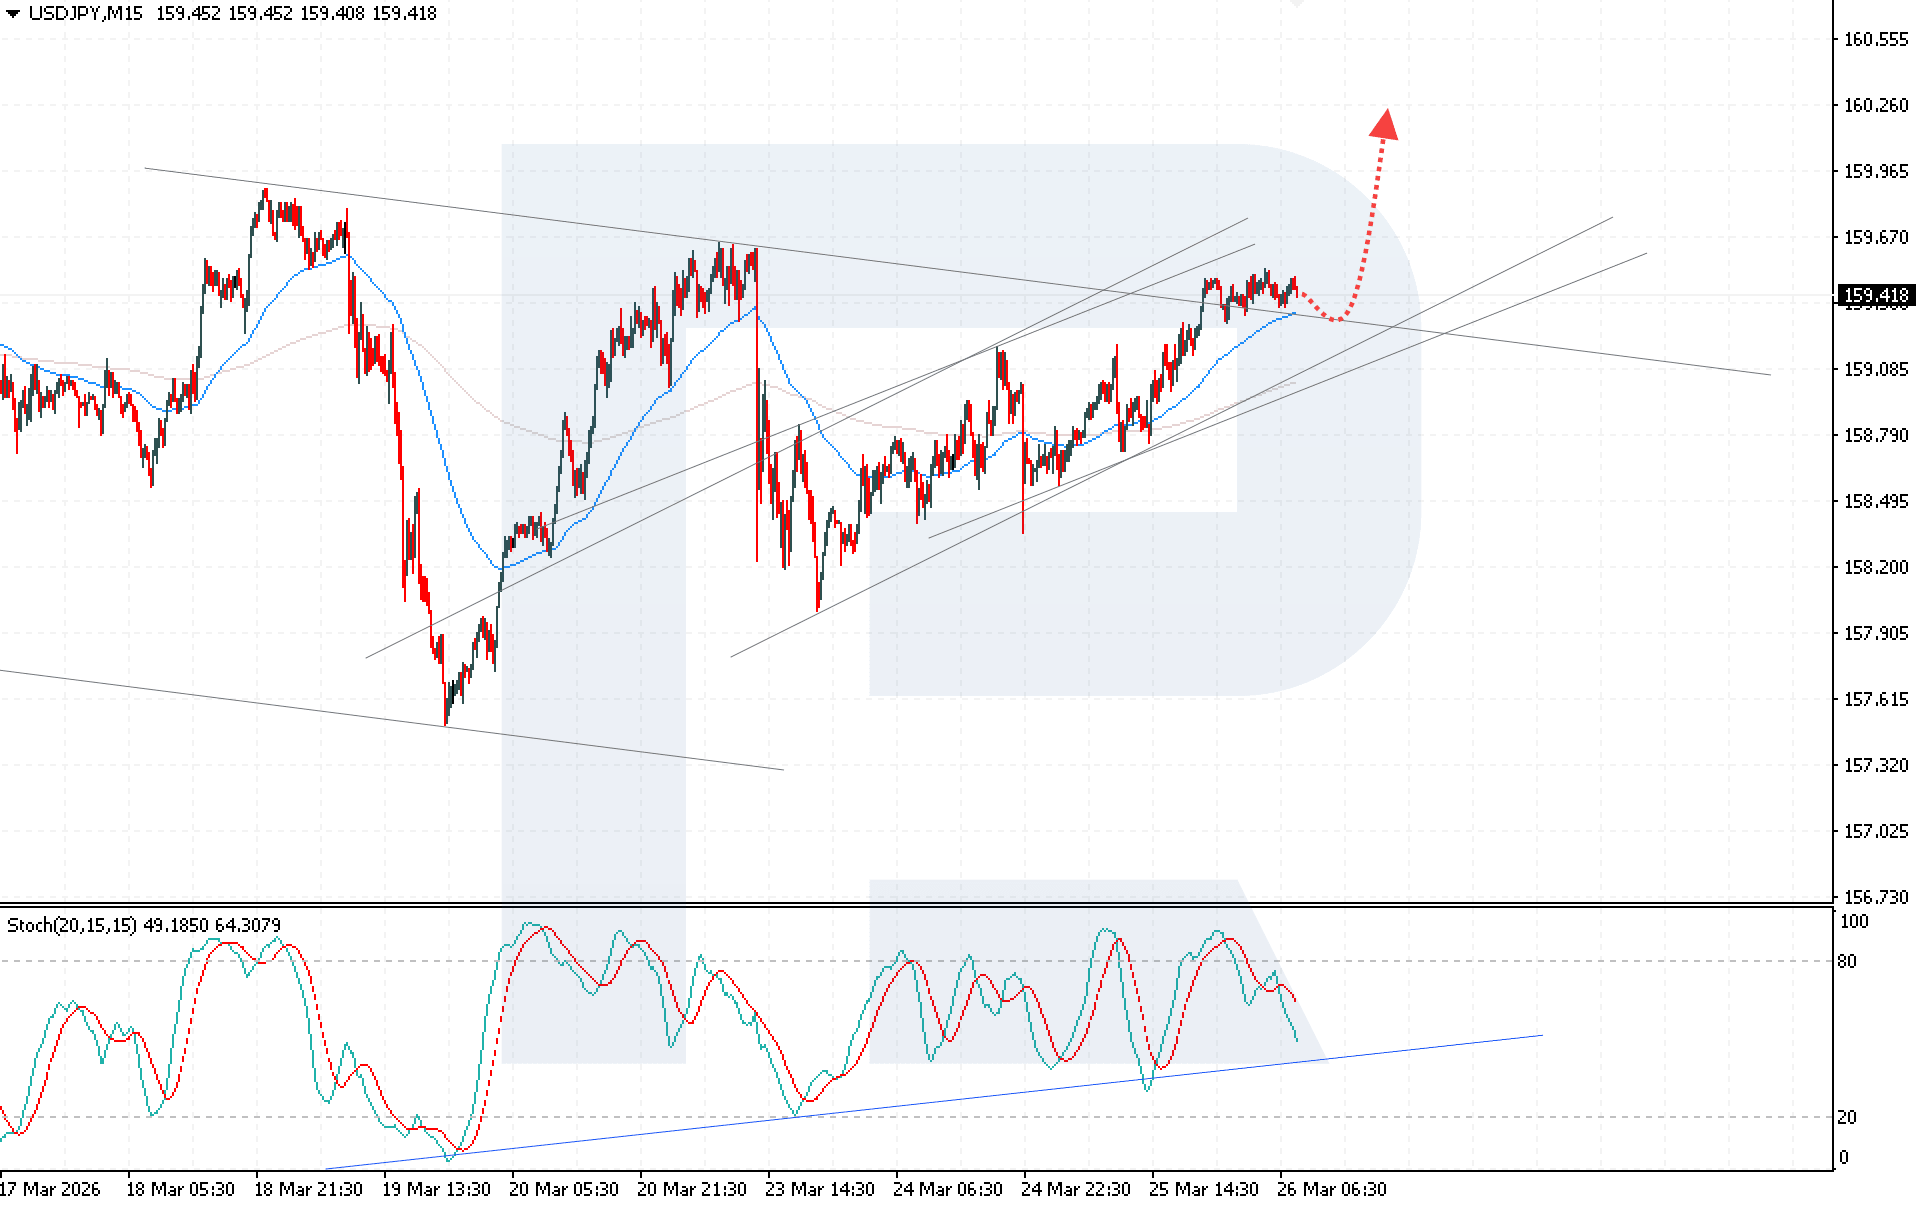
Final countdown for USDJPY: ultimatum, rumours of peace, and the threat of intervention The USDJPY pair is balancing on the edge of a breakout above the 160.00 level and intervention by the Japanese government. Quotes are testing the 159.80 mark. Discover more in our analysis for 7 April 2026. Technical outlook On the H4 chart, the USDJPY pair has formed a Hammer reversal pattern near the lower Bollinger Band and is hovering around 159.70. Since the price remains within an ascending channel, it may break resistance and continue its upward trajectory following the pattern’s signal, with the upside target at 161.00. The USDJPY pair is on the verge of a breakout above 160.00 and intervention by the Japanese government. Read more - USDJPY Forecast Attention! Forecasts presented in this section only reflect the author’s private opinion and should not be considered as guidance for trading. RoboForex bears no responsibility for trading results based on trading recommendations described in these analytical reviews. Sincerely, The RoboForex Team
-
roboforex Market Fundamental Analysis by RoboForex
RBFX Support replied to RBFX Support's topic in Fundamental Analysis
USDJPY is entering a range: the market needs news The USDJPY pair declined to 159.56 at the start of the week, but this is temporary. The Middle East conflict is still influencing market decisions. Discover more in our analysis for 6 April 2026. USDJPY forecast: key takeaways The USDJPY pair is moving into a range amid continued geopolitical pressure The market expects the Bank of Japan to raise interest rates soon USDJPY forecast for 6 April 2026: 158.50 or 160.00 Fundamental analysis The USDJPY rate is declining to 159.56 on Monday. Despite the correction, the yen remains near its weakest levels since July 2024, with pressure on the Japanese currency increasing amid the escalating conflict around Iran and rising energy prices. US President Donald Trump stated that strikes on Iran’s energy and civilian infrastructure may begin within the next few days if the Strait of Hormuz is not reopened. Tehran rejected these demands, and the water route remains effectively blocked. RoboForex Market Analysis & Forex Forecasts Attention! Forecasts presented in this section only reflect the author’s private opinion and should not be considered as guidance for trading. RoboForex bears no responsibility for trading results based on trading recommendations described in these analytical reviews. Sincerely, The RoboForex Team -
Market Technical Analysis by RoboForex
RBFX Support replied to RBFX Support's topic in Technical Analysis
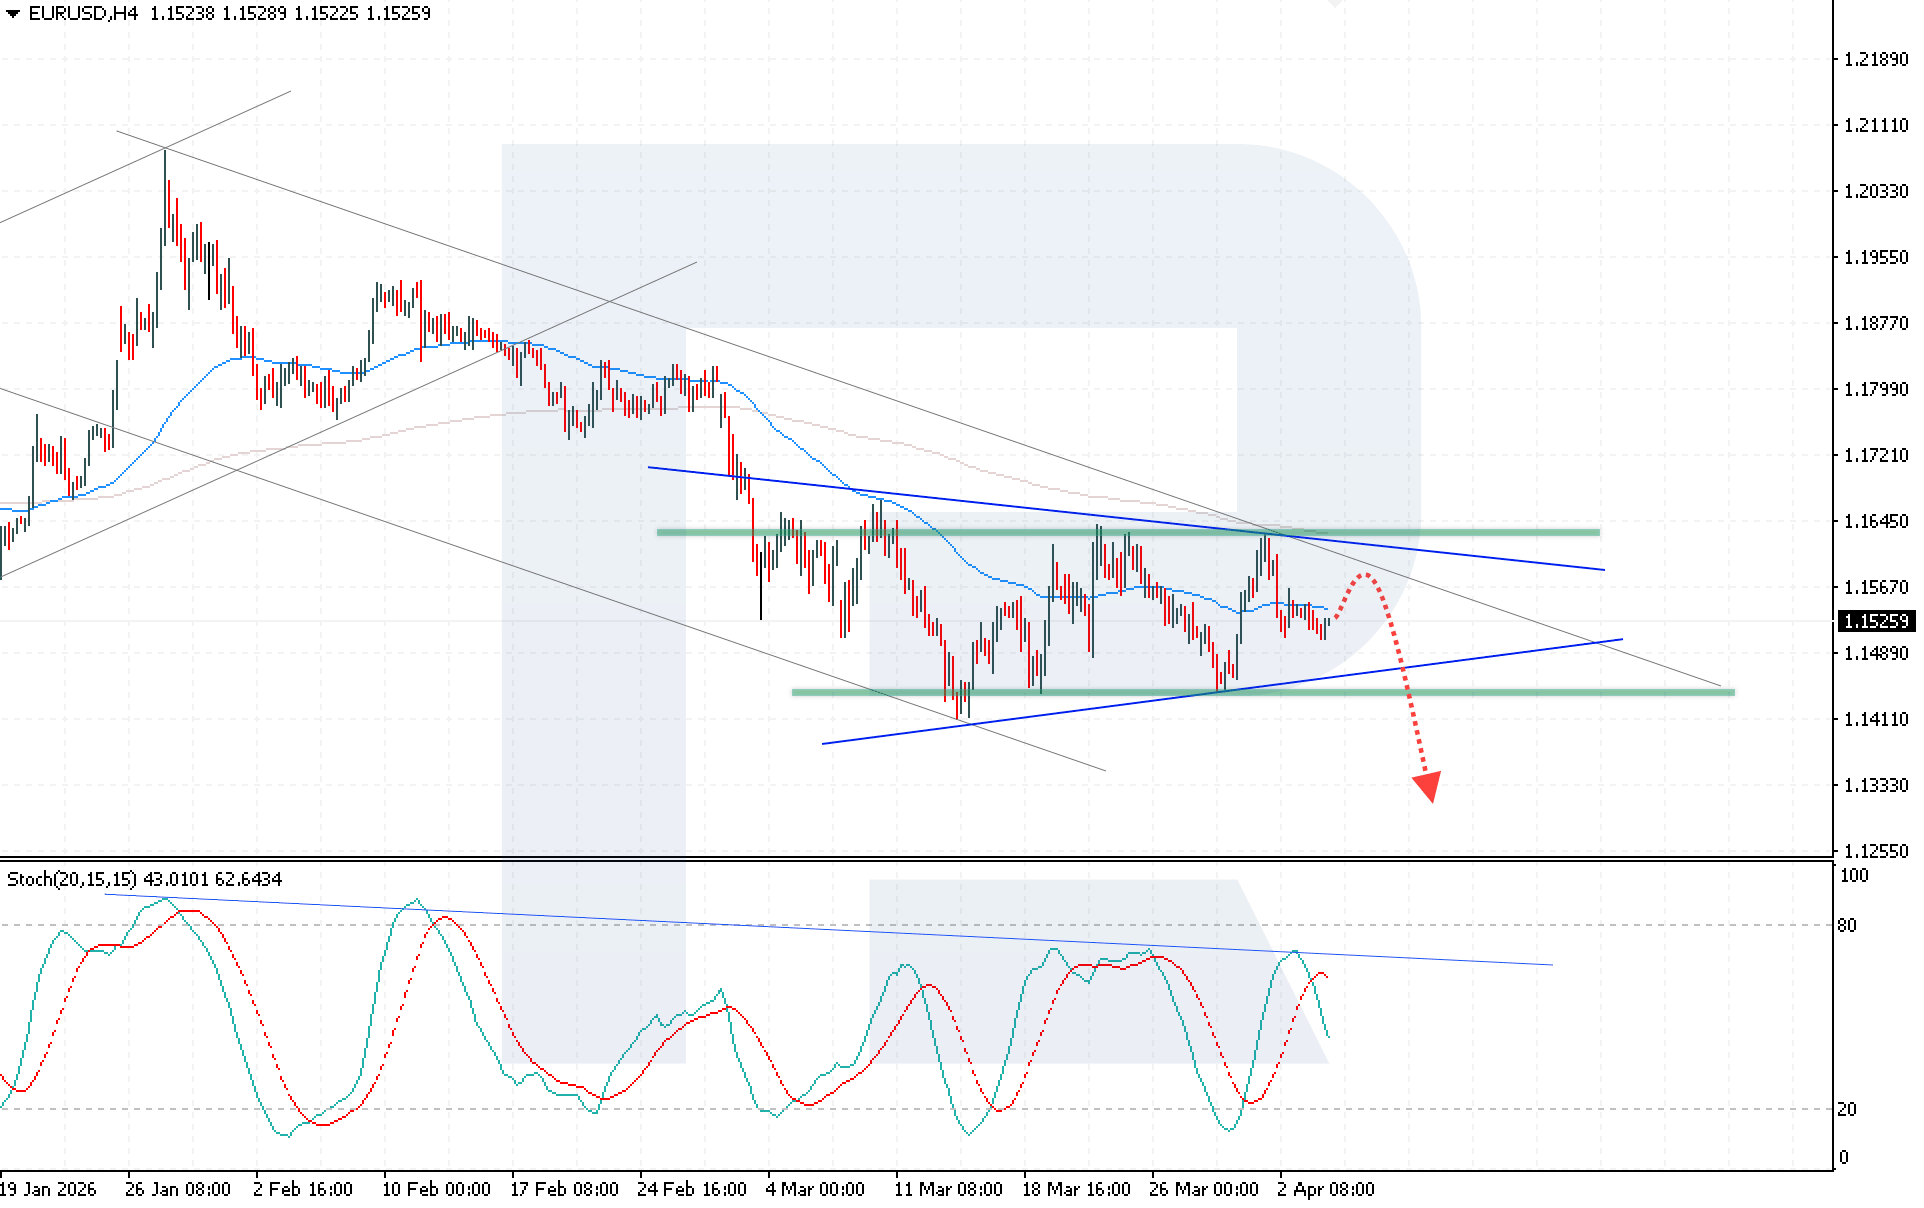
EURUSD is correcting within a Triangle pattern The EURUSD pair remains in a phase of uncertainty, combining corrective growth with the impact of strong US macroeconomic data and rising geopolitical risks. The rate currently stands at 1.1525. Discover more in our analysis for 6 April 2026. Technical outlook The EURUSD rate continues its corrective movement within the Triangle pattern. The price remains below the EMA-65, indicating persistent selling pressures and confirming the prevailing bearish sentiment. Strong US labour market data and rising geopolitical tensions are supporting the dollar. Read more - EURUSD Forecast Attention! Forecasts presented in this section only reflect the author’s private opinion and should not be considered as guidance for trading. RoboForex bears no responsibility for trading results based on trading recommendations described in these analytical reviews. Sincerely, The RoboForex Team
-
Market Technical Analysis by RoboForex
RBFX Support replied to RBFX Support's topic in Technical Analysis
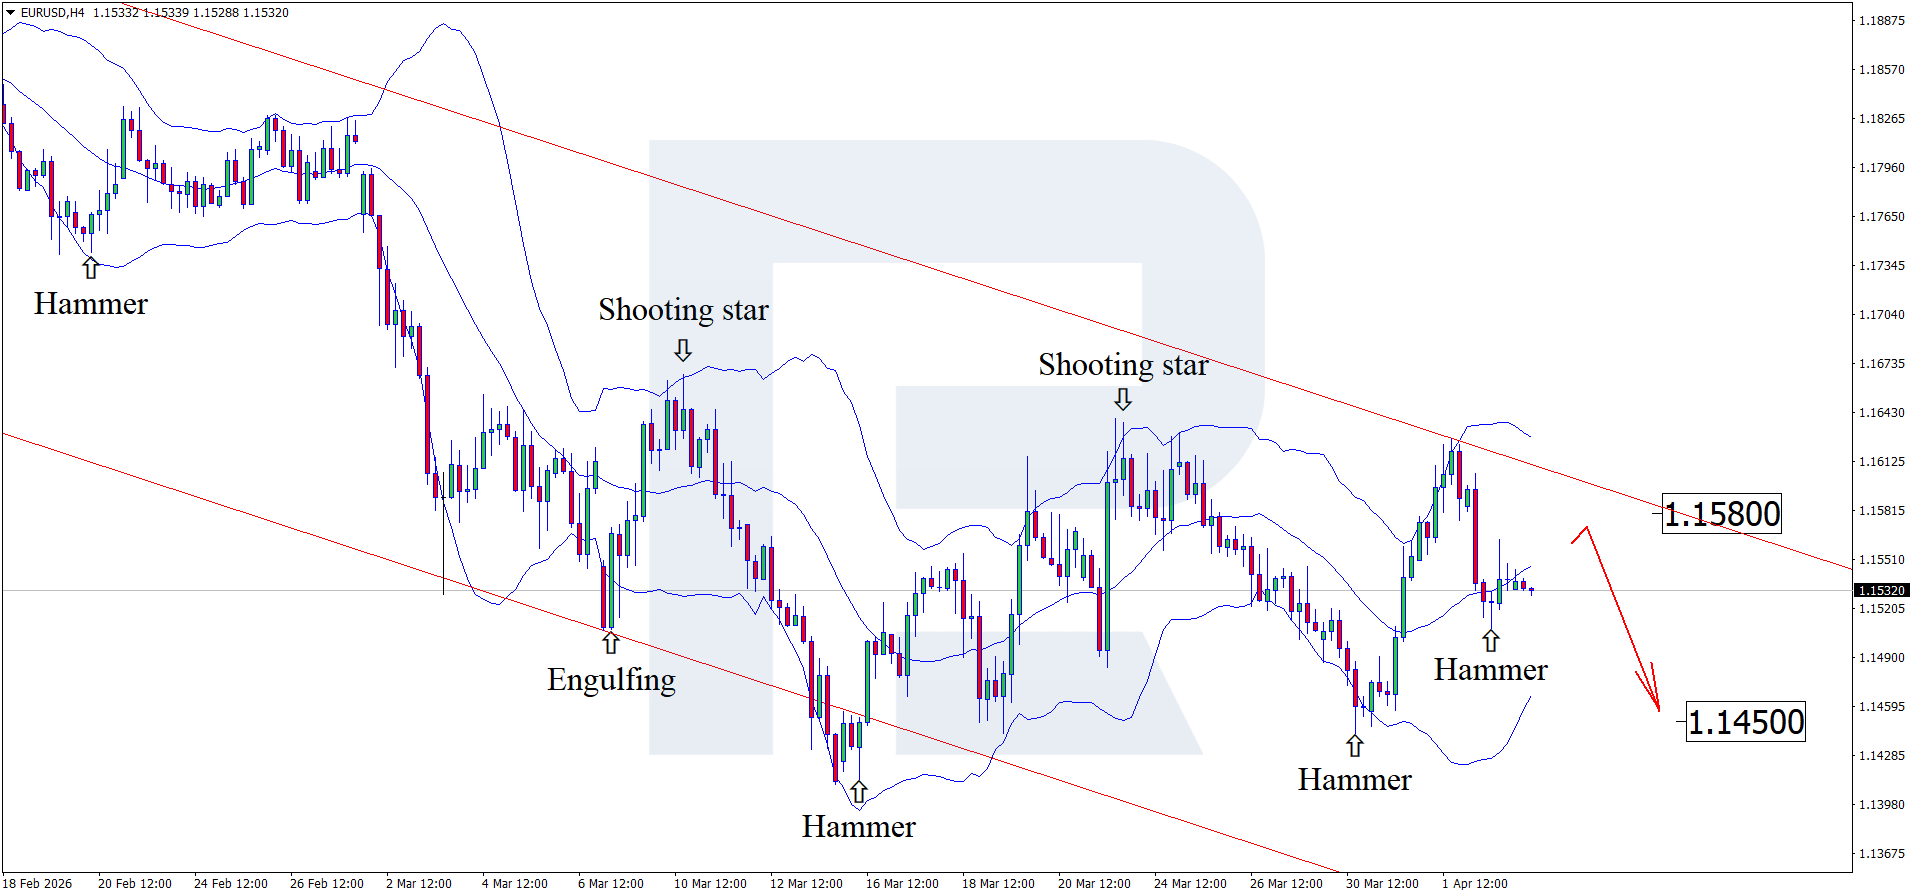
The ECB is ready to raise rates: what awaits EURUSD in the coming days The EURUSD rate has stalled ahead of the release of US employment data. After falling, quotes are forming a correction and are hovering around the 1.1530 level. Find out more in our analysis for 3 April 2026. Technical outlook On the H4 chart, the EURUSD pair has formed a Hammer reversal pattern near the lower Bollinger Band and could develop a corrective wave following this signal. Since quotes remain within a descending channel, the upper boundary near the 1.1580 mark may act as the pullback target. The market has frozen in anticipation of US labour market data and signals on ECB and Fed interest rates. Read more - EURUSD Forecast Attention! Forecasts presented in this section only reflect the author’s private opinion and should not be considered as guidance for trading. RoboForex bears no responsibility for trading results based on trading recommendations described in these analytical reviews. Sincerely, The RoboForex Team
-
roboforex Market Fundamental Analysis by RoboForex
RBFX Support replied to RBFX Support's topic in Fundamental Analysis
AUDUSD on the verge of a breakout: Australia is ready to raise interest rates Ahead of the NFP release, volatility in the AUDUSD pair has fallen noticeably, with quotes testing the 0.6900 mark. Find more details in our analysis for 3 April 2026. AUDUSD forecast: key takeaways Westpac expects three rate hikes in 2026 US Nonfarm Payrolls: previously at -92 thousand, projected at 65 thousand The Australian dollar received unexpected support from China Fundamental analysis Today’s AUDUSD forecast takes into account that the Australian dollar is showing remarkable resilience, balancing on a knife edge between strong domestic support and an external geopolitical storm. The AUDUSD pair is trading around 0.6900, attempting to build on its upward momentum after the recent decline. The domestic driver for the AUD today is not just hawkish signals, but a real consensus on the inevitability of further policy tightening by the Reserve Bank of Australia. RoboForex Market Analysis & Forex Forecasts Attention! Forecasts presented in this section only reflect the author’s private opinion and should not be considered as guidance for trading. RoboForex bears no responsibility for trading results based on trading recommendations described in these analytical reviews. Sincerely, The RoboForex Team -
Market Technical Analysis by RoboForex
RBFX Support replied to RBFX Support's topic in Technical Analysis
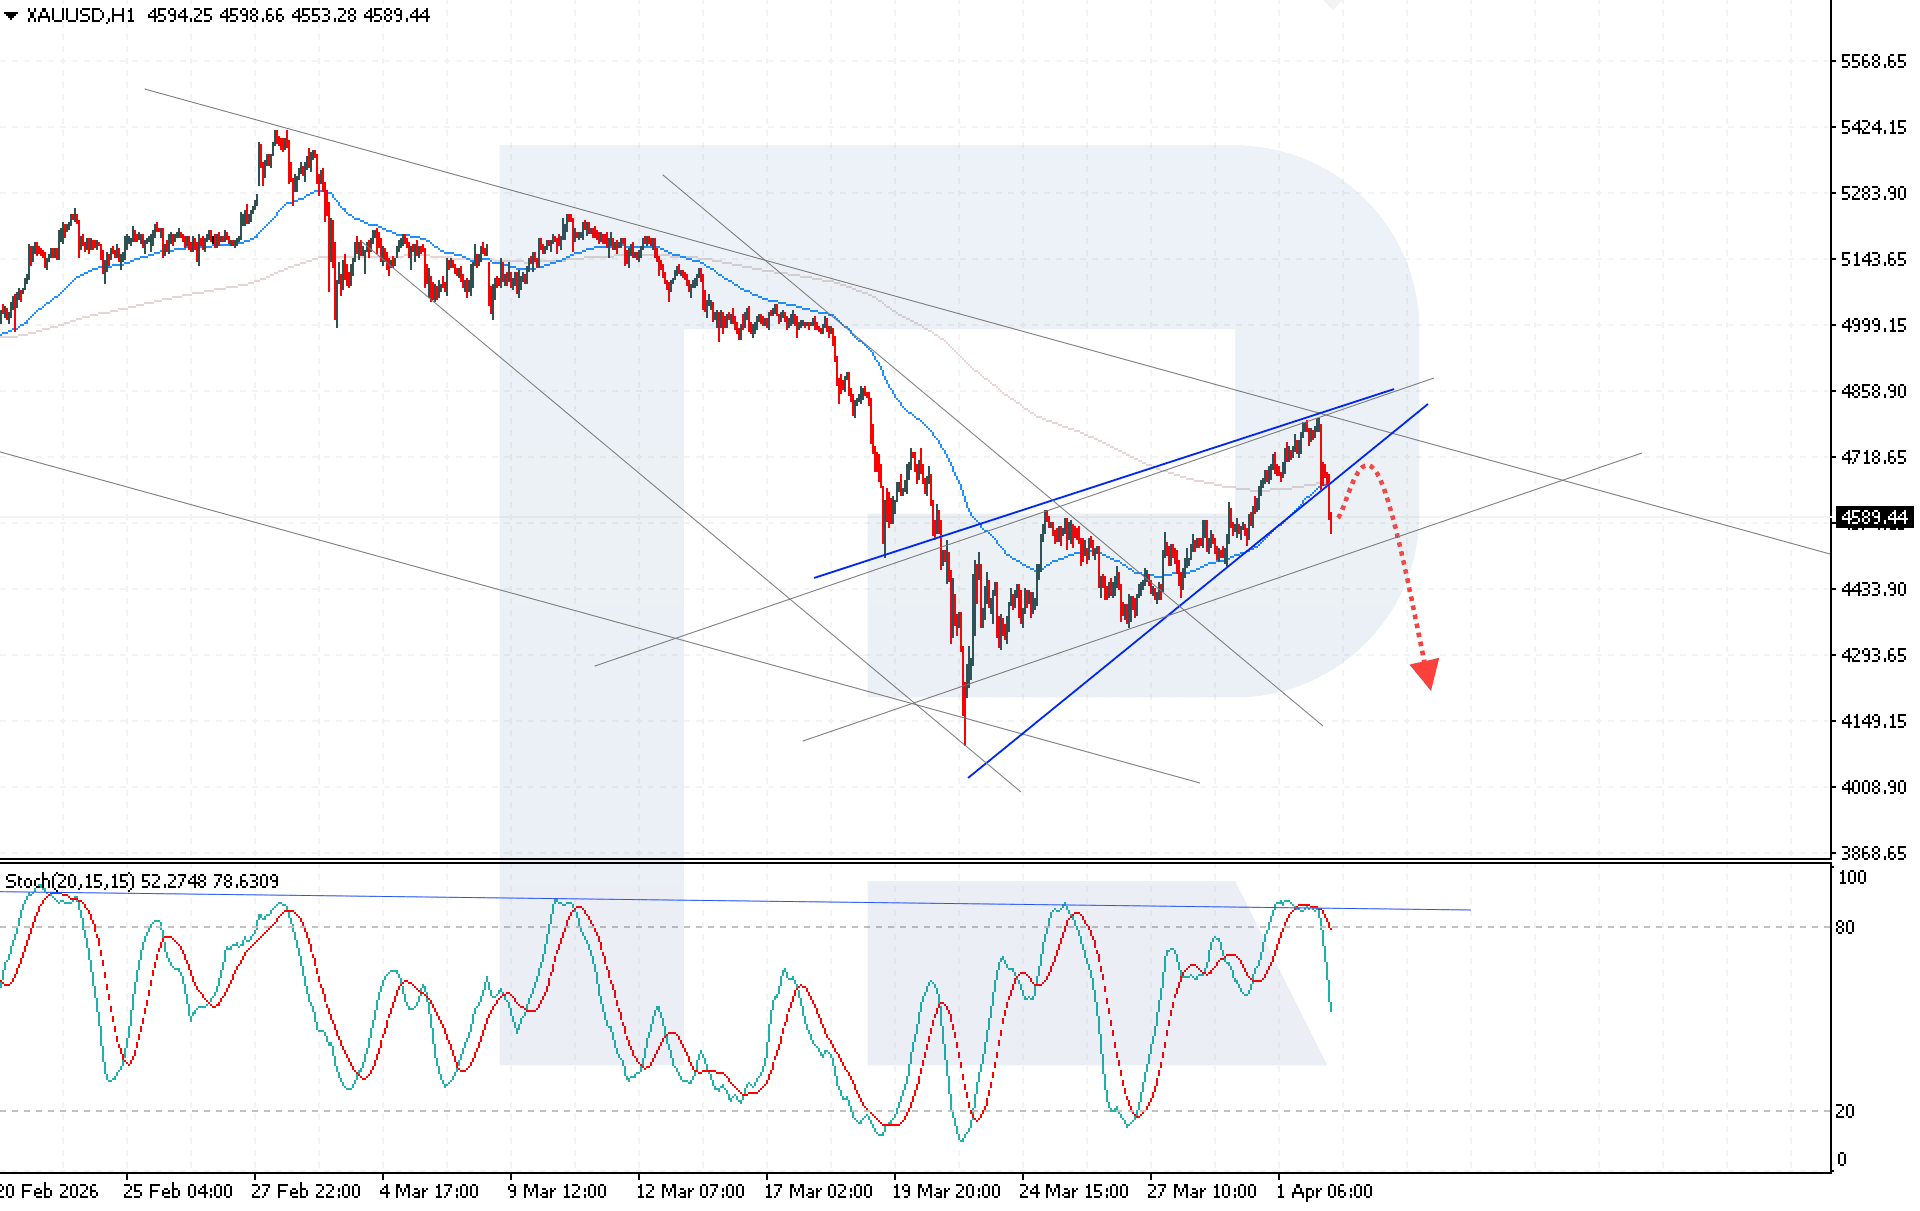
XAUUSD is losing ground amid uncertainty in the Middle East XAUUSD prices are moving into a corrective decline amid technical signals and increasing geopolitical tensions. Quotes currently stand at 4,589 USD. Discover more in our analysis for 2 April 2026 Technical outlook XAUUSD quotes have consolidated below the EMA-65, indicating growing selling pressure. A breakout below the lower boundary of the Wedge pattern further confirms weakness, signalling the completion of the corrective growth. The XAUUSD forecast for today suggests a decline with a target at 4,275 USD. Read more - Gold Forecast Attention! Forecasts presented in this section only reflect the author’s private opinion and should not be considered as guidance for trading. RoboForex bears no responsibility for trading results based on trading recommendations described in these analytical reviews. Sincerely, The RoboForex Team
-
roboforex Market Fundamental Analysis by RoboForex
RBFX Support replied to RBFX Support's topic in Fundamental Analysis
EURUSD is down again: everyone wants the safe-haven dollar The EURUSD pair slipped to 1.1532. The US dollar is in a strong position, as no one expects a quick Federal Reserve rate cut. Find more details in our analysis for 2 April 2026. EURUSD forecast: key takeaways The EURUSD pair is retreating as external pressure mounts The market remains negative on Middle East risks EURUSD forecast for 2 April 2026: 1.1500 Fundamental analysis The EURUSD rate fell to 1.1532 on Thursday. The US dollar was supported by uncertainty over the timing of the end to the conflict in the Middle East following statements by US President Donald Trump. In his evening address the previous day, Trump noted that Washington was close to accomplishing its key strategic objectives in Iran, but allowed for the possibility of new hard strikes over the next two to three weeks. This increased tension and maintained a high degree of uncertainty for global markets. RoboForex Market Analysis & Forex Forecasts Attention! Forecasts presented in this section only reflect the author’s private opinion and should not be considered as guidance for trading. RoboForex bears no responsibility for trading results based on trading recommendations described in these analytical reviews. Sincerely, The RoboForex Team -
Market Technical Analysis by RoboForex
RBFX Support replied to RBFX Support's topic in Technical Analysis
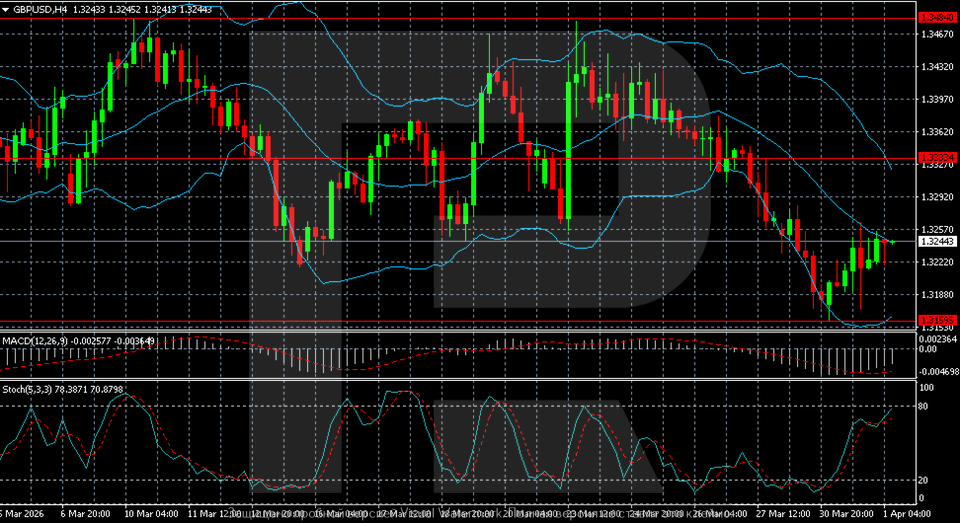
GBPUSD is trying to rise, but there is a catch in the form of energy and prices The GBPUSD pair rose to 1.3244. March turned out to be a weak month for the pound sterling. More details are in our analysis for 1 April 2026. Technical outlook The H4 chart for GBPUSD shows that after attempts to rise in the first half of March, the market formed a local top near 1.3480–1.3500, from which a steady decline began. The price moved into a pattern of lower highs and lower lows. The GBPUSD pair is attempting to rise, but its upside potential still looks limited. Read more - GBPUSD Forecast Attention! Forecasts presented in this section only reflect the author’s private opinion and should not be considered as guidance for trading. RoboForex bears no responsibility for trading results based on trading recommendations described in these analytical reviews. Sincerely, The RoboForex Team
-
roboforex Market Fundamental Analysis by RoboForex
RBFX Support replied to RBFX Support's topic in Fundamental Analysis
US 30 forecast: the index continues to fall after a correction After a correction, the US 30 index resumed its downward movement. The US 30 forecast for today is negative. US 30 forecast: key takeaways Recent data: US core PCE index rose to 3.1% Market impact: the data has a negative impact on the stock market Fundamental analysis The US core PCE data can generally be viewed as moderately neutral, but with a slightly negative bias for the US 30 index. The actual reading was 3.1% year-on-year, in line with forecasts but above the previous level of 3.0%. This suggests that underlying inflation pressure is not easing as quickly as the market and the Federal Reserve would like. For the US 30 index, the reaction is typically restrained, but more likely cautiously negative. The index comprises large, established companies, many of which operate in the industrial, financial, consumer, and healthcare sectors. RoboForex Market Analysis & Forex Forecasts Attention! Forecasts presented in this section only reflect the author’s private opinion and should not be considered as guidance for trading. RoboForex bears no responsibility for trading results based on trading recommendations described in these analytical reviews. Sincerely, The RoboForex Team -
roboforex Market Fundamental Analysis by RoboForex
RBFX Support replied to RBFX Support's topic in Fundamental Analysis
US 500 forecast: the index falls more than 10% The US 500 is falling rapidly, exceeding average seasonal fluctuation levels. The US 500 forecast for today is negative. US 500 forecast: key takeaways Recent data: US services PMI preliminarily came in at 51.1 in March Market impact: the data is negative for the stock market Fundamental analysis The release of the US services PMI data turned out to be moderately weak for equities. The actual US services PMI came in at 51.1 compared to a forecast of 52.0 and a previous reading of 51.7. This means the services sector is still expanding, since the index remains above 50.0, but the pace of growth slowed more than the market expected. For the US 500, such news more often creates a moderately negative outlook in the short term. This is especially noticeable if the market had been positioned for stronger macroeconomic data ahead of the release. RoboForex Market Analysis & Forex Forecasts Attention! Forecasts presented in this section only reflect the author’s private opinion and should not be considered as guidance for trading. RoboForex bears no responsibility for trading results based on trading recommendations described in these analytical reviews. Sincerely, The RoboForex Team -
Market Technical Analysis by RoboForex
RBFX Support replied to RBFX Support's topic in Technical Analysis
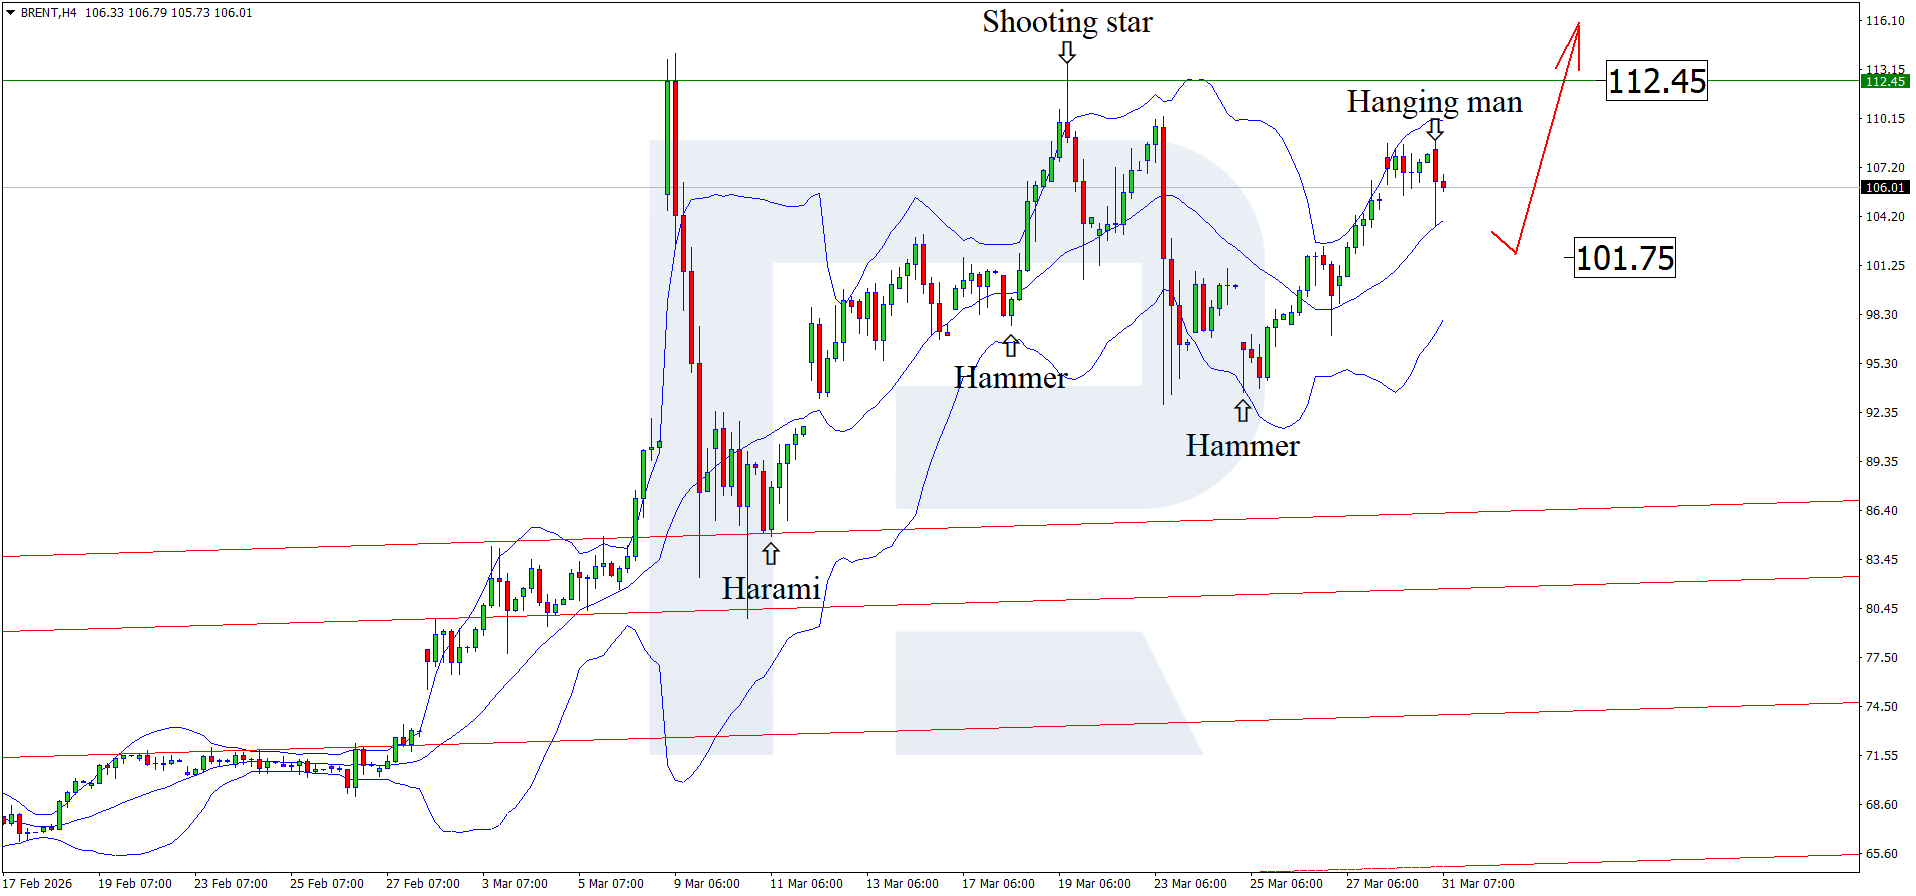
Brent is on the way to new records – what to expect from prices until 6 April Brent quotes are forming a correction in anticipation of news from the Middle East and are hovering around 106.20 USD. Discover more in our analysis for 31 March 2026. Technical outlook After testing the upper Bollinger Band, Brent prices formed a Hanging Man reversal pattern on the H4 chart. At this stage, quotes are forming a correction, with a potential pullback target at 101.75 USD. Oil continues its uptrend amid statements by the US President and the blocking of supplies through the Strait of Hormuz. Read more - Brent Forecast Attention! Forecasts presented in this section only reflect the author’s private opinion and should not be considered as guidance for trading. RoboForex bears no responsibility for trading results based on trading recommendations described in these analytical reviews. Sincerely, The RoboForex Team
-
roboforex Market Fundamental Analysis by RoboForex
RBFX Support replied to RBFX Support's topic in Fundamental Analysis
160.00 is the psychological barrier for USDJPY: who will win, the dollar or the Japanese yen The yen is on the verge of intervention by the BoJ. The USDJPY pair broke above the psychological 160.00 mark and, after correcting, is trading around the 159.60 level. Discover more in our analysis for 30 March 2026. USDJPY forecast: key takeaways After testing the 160.46 mark, the USDJPY pair plummeted The BoJ prepares for an intervention The Japanese regulator is ready to defend its currency at any cost Fundamental analysis Today, 30 March 2026, the USDJPY currency pair staged a real drama worthy of a Hollywood blockbuster. Within just a few hours, the exchange rate first hit a new 20-month high by testing the 160.46 mark and then plummeted, reflecting the harshest intervention threats from the Japanese authorities in the past two years. At the moment, quotes are consolidating around 159.60, balancing on a thin line between the real threat of currency intervention by the BoJ and the dollar as a safe-haven currency. RoboForex Market Analysis & Forex Forecasts Attention! Forecasts presented in this section only reflect the author’s private opinion and should not be considered as guidance for trading. RoboForex bears no responsibility for trading results based on trading recommendations described in these analytical reviews. Sincerely, The RoboForex Team -
Market Technical Analysis by RoboForex
RBFX Support replied to RBFX Support's topic in Technical Analysis
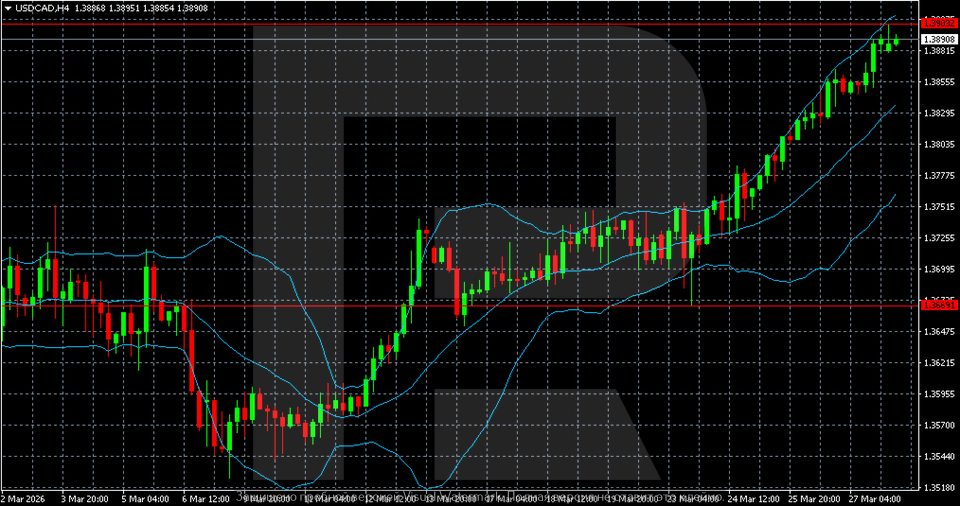
USDCAD is set to move higher: the US dollar is the clear favourite The USDCAD pair rose to 1.3890, with developments in the Middle East and risk aversion weighing on the Canadian dollar. Find more details in our analysis for 30 March 2026. Technical outlook The USDCAD H4 chart shows a stable uptrend, which formed after a reversal from the area around 1.3550 in early March. The price is consistently forming higher highs and higher lows, indicating buyer dominance. The USDCAD pair continues to rise amid external market conditions. Read more - USDCAD Forecast Attention! Forecasts presented in this section only reflect the author’s private opinion and should not be considered as guidance for trading. RoboForex bears no responsibility for trading results based on trading recommendations described in these analytical reviews. Sincerely, The RoboForex Team
-
Market Technical Analysis by RoboForex
RBFX Support replied to RBFX Support's topic in Technical Analysis
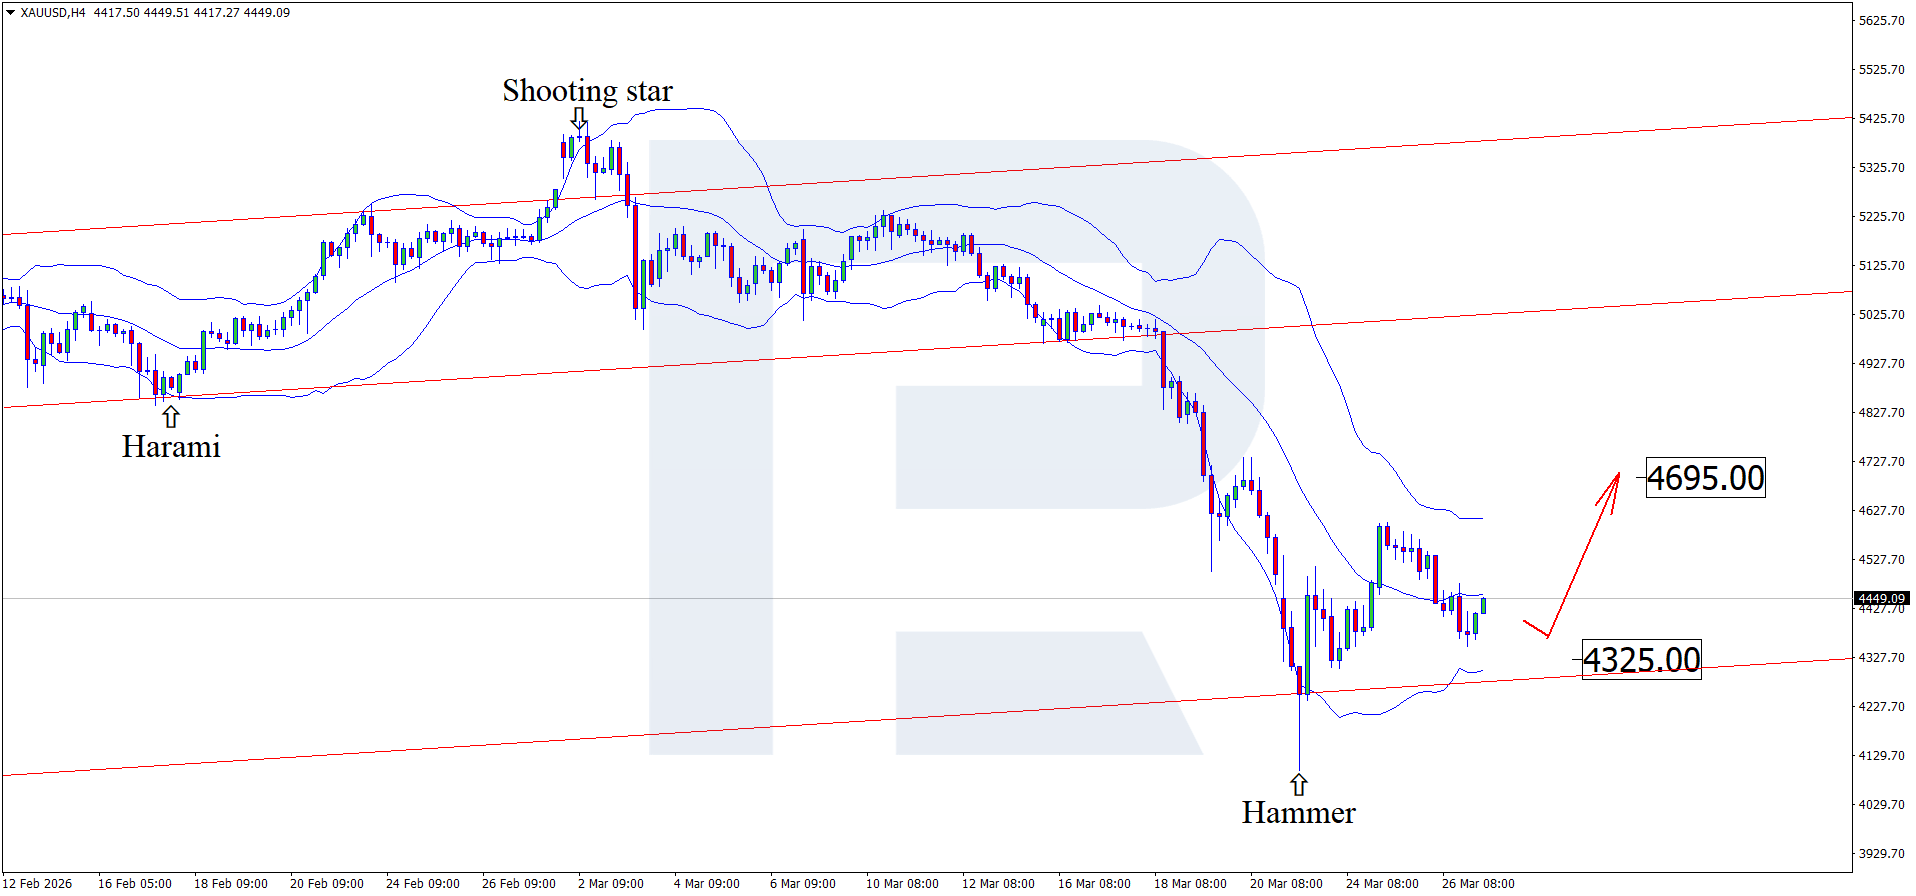
Gold is losing its safe-haven status: why paradoxical factors may send XAUUSD tumbling Gold is not giving up its attempts to recover as a safe-haven asset, with XAUUSD quotes testing the 4,475 USD level. Find more details in our analysis for 27 March 2026 Technical outlook On the H4 chart, XAUUSD formed a Hammer reversal pattern near the lower Bollinger Band. In the near term, following this pattern’s signal, quotes may form another upward wave. Since XAUUSD prices remain within an ascending channel, the 4,695 USD level may act as the upside target. After declining, gold prices are once again trying to recover their position. Read more - Gold Forecast Attention! Forecasts presented in this section only reflect the author’s private opinion and should not be considered as guidance for trading. RoboForex bears no responsibility for trading results based on trading recommendations described in these analytical reviews. Sincerely, The RoboForex Team
-
roboforex Market Fundamental Analysis by RoboForex
RBFX Support replied to RBFX Support's topic in Fundamental Analysis
The Australian dollar back in play: how US inflation and the Consumer Sentiment Index may strengthen AUDUSD After losing ground, the Australian dollar is making another attempt to recover, with AUDUSD quotes testing the 0.6890 level. Discover more in our analysis for 27 March 2026. AUDUSD forecast: key takeaways US inflation expectations from the University of Michigan: previously at 3.4%, projected at 3.4% University of Michigan Consumer Sentiment Index: previously at 56.6, projected at 55.5 AUDUSD forecast for 27 March 2026: 0.6960 Fundamental analysis Today’s AUDUSD forecast favours the Australian dollar, which has every chance of recovering against the USD, with the pair currently trading around 0.6890. According to the forecast for 27 March 2026, US inflation expectations from the University of Michigan may remain unchanged at 3.4%. It is worth remembering that the indicator had been falling for several months from 4.2 to 3.4. Actual data at the previous level can be considered neutral, indicating some stabilisation in the US economy. However, a worse-than-expected actual reading may affect the AUDUSD rate, strengthening the Australian dollar. RoboForex Market Analysis & Forex Forecasts Attention! Forecasts presented in this section only reflect the author’s private opinion and should not be considered as guidance for trading. RoboForex bears no responsibility for trading results based on trading recommendations described in these analytical reviews. Sincerely, The RoboForex Team -
roboforex Market Fundamental Analysis by RoboForex
RBFX Support replied to RBFX Support's topic in Fundamental Analysis
Brent oil prices back at 100 USD: what is hidden behind Iran’s threats and geopolitics After falling sharply, Brent prices are recovering and testing the 100.00 USD mark. Find out more in our analysis for 26 March 2026. Brent forecast: key takeaways Iraq and its neighbours are being forced to cut oil production Oil continues to trade on the news Brent forecast for 26 March 2026: 105.50 Fundamental analysis The Brent fundamental analysis for today, 26 March 2026, takes into account that Brent crude is playing a dangerous pricing game, recovering the previous session’s losses amid contradictory signals about negotiations between the US and Iran. In the morning, oil prices again moved above the 100 USD per barrel mark. The main narrative of today is the market’s understanding that the key artery of global oil trade remains paralysed despite a temporary easing in rhetoric. Iran officially notified the International Maritime Organization that it would allow passage through the strait only to vessels from friendly countries, subject to coordination and payment of fees. RoboForex Market Analysis & Forex Forecasts Attention! Forecasts presented in this section only reflect the author’s private opinion and should not be considered as guidance for trading. RoboForex bears no responsibility for trading results based on trading recommendations described in these analytical reviews. Sincerely, The RoboForex Team -
Market Technical Analysis by RoboForex
RBFX Support replied to RBFX Support's topic in Technical Analysis
USDJPY ignores BoJ signals and continues to rise The USDJPY rate continues its confident upward movement, supported by geopolitical tension and steady demand for the US dollar. The rate currently stands at 159.41. Discover more in our analysis for 26 March 2026. Technical outlook USDJPY quotes have consolidated above the upper boundary of the previously formed descending channel, indicating a shift in the short-term trend towards growth. Buyers are confidently holding the price above the EMA-65, confirming stronger bullish pressure. The combination of geopolitical risks, steady demand for the US dollar. Read more - USDJPY Forecast Attention! Forecasts presented in this section only reflect the author’s private opinion and should not be considered as guidance for trading. RoboForex bears no responsibility for trading results based on trading recommendations described in these analytical reviews. Sincerely, The RoboForex Team
-
Market Technical Analysis by RoboForex
RBFX Support replied to RBFX Support's topic in Technical Analysis
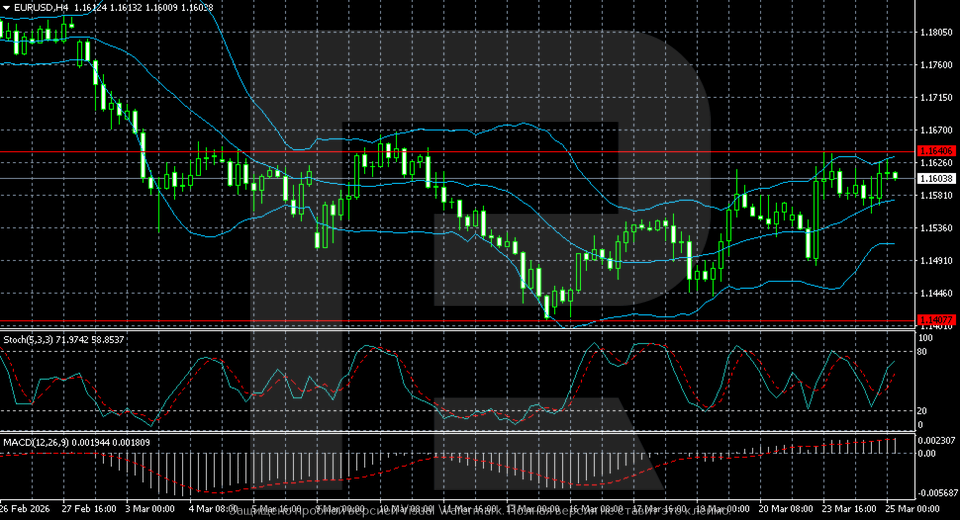
EURUSD may edge higher: fears about US prices have eased The EURUSD pair rose to 1.1603. A local reduction in tensions in the Middle East is encouraging the market. More details are in our analysis for 25 March 2026. Technical outlook The H4 chart for EURUSD shows that after declining at the beginning of March, the market formed a local bottom around 1.1400, from which a recovery began. Before that, the pair had been consistently posting lower highs and lower lows, which pointed to sustained downward momentum. The EURUSD pair is rising in a limited way within the accumulation phase. Read more - EURUSD Forecast Attention! Forecasts presented in this section only reflect the author’s private opinion and should not be considered as guidance for trading. RoboForex bears no responsibility for trading results based on trading recommendations described in these analytical reviews. Sincerely, The RoboForex Team
-
roboforex Market Fundamental Analysis by RoboForex
RBFX Support replied to RBFX Support's topic in Fundamental Analysis
USDJPY is testing 160.00: can BoJ statements withstand the dollar’s rise After the publication of the BoJ meeting minutes, the yen continues to lose ground, with quotes testing the 159.00 mark. More details are in our analysis for 25 March 2026. USDJPY forecast: key takeaways The minutes of the Bank of Japan’s January meeting have been published The oil shock is choking Japan’s economy USDJPY forecast for 25 March 2026: 160.00 Fundamental analysis The forecast for 25 March 2026 looks positive for the USD, as the USDJPY pair is forming an upward wave after a correction and may continue to rise. At the moment, quotes are trading around the 159.00 mark. This morning, the minutes of the Bank of Japan’s January meeting were published, and they turned out to be far more hawkish than the market had expected. The document is literally filled with the regulator’s determination to tighten monetary policy. RoboForex Market Analysis & Forex Forecasts Attention! Forecasts presented in this section only reflect the author’s private opinion and should not be considered as guidance for trading. RoboForex bears no responsibility for trading results based on trading recommendations described in these analytical reviews. Sincerely, The RoboForex Team -
Market Technical Analysis by RoboForex
RBFX Support replied to RBFX Support's topic in Technical Analysis
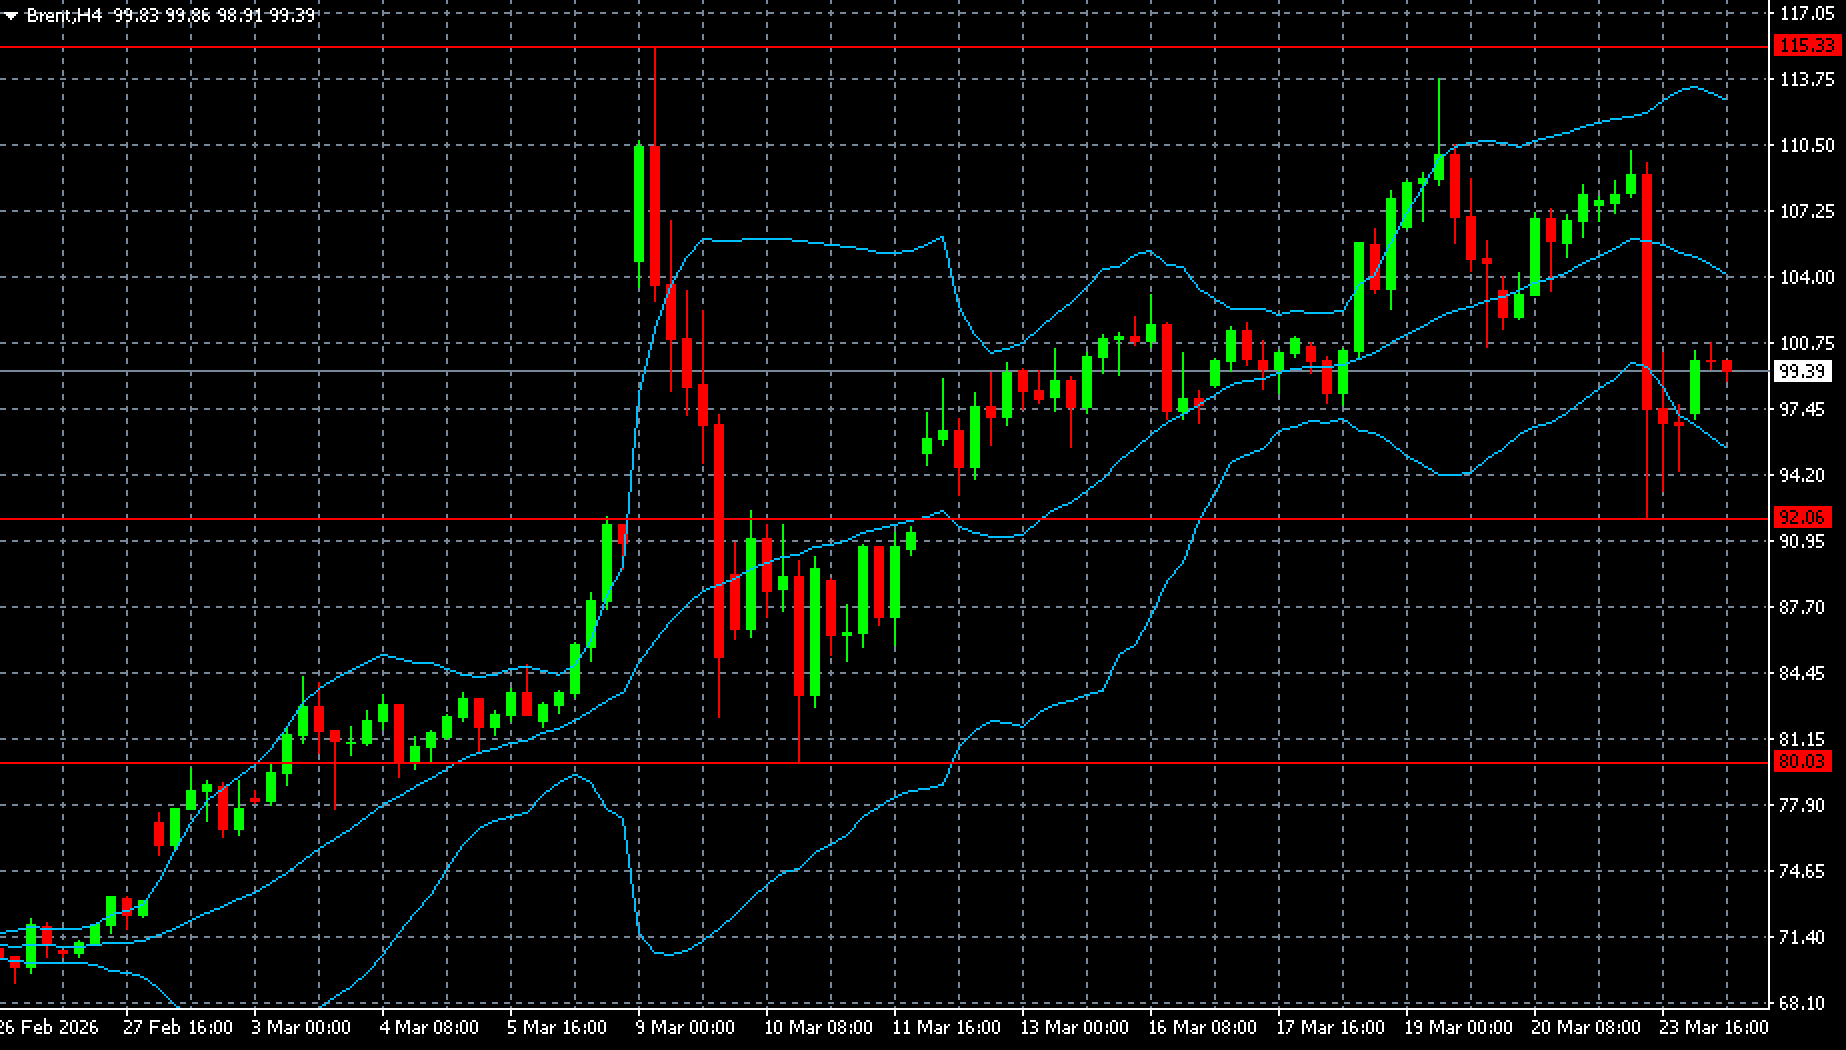
Brent has a chance to rise again: the Middle East remains in conflict Brent oil recovered some of its losses and returned to 99.40 USD. Negotiations on Iran have not yet been confirmed. Find out more in our analysis for 24 March 2026. Technical outlook The Brent H4 chart shows that a strong upward momentum formed at the start of the period, with prices climbing from the area around 80 to the zone above 110. The move was accompanied by an expansion of Bollinger Bands, indicating strong demand and faster trend development. Brent prices are recovering after the previous day’s collapse because news on Iran has not been confirmed. Read more - Brent Forecast Attention! Forecasts presented in this section only reflect the author’s private opinion and should not be considered as guidance for trading. RoboForex bears no responsibility for trading results based on trading recommendations described in these analytical reviews. Sincerely, The RoboForex Team
-
roboforex Market Fundamental Analysis by RoboForex
RBFX Support replied to RBFX Support's topic in Fundamental Analysis
Gold is losing its crown: why the dollar is now at its peak while XAUUSD is falling After the decline, gold (XAUUSD) is attempting to recover, with quotes testing the 4,370 USD mark. Discover more in our analysis for 24 March 2026 XAUUSD forecast: key takeaways US manufacturing PMI: previously at 51.6, projected at 51.5 US services PMI: previously at 51.7, projected at 52.0 XAUUSD forecast for 24 March 2026: 4,612 Fundamental analysis Today’s XAUUSD price forecast shows that gold prices continue their corrective wave, currently hovering around the 4,370 USD per ounce level. Yesterday, 23 March, the market went on a real rollercoaster ride: prices first plummeted below 4,100 USD, breaking through five support levels in a row, and then sharply surged by more than 300 USD on news from the White House. RoboForex Market Analysis & Forex Forecasts Attention! Forecasts presented in this section only reflect the author’s private opinion and should not be considered as guidance for trading. RoboForex bears no responsibility for trading results based on trading recommendations described in these analytical reviews. Sincerely, The RoboForex Team -
roboforex Market Fundamental Analysis by RoboForex
RBFX Support replied to RBFX Support's topic in Fundamental Analysis
What lies ahead for USDCAD: oil and the Bank of Canada versus the US Fed The USDCAD pair continues its correction while waiting for fresh drivers. Quotes are hovering around 1.3725. Discover more in our analysis for 23 March 2026. USDCAD forecast: key takeaways Rising oil prices increase export revenues and capital inflows into Canada On 18 March 2026, the Bank of Canada kept the key rate at 2.0% The US Federal Reserve left the rate unchanged at 3.75% Fundamental analysis Today’s USDCAD outlook favours the Canadian dollar: after the correction, the pair may form a new downward wave, with quotes currently hovering around 1.3725. The main driver today is the escalation around the Strait of Hormuz. US President Donald Trump is considering a ground operation to seize Iran’s Kharg Island, a key oil hub. This statement pushed oil prices above 100.00 USD per barrel. RoboForex Market Analysis & Forex Forecasts Attention! Forecasts presented in this section only reflect the author’s private opinion and should not be considered as guidance for trading. RoboForex bears no responsibility for trading results based on trading recommendations described in these analytical reviews. Sincerely, The RoboForex Team -
Market Technical Analysis by RoboForex
RBFX Support replied to RBFX Support's topic in Technical Analysis
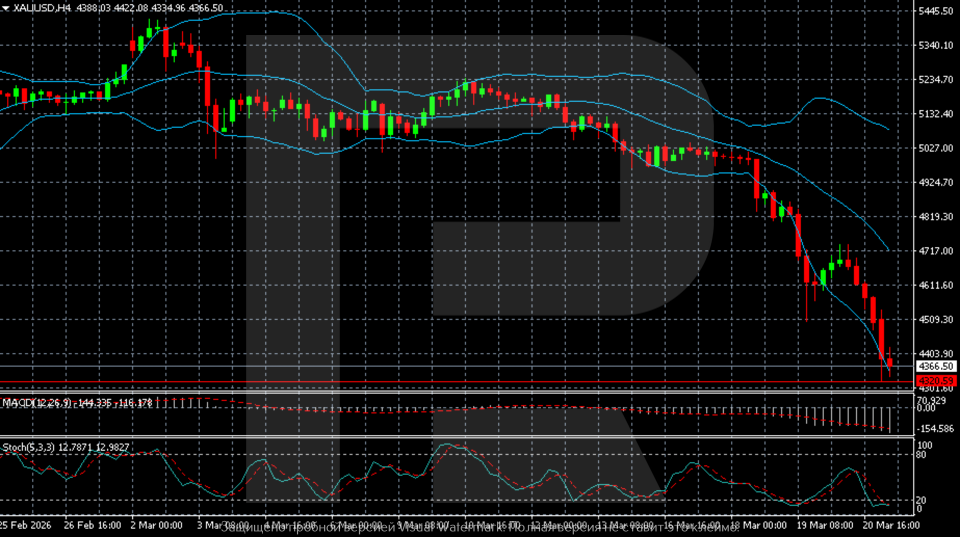
Gold (XAUUSD) plunges: the Middle East has changed everything Gold (XAUUSD) prices fell to 4,366 USD as markets fear accelerating inflation and a prolonged pause in central bank policy. Discover more in our analysis for 23 March 2026. Technical outlook The gold (XAUUSD) H4 chart shows that after forming a local peak near 5,400, the market shifted into a sustained decline. Since early March, the structure has turned bearish, with lower highs and lower lows forming, indicating stronger selling pressure. Gold prices are falling, and the downtrend is still accelerating. Read more - Gold Forecast Attention! Forecasts presented in this section only reflect the author’s private opinion and should not be considered as guidance for trading. RoboForex bears no responsibility for trading results based on trading recommendations described in these analytical reviews. Sincerely, The RoboForex Team