⤴️-Paid Ad- Check advertising disclaimer here. Add your banner here.🔥


RBFX Support
-
Posts
1,502 -
Joined
-
Last visited
Content Type
Profiles
Forums
Articles
Everything posted by RBFX Support
-
Market Technical Analysis by RoboForex
RBFX Support replied to RBFX Support's topic in Technical Analysis
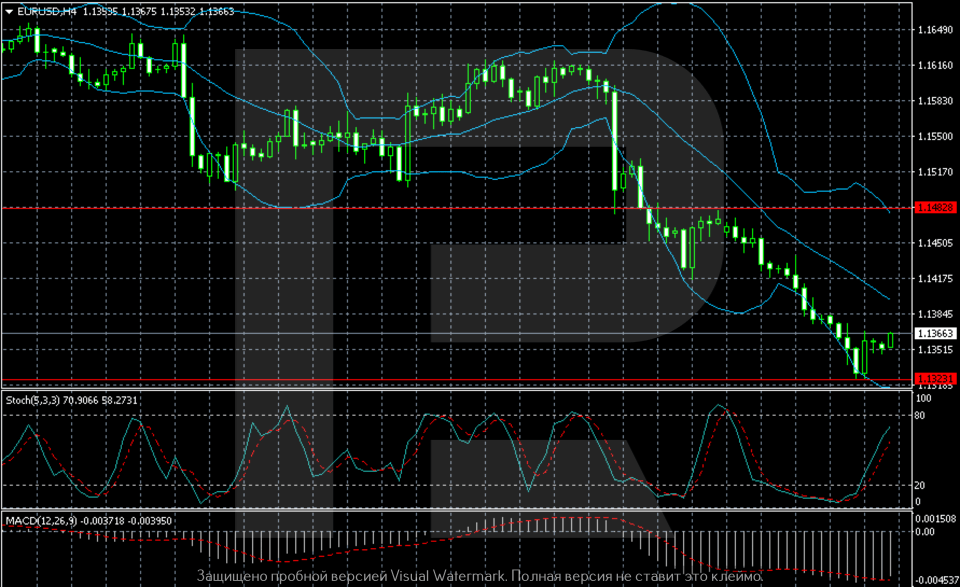
EURUSD looks weak: the sell-off is not over yet The EURUSD pair paused at 1.1366, with today’s focus on the US PCE report. Technical outlook On the H4 chart, the EURUSD pair remains in a pronounced downtrend. After breaking below the 1.1433 support level, selling pressure increased, and quotes hit a local low near 1.1323. The EURUSD pair fell to its lowest level in almost a year amid strong demand for the US dollar. Read more - EURUSD Forecast Attention! Forecasts presented in this section only reflect the author’s private opinion and should not be considered as guidance for trading. RoboForex bears no responsibility for trading results based on trading recommendations described in these analytical reviews. Sincerely, The RoboForex Team
-
roboforex Market Fundamental Analysis by RoboForex
RBFX Support replied to RBFX Support's topic in Fundamental Analysis
US 30 forecast: the index has completed its correction The US 30 index is trading in an uptrend and has completed its correction, suggesting a new all-time high. Today’s US 30 forecast is positive. US 30 forecast: key takeaways Recent data: the US Federal Reserve kept its interest rate at 3.75% Market impact: the data has a negative effect on the equity market Fundamental analysis For the US 30 index, this release appears rather neutral to moderately negative in the short term. The very fact that the rate was left at 3.50–3.75% is not in itself a shock for the market if investors had already priced in such a decision. However, the more important signal is not the current decision, but the change in the Federal Reserve’s rhetoric. For the US 30 index, which includes major industrial, financial, consumer, and technology companies, this creates pressure through a higher cost of capital and more cautious expectations for corporate earnings. RoboForex Market Analysis & Forex Forecasts Attention! Forecasts presented in this section only reflect the author’s private opinion and should not be considered as guidance for trading. RoboForex bears no responsibility for trading results based on trading recommendations described in these analytical reviews. Sincerely, The RoboForex Team -
Market Technical Analysis by RoboForex
RBFX Support replied to RBFX Support's topic in Technical Analysis
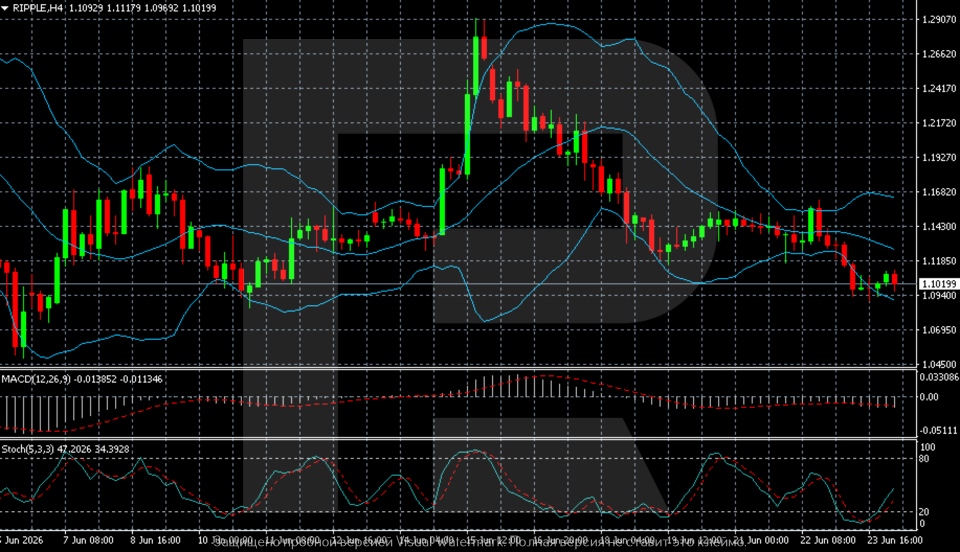
XRPUSD is range-bound, but the baseline scenario is a decline The XRPUSD price is holding steady at 1.1019. The market is keeping a close eye on the fundamental outlook, while the technical picture is moderate. Technical outlook On the H4 chart, XRPUSD remains under downward pressure after a sharp rise to a multi-week high near 1.2900 in mid-June. Subsequent attempts by buyers to hold the initiative failed, and the price gradually returned to the 1.1000–1.1100 area. The XRPUSD price has stopped moving sharply and has entered a range. Read more - XRPUSD Forecast Attention! Forecasts presented in this section only reflect the author’s private opinion and should not be considered as guidance for trading. RoboForex bears no responsibility for trading results based on trading recommendations described in these analytical reviews. Sincerely, The RoboForex Team
-
Market Technical Analysis by RoboForex
RBFX Support replied to RBFX Support's topic in Technical Analysis
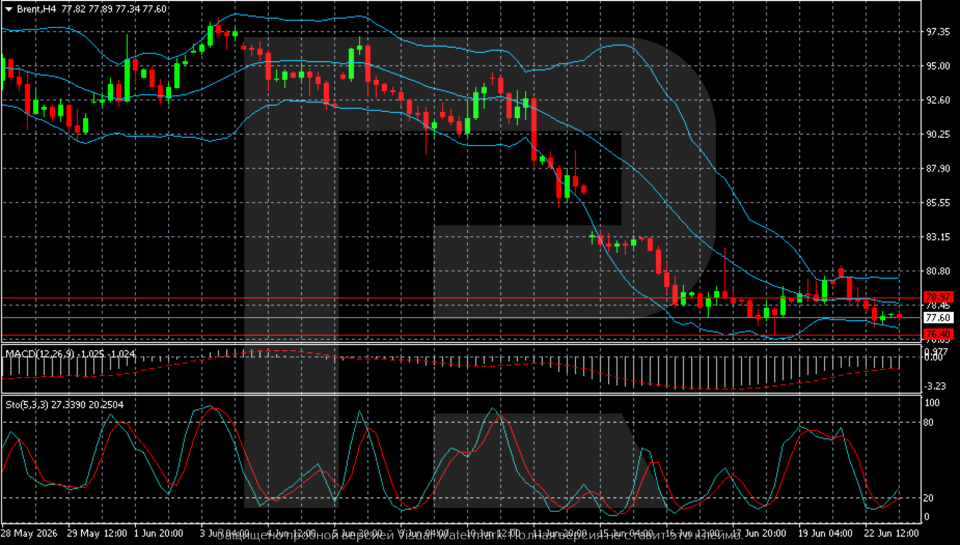
Brent under pressure: sellers have the upper hand Brent is trading near 77.60 USD. The market is pricing in the removal of part of the geopolitical premium and news from Hormuz. Technical outlook On the H4 chart, Brent remains in a downtrend after the sharp decline from the June highs near 97. After plunging into the 77–78 per barrel area, the market moved into a consolidation phase, but buyers have so far failed to form a stable recovery. Brent prices remain under pressure as part of the geopolitical premium is removed. Read more - Brent Forecast Attention! Forecasts presented in this section only reflect the author’s private opinion and should not be considered as guidance for trading. RoboForex bears no responsibility for trading results based on trading recommendations described in these analytical reviews. Sincerely, The RoboForex Team
-
roboforex Market Fundamental Analysis by RoboForex
RBFX Support replied to RBFX Support's topic in Fundamental Analysis
Ethereum (ETHUSD) is betting on Ethlabs Ethereum (ETHUSD) is hovering around 1,728 USD on Tuesday, with the market excited about the idea of launching Ethlabs. ETHUSD forecast: key takeaways The Ethereum (ETHUSD) price is moving sideways Ethereum’s status as core infrastructure may be strengthened ETHUSD forecast for 23 June 2026: 1,710 or 1,775 Fundamental analysis The price of Ethereum (ETHUSD) is holding near 1,728 USD after a modest rise. The launch of the independent research organisation Ethlabs may support the long-term investment case for Ethereum. Former leading developers from the Ethereum Foundation created the new non-profit centre, which will focus on preparing the network for broader institutional adoption. Ethlabs’ priorities include faster settlement, cross-network interoperability, greater network scalability, better infrastructure for issuing tokenised assets, and further development of Ethereum’s economic model RoboForex Market Analysis & Forex Forecasts Attention! Forecasts presented in this section only reflect the author’s private opinion and should not be considered as guidance for trading. RoboForex bears no responsibility for trading results based on trading recommendations described in these analytical reviews. Sincerely, The RoboForex Team -
roboforex Market Fundamental Analysis by RoboForex
RBFX Support replied to RBFX Support's topic in Fundamental Analysis
EURUSD has yielded to the sellers: there is a chance of a move lower The EURUSD pair is holding low near 1.1464 as market sentiment has shifted in favour of the US dollar. EURUSD forecast: key takeaways The EURUSD pair remains under the control of the bears The market is monitoring the Middle East and preparing for the release of US PCE data EURUSD forecast for 22 June 2026: 1.1415 Fundamental analysis The EURUSD rate is hovering around 1.1464 on Monday. Investors are assessing new signals around a peace settlement between the US and Iran, while also preparing for the release of the key US inflation report. According to the latest reports, Washington and Tehran have agreed on a roadmap to conclude a final agreement within the next 60 days. RoboForex Market Analysis & Forex Forecasts Attention! Forecasts presented in this section only reflect the author’s private opinion and should not be considered as guidance for trading. RoboForex bears no responsibility for trading results based on trading recommendations described in these analytical reviews. Sincerely, The RoboForex Team -
Market Technical Analysis by RoboForex
RBFX Support replied to RBFX Support's topic in Technical Analysis
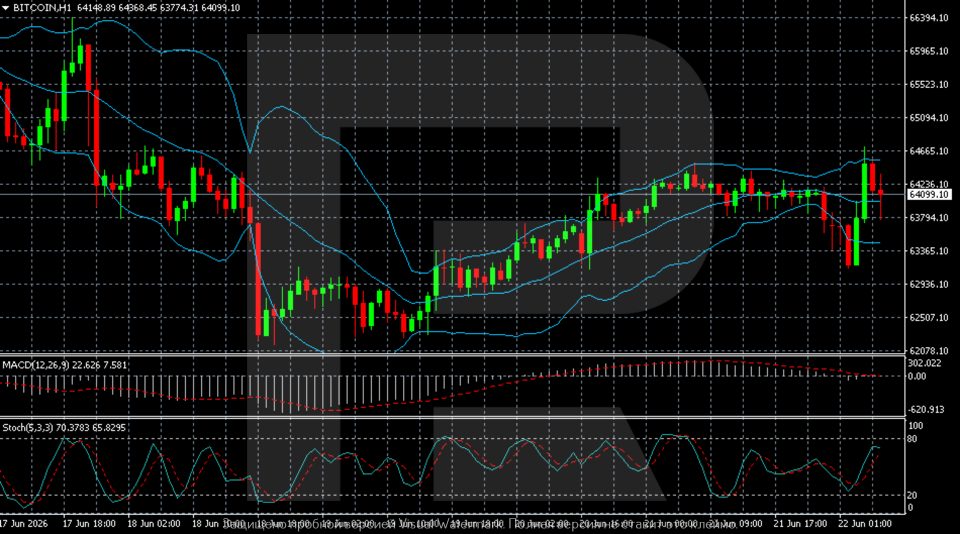
Bitcoin at great risk if the Middle East does not calm down The BTC price is falling towards 64,100 USD, with investors concerned about geopolitical uncertainty. Technical outlook On the hourly chart, BTCUSD continues to trade sideways after recovering from the local low around 62,200. In recent days, buyers managed to push quotes back above 64,000, but an attempt to consolidate above 64,500 ended in a correction. The BTC price has fallen and then paused. Read more - BTCUSD Forecast Attention! Forecasts presented in this section only reflect the author’s private opinion and should not be considered as guidance for trading. RoboForex bears no responsibility for trading results based on trading recommendations described in these analytical reviews. Sincerely, The RoboForex Team
-
roboforex Market Fundamental Analysis by RoboForex
RBFX Support replied to RBFX Support's topic in Fundamental Analysis
Dogecoin is losing ground as retail investors move away from meme coins DOGEUSD is falling for the fourth day in a row amid capital rotation into other sectors. The current quote is 0.08224. DOGEUSD forecast: key takeaways Retail investors are showing less interest in meme coins and are reallocating capital into AI tokens and real-world asset tokenisation projects The market views the activity of large holders as a potential signal of stronger pressure from sellers Institutional demand for Dogecoin remains weak Fundamental analysis Retail investors are gradually losing interest in meme coins and shifting capital into more fundamentally driven market segments, namely AI tokens and real-world asset tokenisation projects. The price of Dogecoin has been falling for the fourth trading session in a row. Over the past week, large holders moved more than 420 million DOGE to exchanges and third-party wallets, which the market views as a potential signal of stronger bearish pressure. RoboForex Market Analysis & Forex Forecasts Attention! Forecasts presented in this section only reflect the author’s private opinion and should not be considered as guidance for trading. RoboForex bears no responsibility for trading results based on trading recommendations described in these analytical reviews. Sincerely, The RoboForex Team -
Market Technical Analysis by RoboForex
RBFX Support replied to RBFX Support's topic in Technical Analysis
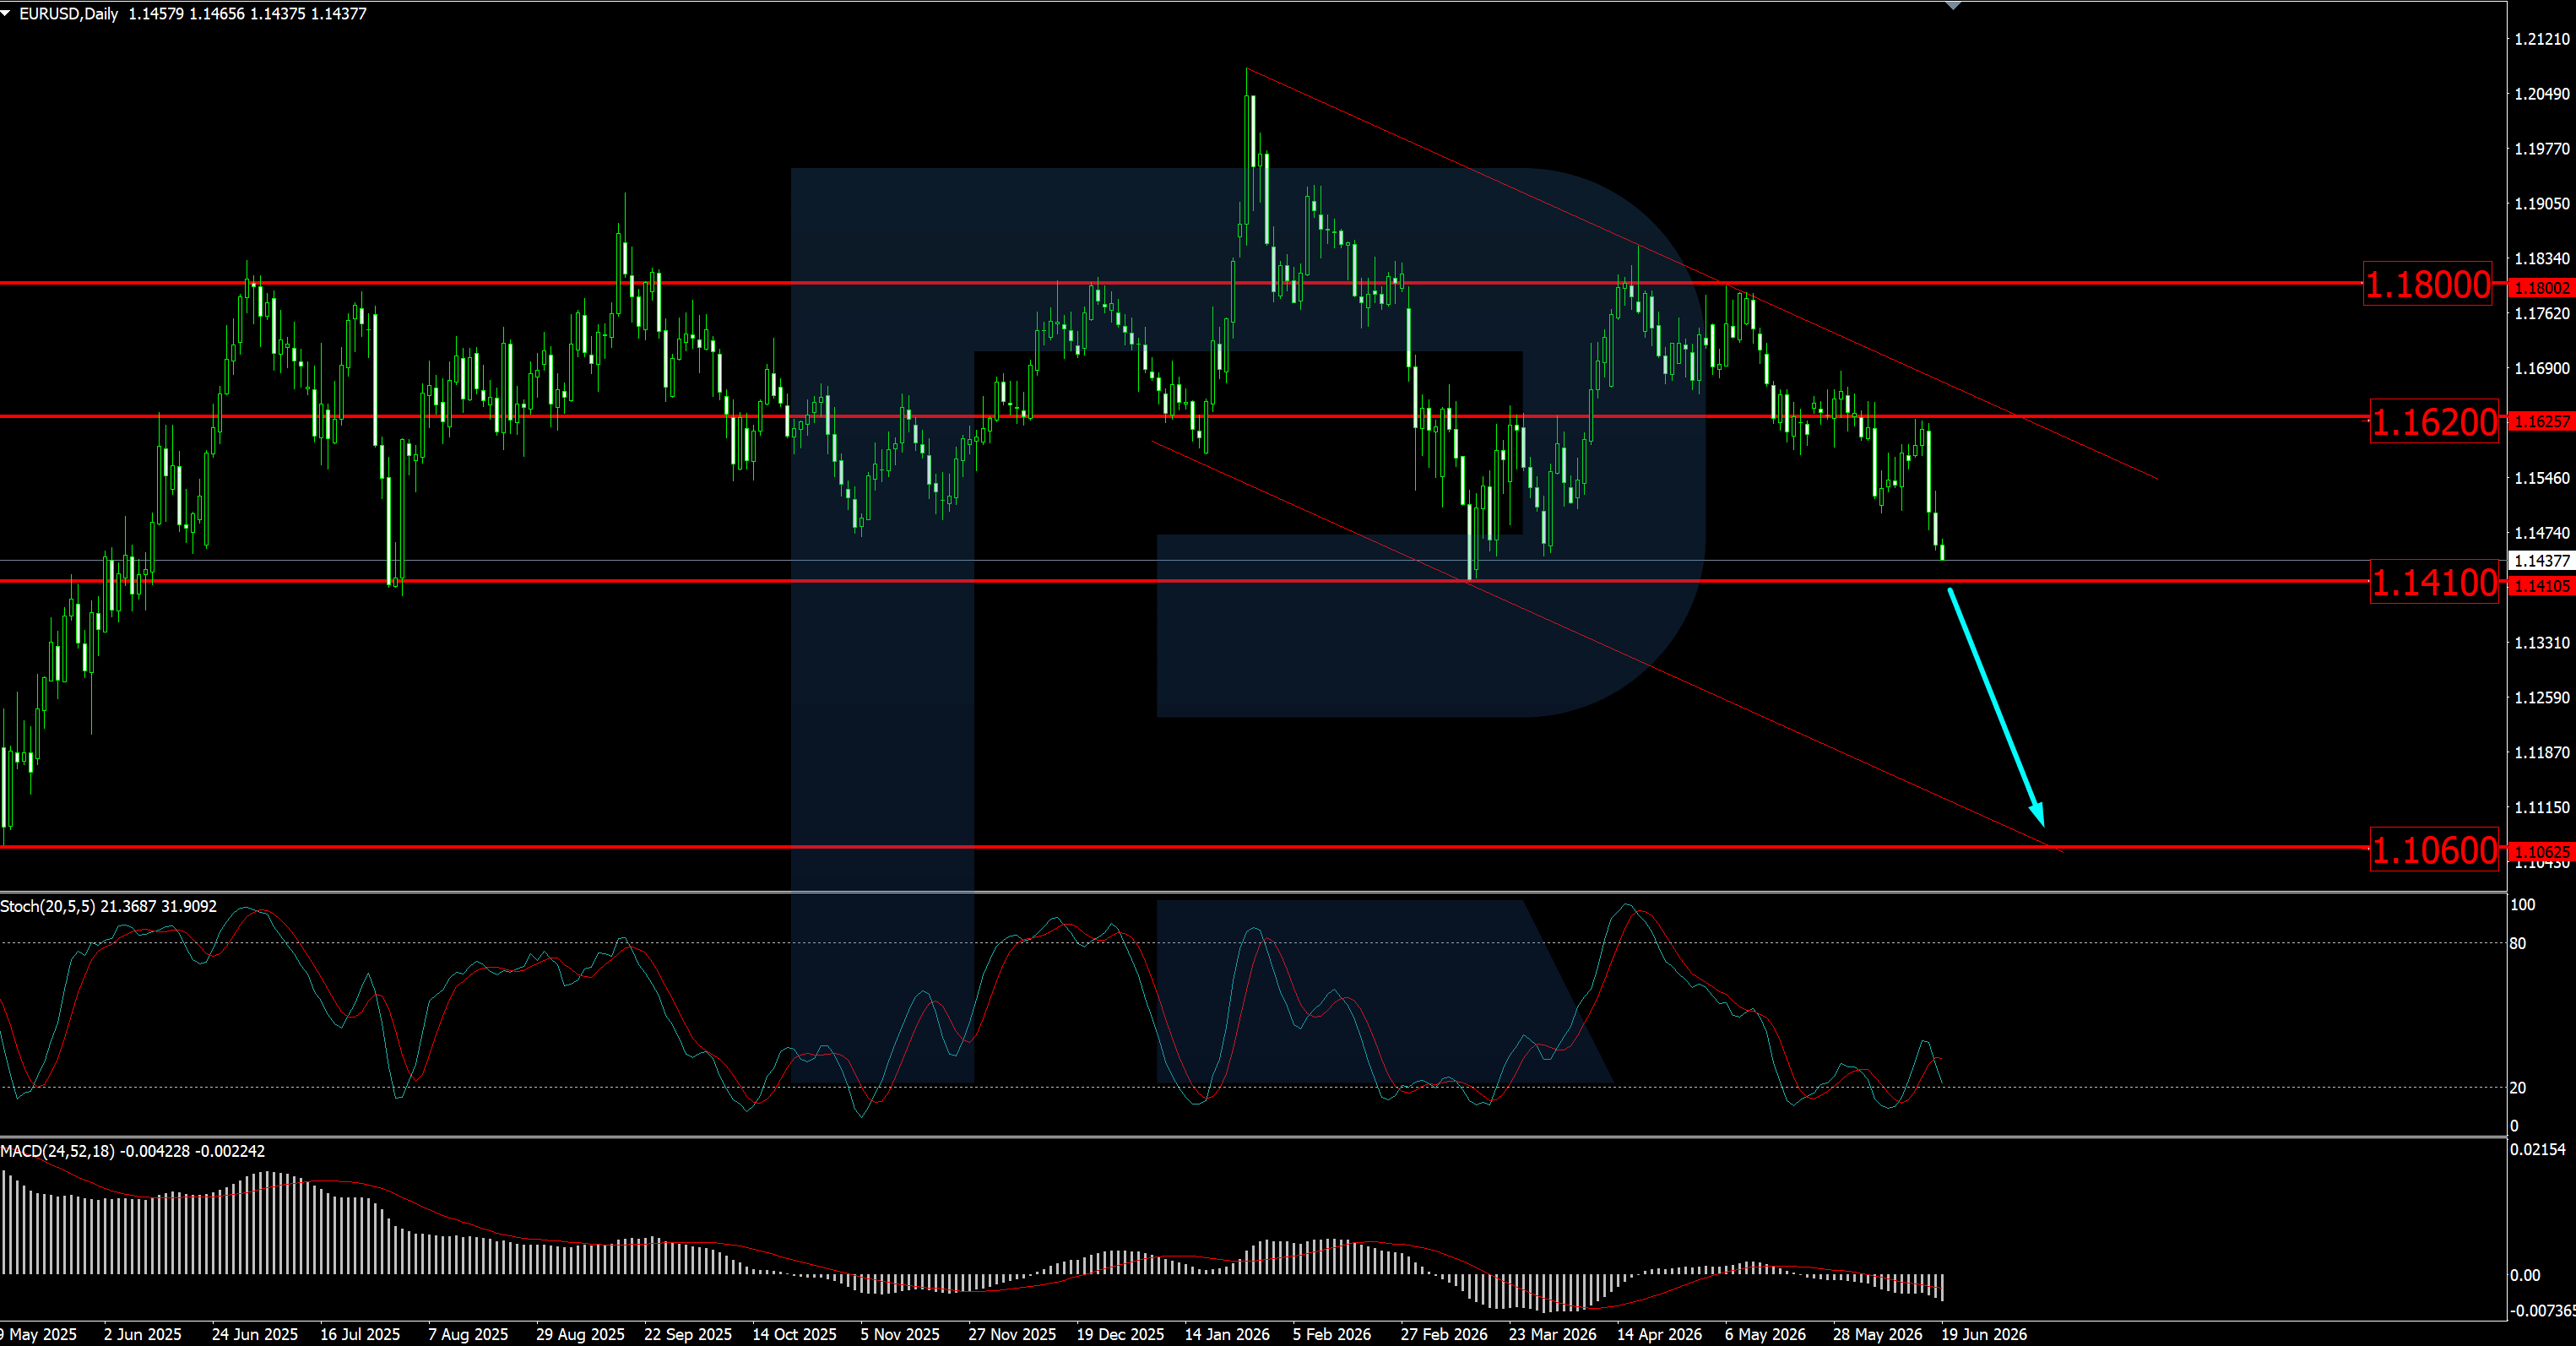
EURUSD remains under pressure and may decline towards 1.1060 Weak eurozone data and the Fed’s hawkish stance continue to weigh on EURUSD. The main scenario provides for a break of support at 1.1410 and a further decline in the pair towards 1.1060. Technical outlook On the daily timeframe, EURUSD quotes are trading in a descending channel and are approaching the key support at 1.1410. The MACD indicator is in negative territory, which is increasing pressure on the pair. Technical analysis of EURUSD points to the continuation of the downward trend and a possible further fall in the EURUSD rate. Read more - EURUSD Forecast Attention! Forecasts presented in this section only reflect the author’s private opinion and should not be considered as guidance for trading. RoboForex bears no responsibility for trading results based on trading recommendations described in these analytical reviews. Sincerely, The RoboForex Team
-
Market Technical Analysis by RoboForex
RBFX Support replied to RBFX Support's topic in Technical Analysis
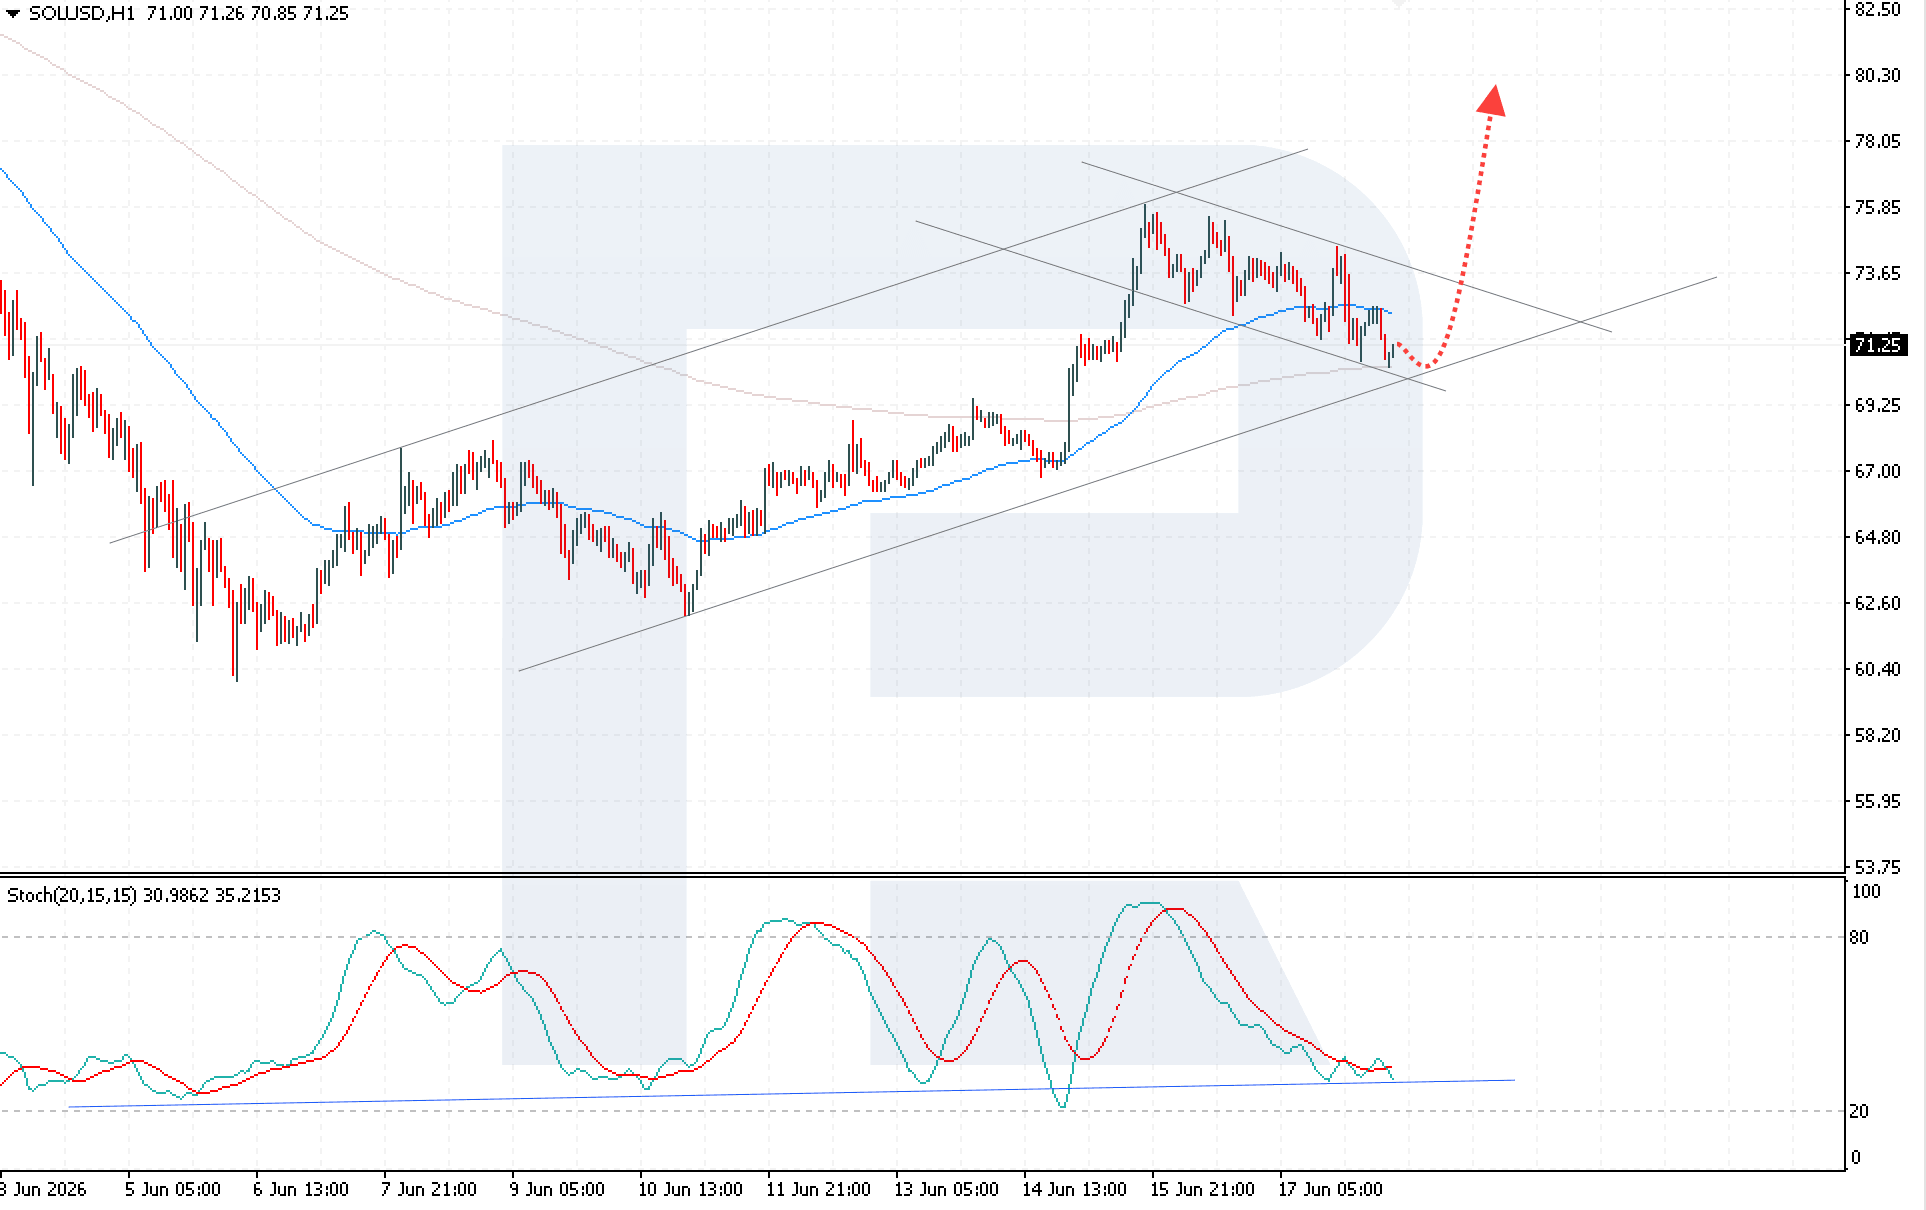
Solana remains under pressure for the third session in a row SOLUSD is continuing to decline today amid stronger pressure on risk assets and uncertainty over Fed policy. The current quote is 71.25. Technical outlook The price of Solana is continuing its corrective move and has approached the lower boundary of the bullish channel. Today’s forecast for Solana suggests a resumption of the upward impulse with a target at 80.30. Despite short-term pressure and continuing uncertainty in the markets. Read more - SOLUSD Forecast Attention! Forecasts presented in this section only reflect the author’s private opinion and should not be considered as guidance for trading. RoboForex bears no responsibility for trading results based on trading recommendations described in these analytical reviews. Sincerely, The RoboForex Team
-
roboforex Market Fundamental Analysis by RoboForex
RBFX Support replied to RBFX Support's topic in Fundamental Analysis
XAUUSD remains under pressure from the Fed: gold quotes may decline to 4,050 USD XAUUSD partially recovered after yesterday’s decline, but hawkish Fed rhetoric continues to weigh on gold. The main scenario предполагает a break of support at 4,235 USD and a decline in quotes to 4,050 USD. Gold forecast: key takeaways Hawkish Fed rhetoric is limiting XAUUSD’s recovery potential Gold is still trading in a downtrend A break of support at 4,235 USD may strengthen the bearish scenario and open the way for a decline in quotes Fundamental analysis Analysis of XAUUSD for 18 June 2026 shows that gold is recovering after yesterday’s decline against the backdrop of hawkish Fed rhetoric and is trading around 4,316 USD per ounce. Quotes received support from news of a temporary agreement between the US and Iran, which reduced tension around the Strait of Hormuz and led to a further decline in oil prices. But the main factor for XAUUSD remains the Fed decision. The regulator left the rate unchanged at 3.75%, but the updated forecasts showed that almost half of Fed members allow for a rate increase by the end of the year. RoboForex Market Analysis & Forex Forecasts Attention! Forecasts presented in this section only reflect the author’s private opinion and should not be considered as guidance for trading. RoboForex bears no responsibility for trading results based on trading recommendations described in these analytical reviews. Sincerely, The RoboForex Team -
roboforex Market Fundamental Analysis by RoboForex
RBFX Support replied to RBFX Support's topic in Fundamental Analysis
The dollar is waiting for support from the Fed: USDJPY is targeting 161.00 The USDJPY pair is trading near the key resistance level at 160.60 as the market awaits the Federal Reserve’s rate decision. Hawkish rhetoric from the regulator may support the dollar and pave the way for the pair to rise to 161.00. USDJPY forecast: key takeaways Today, all eyes are on the Federal Reserve’s monetary policy decision Hawkish Fed rhetoric may bolster the dollar, pushing the USDJPY pair higher to 161.00 The interest rate differential between the US and Japan continues to support carry trade operations Fundamental analysis Fundamental analysis for 17 June 2026 shows that the USDJPY rate remains near the psychologically important resistance level at 160.60, with the upcoming Federal Reserve meeting becoming the key event for the pair. The market expects the rate to remain at the current level, but the main focus will be on the Fed's comments rather than the decision itself. The Bank of Japan’s decision to raise the rate to 1.00% from the previous 0.75% failed to strengthen the yen noticeably. The reason is that the market had already priced in this move. RoboForex Market Analysis & Forex Forecasts Attention! Forecasts presented in this section only reflect the author’s private opinion and should not be considered as guidance for trading. RoboForex bears no responsibility for trading results based on trading recommendations described in these analytical reviews. Sincerely, The RoboForex Team -
Market Technical Analysis by RoboForex
RBFX Support replied to RBFX Support's topic in Technical Analysis
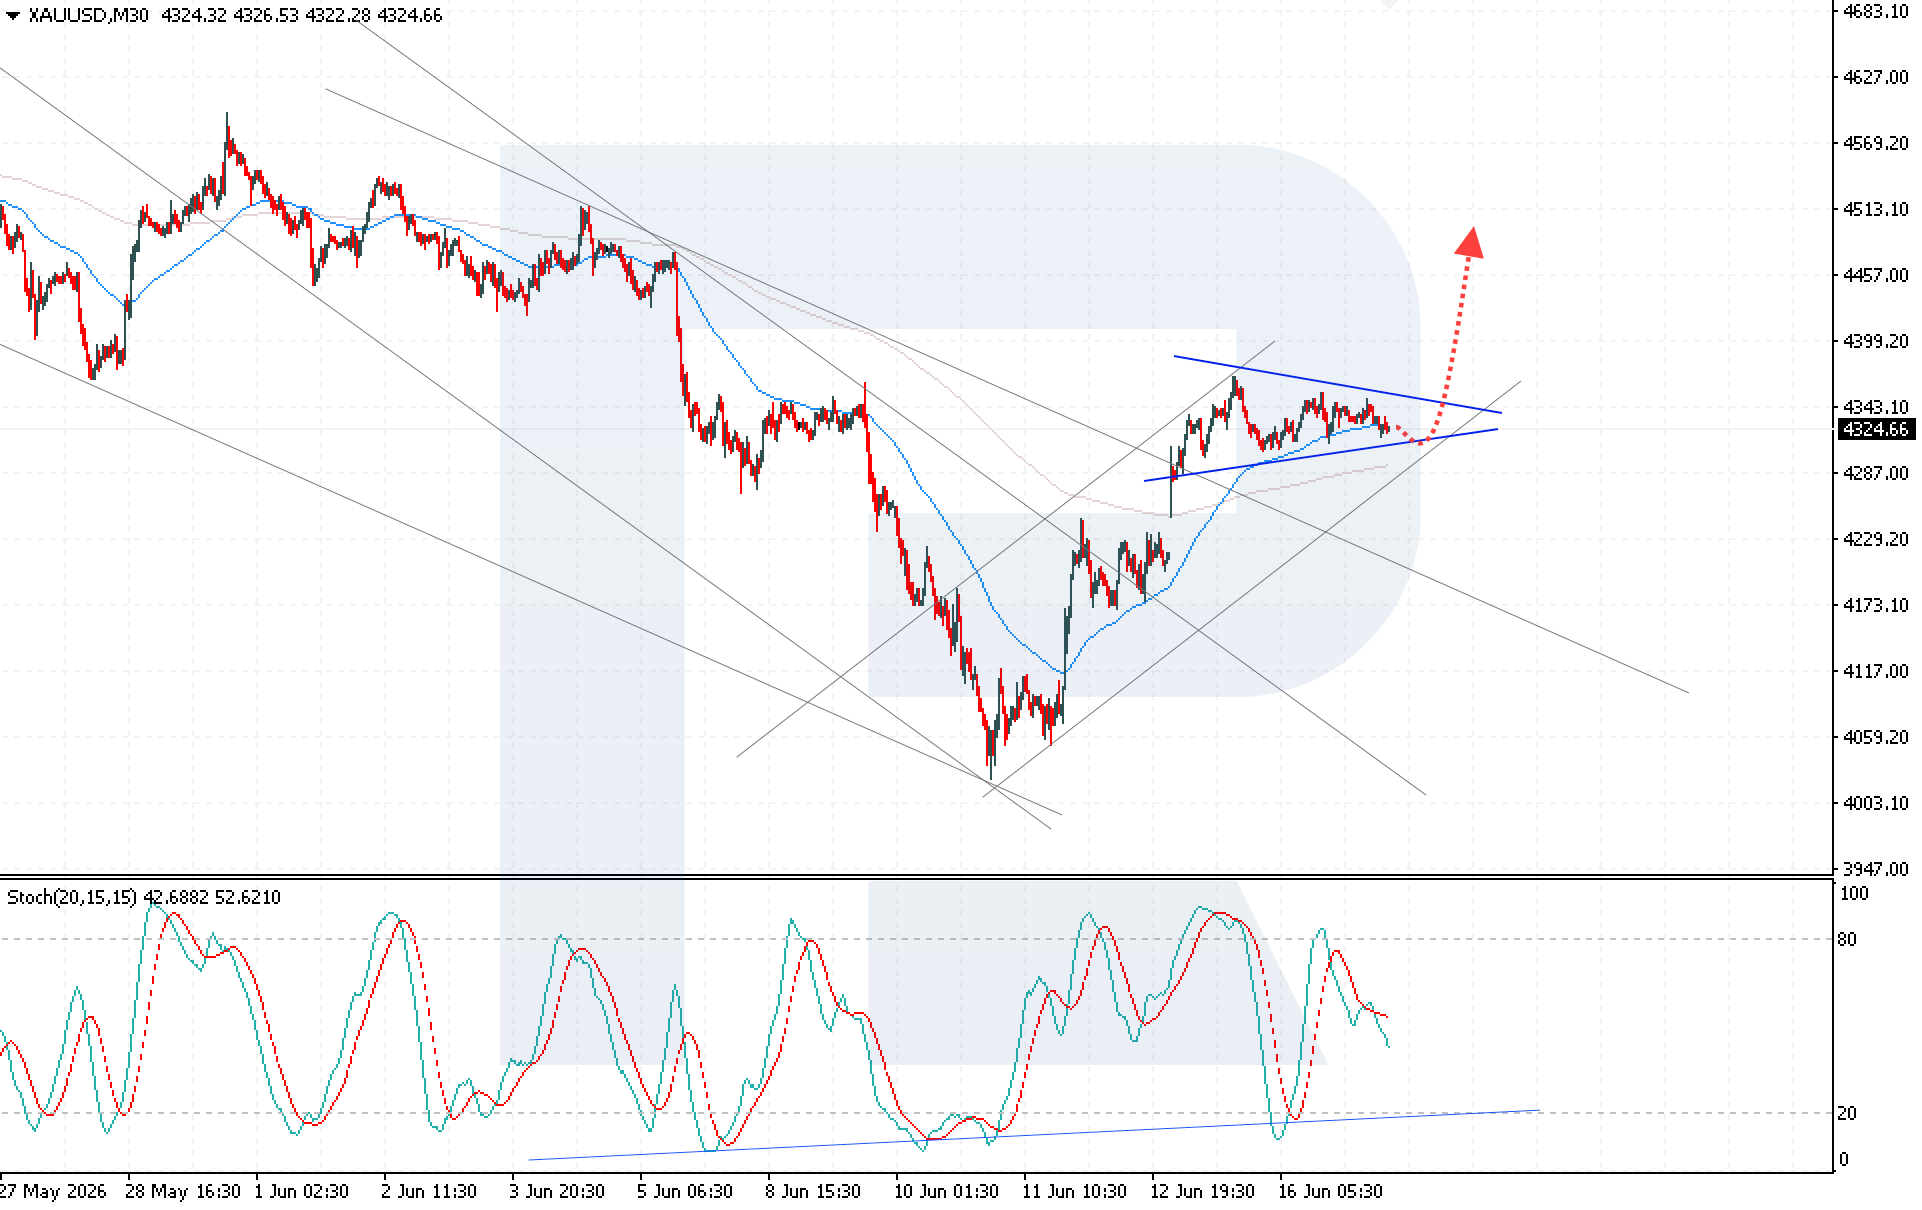
XAUUSD consolidates near the key resistance at 4,365 USD XAUUSD quotes remain under pressure after a series of strong gains as investors assess the outlook for Fed policy. Prices currently stand at 4,324 USD. Technical outlook XAUUSD quotes continue to move within a developing Triangle pattern. Despite the proximity of the key resistance level at 4,365 USD, selling pressure remains limited, while buyers are holding prices above the EMA-65. The XAUUSD forecast for today suggests continued upward potential with a target at 4,505 USD. Read more - Gold Forecast Attention! Forecasts presented in this section only reflect the author’s private opinion and should not be considered as guidance for trading. RoboForex bears no responsibility for trading results based on trading recommendations described in these analytical reviews. Sincerely, The RoboForex Team
-
roboforex Market Fundamental Analysis by RoboForex
RBFX Support replied to RBFX Support's topic in Fundamental Analysis
US 500 forecast: the index resumes growth The US 500 index resumed its upward momentum after the acute phase of the conflict between the US and Iran ended. The US 500 forecast for today is positive. US 500 forecast: key takeaways Recent data: the US CPI rose by 4.2% year-on-year in May Market impact: this data is moderately negative for the stock market Fundamental analysis US inflation data appears negative for the US 500 index, although the actual reading matched the forecast. The key point here is not that the figures matched expectations, but rather the acceleration in inflation from 3.8% to 4.2% year-on-year. This means that price pressure in the US economy is increasing, while the disinflation process may prove slower than market participants expected. For the US 500 index, such statistics typically create pressure. Higher inflation reduces the likelihood of near-term monetary policy easing by the Federal Reserve and may fuel expectations that interest rates will remain elevated for longer. RoboForex Market Analysis & Forex Forecasts Attention! Forecasts presented in this section only reflect the author’s private opinion and should not be considered as guidance for trading. RoboForex bears no responsibility for trading results based on trading recommendations described in these analytical reviews. Sincerely, The RoboForex Team -
Market Technical Analysis by RoboForex
RBFX Support replied to RBFX Support's topic in Technical Analysis
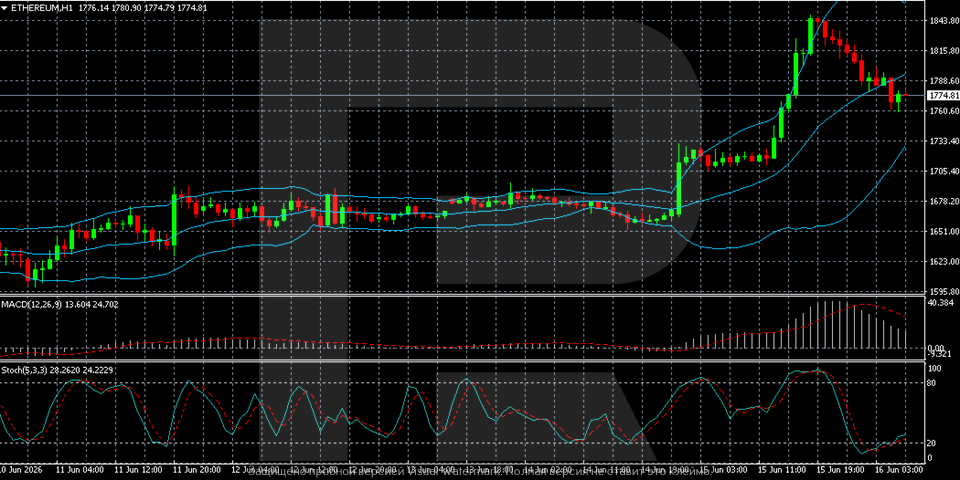
Ethereum (ETHUSD) needs a break: too much significant news Ethereum (ETHUSD) is holding at 1,774 USD, with the market watching BitMine and the ecosystem. Technical outlook On the H1 chart, Ethereum maintains a confident uptrend following a strong momentum on 15 June. Quotes rose sharply from the 1,660–1,680 area to a local high near 1,840, after which the market moved into a correction phase. Ethereum (ETHUSD) prices still have room to rise, provided certain conditions are met. Read more - ETHUSD Forecast Attention! Forecasts presented in this section only reflect the author’s private opinion and should not be considered as guidance for trading. RoboForex bears no responsibility for trading results based on trading recommendations described in these analytical reviews. Sincerely, The RoboForex Team
-
Market Technical Analysis by RoboForex
RBFX Support replied to RBFX Support's topic in Technical Analysis
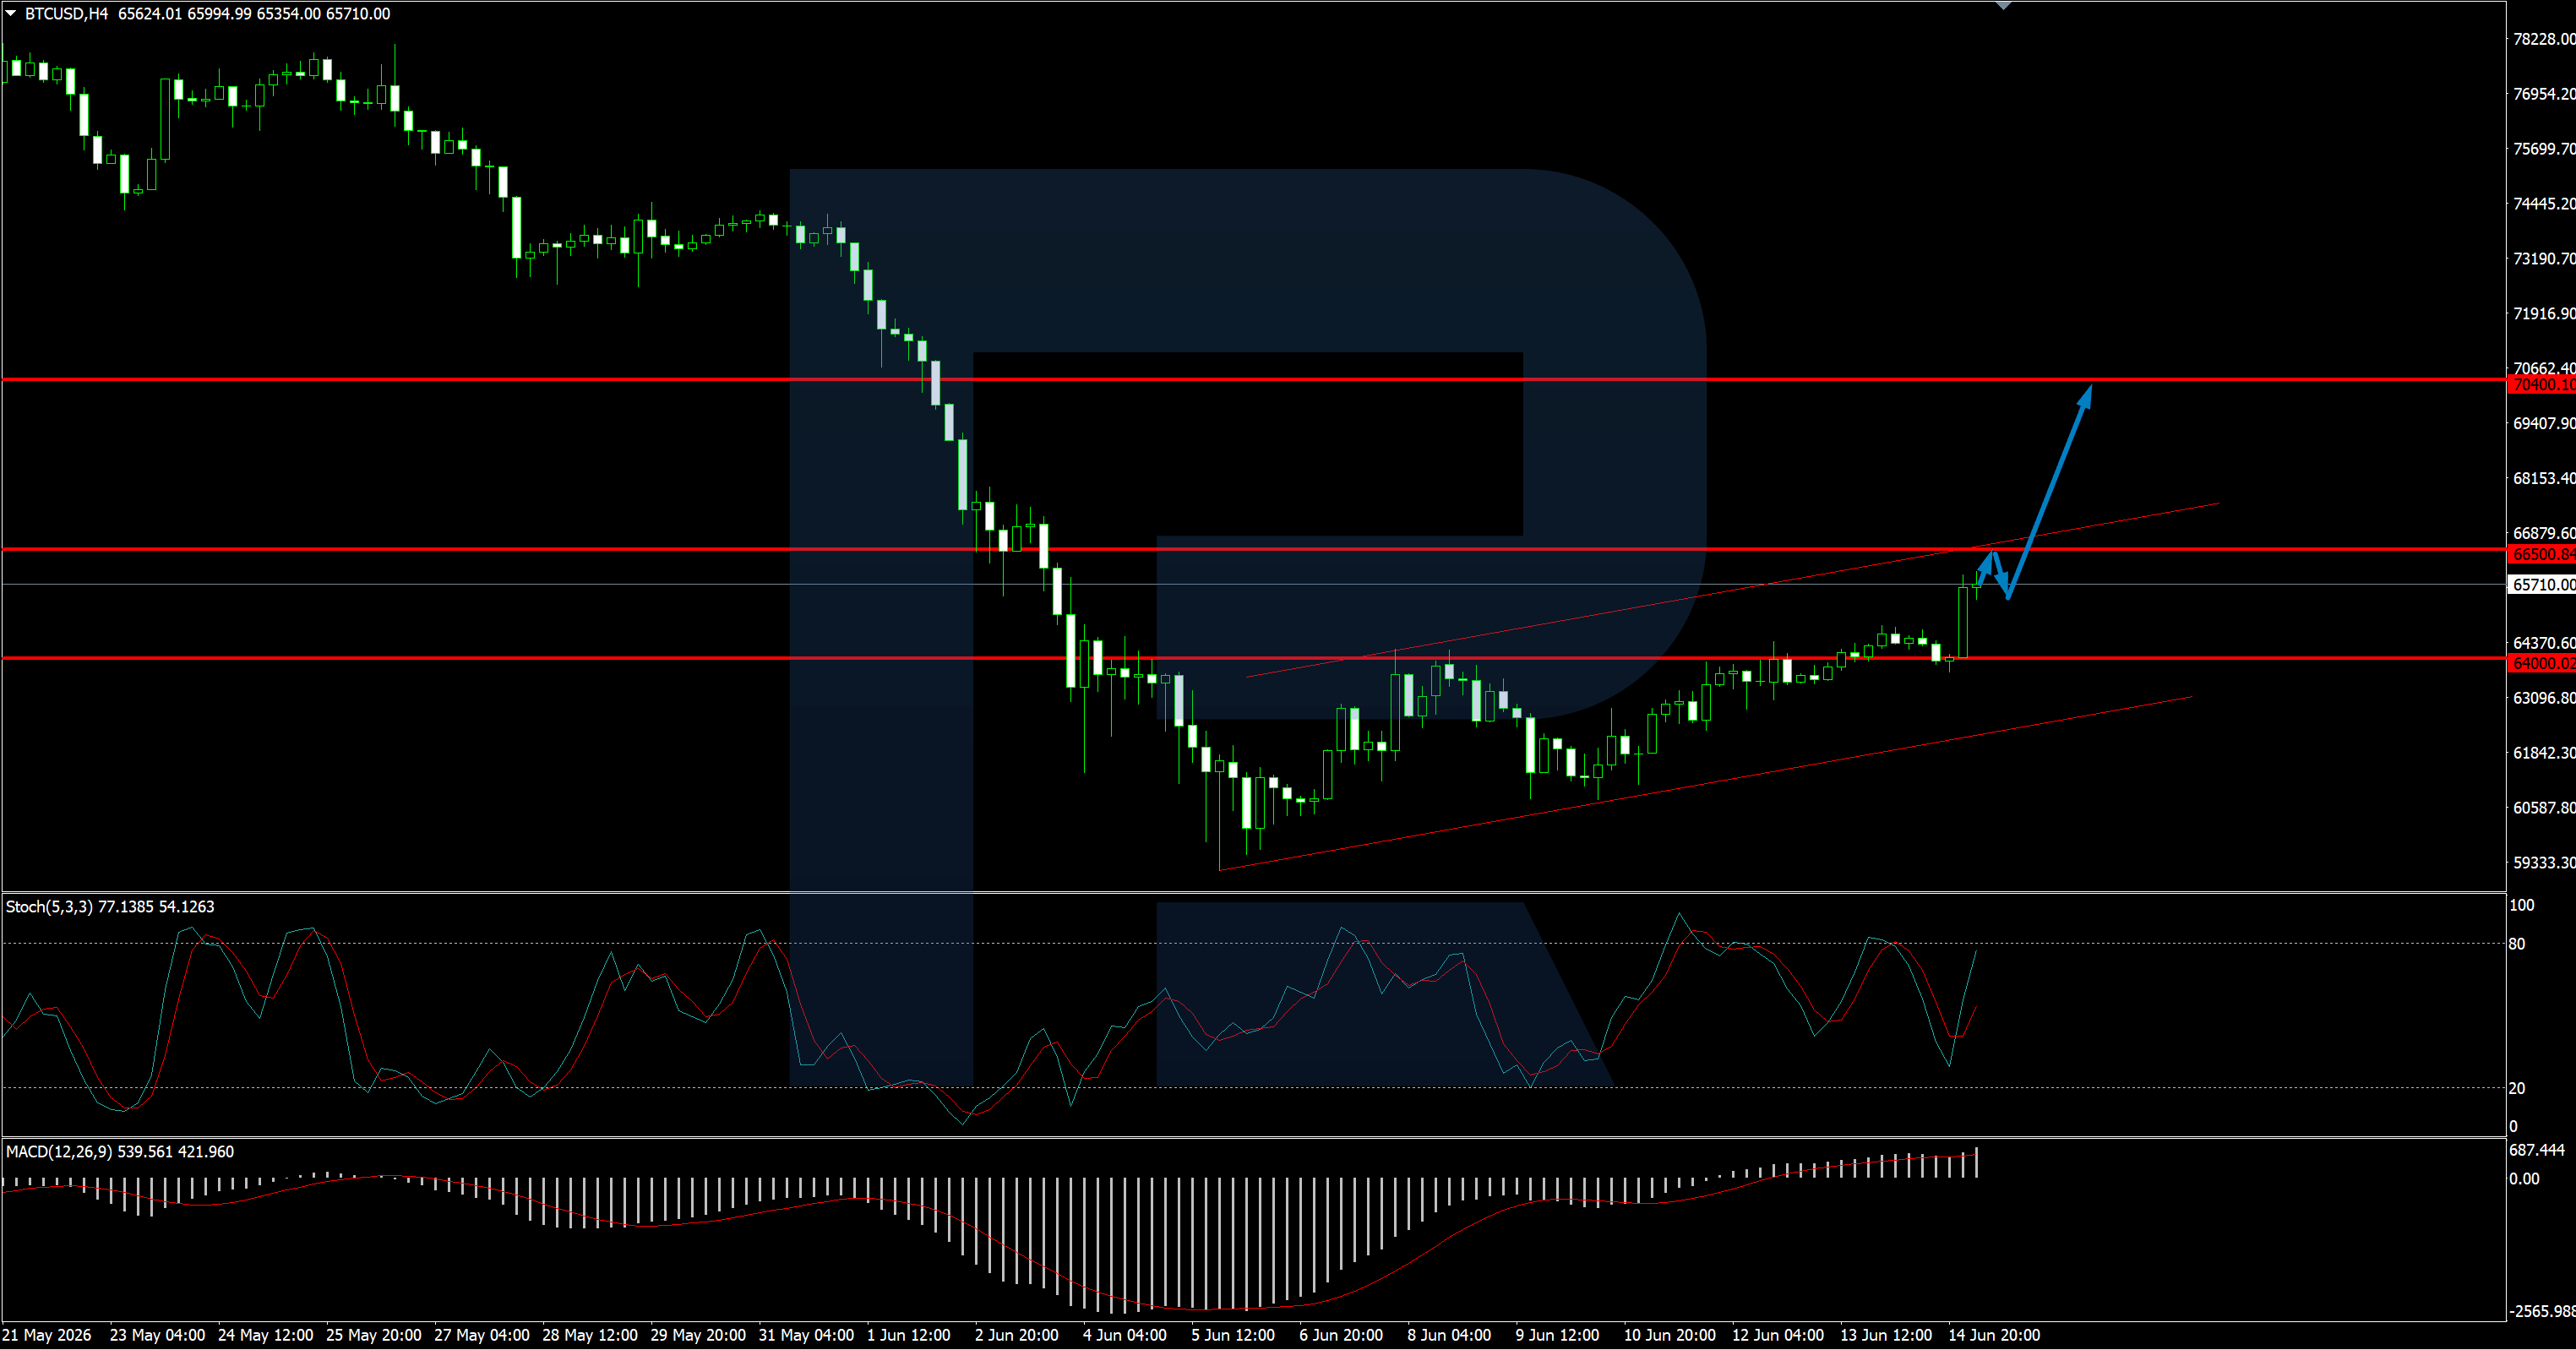
Bitcoin is recovering and preparing to test 66,500 USD Bitcoin gained support after positive news on the conflict between the US and Iran, but the rise remains fragile for now. A breakout above the 66,500 USD level will open the way to 70,400 USD. Technical outlook Last week, on the H4 chart, BTCUSD quotes attempted to break above the 64,000 USD resistance level several times, and it was only over the weekend that they were able to overcome this level, driven by positive news from the Middle East. The first important signal for BTCUSD will be a breakout above the 66,500 USD resistance level. Read more - BTCUSD Forecast Attention! Forecasts presented in this section only reflect the author’s private opinion and should not be considered as guidance for trading. RoboForex bears no responsibility for trading results based on trading recommendations described in these analytical reviews. Sincerely, The RoboForex Team
-
roboforex Market Fundamental Analysis by RoboForex
RBFX Support replied to RBFX Support's topic in Fundamental Analysis
DE 40 forecast: the index heads towards the upper boundary of the sideways channel The DE 40 stock index continues to trade within a sideways channel with an upward bias. The DE 40 forecast for today is negative. Brent forecast: key takeaways Recent data: Germany’s manufacturing PMI for May came in at 50.1 Market impact: Germany’s CPI for May declined by 0.2% Fundamental analysis The release of a –0.2% reading, compared to a forecast of –0.2%, could be perceived by the German market as moderately neutral, as the actual figure matched expectations. However, compared to the previous value of 0.6%, the dynamics appear noticeably weaker, suggesting cooling price pressures or slower economic activity, depending on the nature of the indicator. For the DE 40, the impact may be moderately positive in the short term if investors focus on the possibility of monetary policy easing. In this case, demand could increase for stocks of companies sensitive to borrowing costs and the investment cycle. RoboForex Market Analysis & Forex Forecasts Attention! Forecasts presented in this section only reflect the author’s private opinion and should not be considered as guidance for trading. RoboForex bears no responsibility for trading results based on trading recommendations described in these analytical reviews. Sincerely, The RoboForex Team -
roboforex Market Fundamental Analysis by RoboForex
RBFX Support replied to RBFX Support's topic in Fundamental Analysis
US Tech forecast: index hits a new all-time high The US Tech index reached a new all-time high – unusually, the trend is only gaining momentum. The US Tech forecast for next week is positive. US Tech forecast: key takeaways Recent data: US services PMI came in at 50.7 in May Market impact: the current data is negative for the technology sector Fundamental analysis The release of the US services PMI at 50.7, below the forecast of 50.9 and the previous reading of 50.9, indicates slightly weaker momentum than the market expected. The reading is still above 50.0, meaning the services sector continues to expand, but the pace of growth is slowing. Such data could have a dual impact on the US Tech index. On the one hand, a weaker PMI reduces confidence in the sustainability of economic growth, which could increase caution towards technology companies, particularly those whose valuations are already at high levels. RoboForex Market Analysis & Forex Forecasts Attention! Forecasts presented in this section only reflect the author’s private opinion and should not be considered as guidance for trading. RoboForex bears no responsibility for trading results based on trading recommendations described in these analytical reviews. Sincerely, The RoboForex Team -
Market Technical Analysis by RoboForex
RBFX Support replied to RBFX Support's topic in Technical Analysis
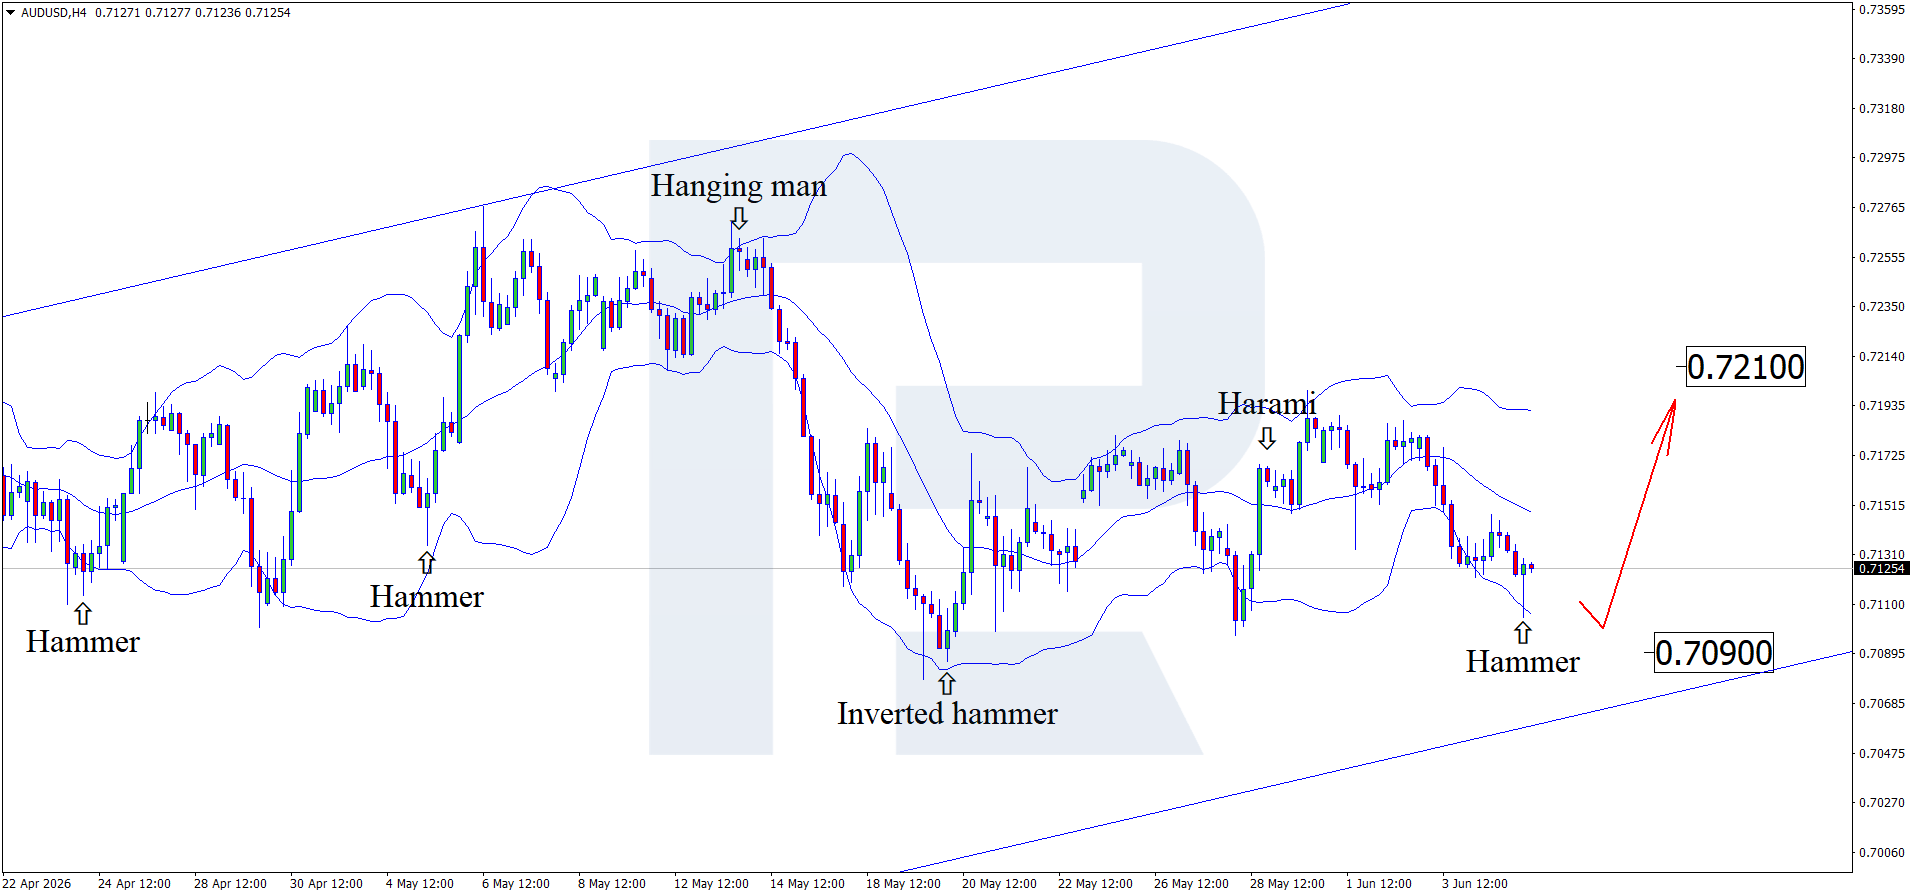
The market is underestimating the threat: AUDUSD may surprise today After a week of decline, the AUDUSD pair may spring a surprise amid the Nonfarm Payrolls release. Quotes are testing the 0.7120 level. Technical outlook The AUDUSD pair formed a Hammer reversal pattern near the lower Bollinger Band on the H4 chart. At this stage, quotes remain within an ascending channel and may continue their upward wave as the pattern signal plays out. The Australian dollar has not given up hope of strengthening; weak Australian statistics may be offset by weak US statistics. Read more - AUDUSD Forecast Attention! Forecasts presented in this section only reflect the author’s private opinion and should not be considered as guidance for trading. RoboForex bears no responsibility for trading results based on trading recommendations described in these analytical reviews. Sincerely, The RoboForex Team
-
Market Technical Analysis by RoboForex
RBFX Support replied to RBFX Support's topic in Technical Analysis
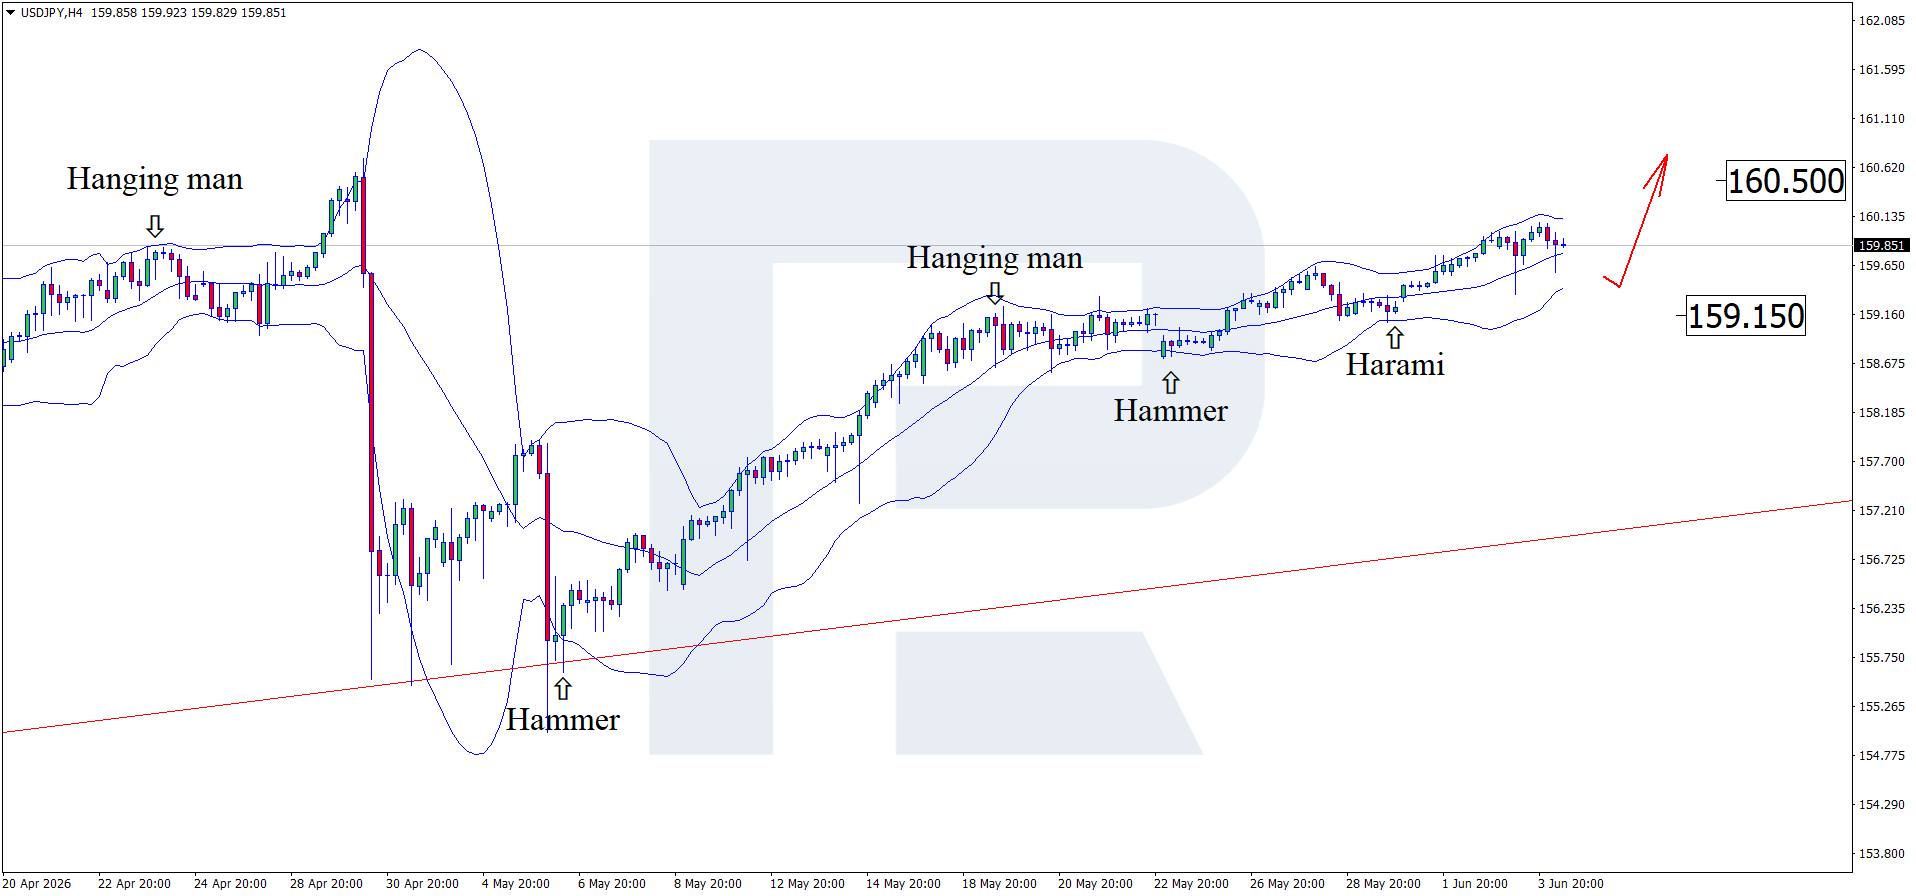
USDJPY trapped in a vice, the Japanese government is keeping a low profile After testing the psychological 160.00 level, the USDJPY pair failed to consolidate above it and pulled back. The rate currently stands at 159.85. Technical outlook On the H4 chart, the USDJPY pair formed a Harami reversal pattern near the lower Bollinger Band and is trading around 159.85. Since the price remains within an ascending channel, it could form an upward wave following the pattern signal, with the upside target remaining at 160.50. The USDJPY pair attempted to break above the psychological 160.00 level and consolidate above it, but buyers lacked the strength to do so. Read more - USDJPY Forecast Attention! Forecasts presented in this section only reflect the author’s private opinion and should not be considered as guidance for trading. RoboForex bears no responsibility for trading results based on trading recommendations described in these analytical reviews. Sincerely, The RoboForex Team
-
roboforex Market Fundamental Analysis by RoboForex
RBFX Support replied to RBFX Support's topic in Fundamental Analysis
Brent may spring an unpleasant surprise The situation in the Middle East is triggering Brent prices. After rising, quotes are forming a corrective wave and are currently hovering around 96.30 USD. Brent forecast: key takeaways US crude oil inventories fell by 8 million barrels last week Inventories at the largest terminal in Cushing declined to minimum operating levels Brent forecast for 4 June 2026: 100.50 Fundamental analysis The Brent forecast for 4 June 2026 shows that, after rising, oil prices are forming a corrective wave, primarily driven by geopolitical de-escalation, which has eased supply concerns. At this stage, Brent quotes are testing the 96.30 USD per barrel mark. A ceasefire agreement between Israel and Lebanon was announced a day earlier. This breakthrough, mediated by the US, is viewed by the market as an important step towards de-escalating the conflict in the Middle East. RoboForex Market Analysis & Forex Forecasts Attention! Forecasts presented in this section only reflect the author’s private opinion and should not be considered as guidance for trading. RoboForex bears no responsibility for trading results based on trading recommendations described in these analytical reviews. Sincerely, The RoboForex Team -
roboforex Market Fundamental Analysis by RoboForex
RBFX Support replied to RBFX Support's topic in Fundamental Analysis
US 30 index forecast: growth momentum has weakened, but the uptrend remains The US 30 index is trading near its all-time high, but the likelihood of a downward correction is increasing. The US 30 forecast for today is positive. US 30 forecast: key takeaways Recent data: US GDP rose by 1.6% year-over-year in Q1 2026 Market impact: the data is negative for the stock market Fundamental analysis US quarterly GDP data came in below expectations, showing actual growth of 1.6%, below the forecast of 2.0% but up from the previous 0.5%. For the US 30 index, this is a mixed signal, but in the short term, it is more likely to have a moderately negative effect. For the US 30 index, which includes major US industrial, financial, consumer, and technology companies, softer GDP could reduce appetite for more cyclical stocks. RoboForex Market Analysis & Forex Forecasts Attention! Forecasts presented in this section only reflect the author’s private opinion and should not be considered as guidance for trading. RoboForex bears no responsibility for trading results based on trading recommendations described in these analytical reviews. Sincerely, The RoboForex Team -
Market Technical Analysis by RoboForex
RBFX Support replied to RBFX Support's topic in Technical Analysis
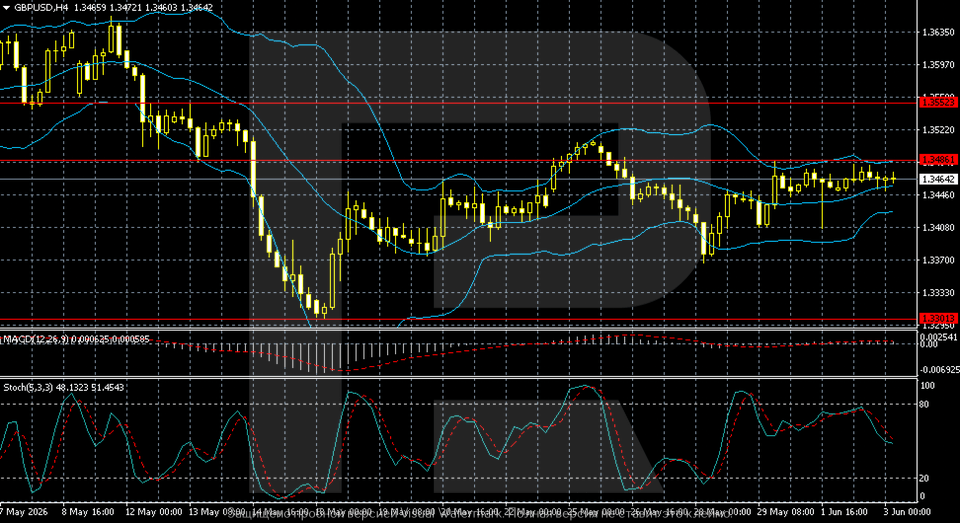
GBPUSD on hold: caught between oil rally and high interest rates The GBPUSD pair is standing in a narrow sideways range near 1.3464. The market needs strong news. Technical outlook The GBPUSD pair remains in a consolidation phase on the H4 chart after the sharp decline from May highs in the 1.3630–1.3650 area. After forming a local low near 1.3300, buyers recouped some losses, but a sustainable upward momentum has yet to emerge. The GBPUSD pair remains without a strong catalyst, but holds below crucial levels. Read more - GBPUSD Forecast Attention! Forecasts presented in this section only reflect the author’s private opinion and should not be considered as guidance for trading. RoboForex bears no responsibility for trading results based on trading recommendations described in these analytical reviews. Sincerely, The RoboForex Team
-
roboforex Market Fundamental Analysis by RoboForex
RBFX Support replied to RBFX Support's topic in Fundamental Analysis
US 500 forecast: the index hits a new all-time high News about a possible end to the conflict between the US and Iran pushed the US 500 index higher. The US 500 forecast for today is positive. US 500 forecast: key takeaways Recent data: US preliminary manufacturing PMI came in at 55.3 in May Market impact: this data is moderately positive for the US stock market Fundamental analysis The release of quarterly US GDP data, showing actual growth of 1.6% versus the forecast of 2.0%, could be perceived by the market as a moderately negative signal for the US 500 index. The main reason is that the US economy is growing more slowly than expected, which reduces investor confidence in the sustainability of corporate earnings. For the US 500 index, the effect could be mixed. On the one hand, weaker-than-expected GDP growth indicates an economic slowdown, which typically pressures shares of companies sensitive to the business cycle. RoboForex Market Analysis & Forex Forecasts Attention! Forecasts presented in this section only reflect the author’s private opinion and should not be considered as guidance for trading. RoboForex bears no responsibility for trading results based on trading recommendations described in these analytical reviews. Sincerely, The RoboForex Team -
Market Technical Analysis by RoboForex
RBFX Support replied to RBFX Support's topic in Technical Analysis
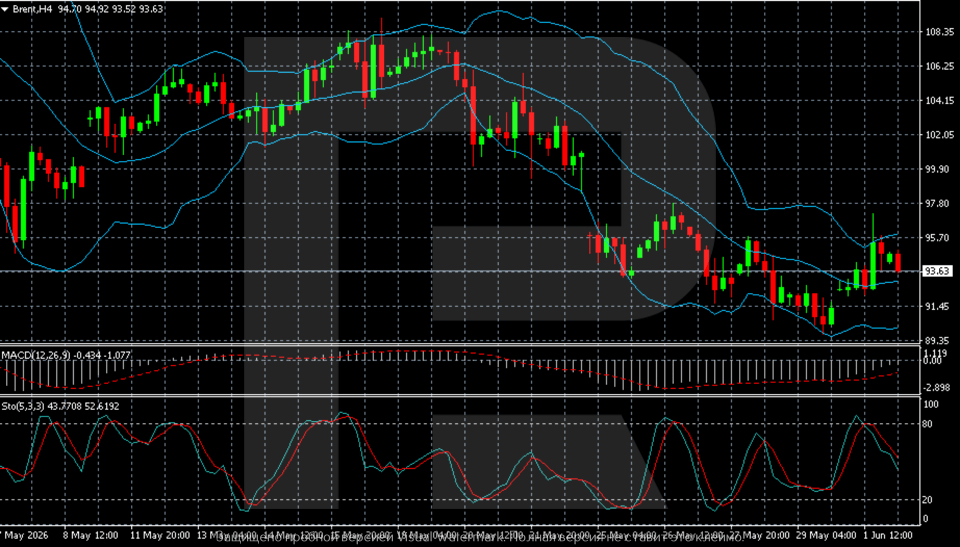
Brent is waiting for news: what will happen to Hormuz? Brent prices settled at 93.83 USD. Middle East talks are constantly stalled. Find more details in our analysis for 2 June 2026. Technical outlook On the H4 chart, Brent remains under pressure after a strong decline from May highs in the 108–109 per barrel area. After a series of sell-offs, quotes moved down into the 91–94 area, where the market is attempting to form a base for stabilisation. Brent rose and then paused, with market indicators appearing mixed. Read more - Brent Forecast Attention! Forecasts presented in this section only reflect the author’s private opinion and should not be considered as guidance for trading. RoboForex bears no responsibility for trading results based on trading recommendations described in these analytical reviews. Sincerely, The RoboForex Team