All Activity
- Past hour
-
@roddizon1978 Wow !!! Excellent information. You have put great effort to evaluate this methodology and I have provided great input. I was hoping someone with more experience would consider this as a valid method for discretionary trading. Now I need to digest and apply it to Sim/Market replay to get comfortable with it. Thank you for your input !👏
-
 ⭐ rcarlos1947 reacted to a post in a topic:
markttechniktrading.de
⭐ rcarlos1947 reacted to a post in a topic:
markttechniktrading.de
-
Welcome to Indo-Investasi.com. Please feel free to browse around and get to know the others. If you have any questions please don't hesitate to ask.
- Today
-
I have observed this last night and today. As I said before, it looks like a Fib count of an Elliot wave, but he only uses 3 count and reject the rest, and I saw this numbering before, in my Elliot wave Ninjacator Indicator. I bet you that is where he copied it, in the Ninjacator Elliot wave strategy, without all the projected and violated area excluded, he just put the numbers to show that area. I bet that if you installed the Ninjacator Elliot wave indicator, they would match. Now, those bars I think is based on the Fib count, the first bar is the retracement bar, seem like and he color it, the 2nd bar I think is the projection bar , and display only when the first bar is fully satisfied and there is a big chance that the projection bar could happen (2 to 3) the color I believe is base also on their accomplishment first bar, and 2nd bar. The strategy, I think here is trade on the projection, where it is going. Where to trade, as I tried with a simulation account, when the 2 bars are almost the same in color it mean the direction is right and have highest chance it will happened; where to stop, when the 2 bars have a slight or big difference in color, mean more opposition or opposite of your projection or guest. And I made profit trading it that way.
-
ninja on the roof is right, this is staight gambling, you know its better to invest in igaming software or to play in digital casino, trading is about cold minded decisions
-
Anyone happens to know a good news indictor on thinkorswim?
-
@kapitansb I doing well just to do English.😁 I have run the YT vids thru translation, but still scrambles my brain. There are online services that translate audio (voice) in videos to any language, sadly, I don't have the access.
-
 mastercard joined the community
 -
So ,now you need to find somewhere good German course and sorted out . 😄 But seriously - when you go into video settings on YT you can choose automatic translation in multiple languages (subtitles). All the best !
-
Pls reupload link is not working
-
justjames reacted to a post in a topic:
TDU Footprint & Footprint Trader 2.0.0.12 beta 3
-
 ⭐ RichardGere reacted to a post in a topic:
markttechniktrading.de
⭐ RichardGere reacted to a post in a topic:
markttechniktrading.de
-
⭐ rcarlos1947 reacted to a post in a topic:
markttechniktrading.de
-
@roddizon1978 Thank you for your comments. Yes I agree the color bars appear FIB related. The website document (pdf) explains various things on the chart, and I have read it while watching the chart to try and understand it better. Still, I'm sure the videos add extra insights into how to use t to better advantage. And yes, I have added the English subscript files to the videos, but difficult to read and follow while He makes observations. I am always open to comments that help me learn.
-

[REQ] Market Stalkers Level 1,2,3 - Deeyana Angelo
samar replied to Robin's topic in Forex Clips & Movie Request
Here's the Mega Link with separate sections https://[email protected]/folder/VeczQb6J#MnxvWLSCt7wQ7-wWTramFQ/folder/oC12wK7L -
Is it any better than Trade Devils TMA?
-

[REQ] Market Stalkers Level 1,2,3 - Deeyana Angelo
⭐ FFRT replied to Robin's topic in Forex Clips & Movie Request
ANY PDF contents ? vid file size is huge, - unwilling to download -

HFMarkets (hfm.com): Market analysis services.
AllForexnews replied to AllForexnews's topic in Fundamental Analysis
[b]Date: 4th July 2025.[/b] [b]European Markets Slip Ahead of Tariff Deadline, Wall Street Surges on Jobs Report and Fiscal Optimism.[/b] European Equities Slide on Trade Uncertainty European stock markets edged lower on Friday as investors grew increasingly cautious ahead of a looming US trade policy deadline. With the July 9 expiration of President Trump's 90-day pause on increased tariffs approaching, concerns over unresolved trade agreements weighed heavily on sentiment. The pan-European STOXX 600 index declined by 0.4% to 541.61 points in early trading, setting course for a weekly loss. Major regional benchmarks across the continent also moved into negative territory, driven by uncertainty over US-EU trade negotiations. US Markets Rally on Robust Jobs Data and Legislative Progress President Trump announced that Washington would begin sending formal tariff notifications to trading partners on Friday. These letters will detail the new duties—expected to range between 20% and 30%—on goods exported to the United States. Several key allies, including the European Union and Japan, have yet to secure final trade deals with the US, raising fears of a renewed trade war. Sector-wise, mining stocks led the losses with a 1.1% drop, followed by a 0.8% slide in technology shares. Meanwhile, France’s Alstom gained 1.1% after landing a €2 billion ($2.4 billion) contract from New York’s Metropolitan Transportation Authority. US equity markets surged as traders reacted positively to a stronger-than-expected June employment report and growing optimism over fiscal stimulus. The markets closed early on Wednesday ahead of the July 4 holiday, but not before notching record highs. NASDAQ rose 1.02% to 20,601 S&P 500 climbed 0.83% to 6,279 Dow Jones Industrial Average gained 0.77% to 44,828, near its January peak of 44,882 Investor confidence was further boosted by the passage of the One Big Beautiful Bill (OBBB) in the US House of Representatives. Approved by a narrow 218–214 vote, the sweeping pro-growth legislation is expected to be signed into law by President Trump on July 4, his self-imposed deadline. The OBBB aims to generate $500 billion in savings over the next decade, defying the Congressional Budget Office’s projection of a $3.3 trillion deficit increase. Key provisions include: Raising the debt ceiling by $5 trillion Expanding standard deductions and child tax credit Reducing taxes on tips, overtime, Social Security, and auto loans Increasing the SALT deduction cap to $40,000 Blocking a planned $4.5 billion tax hike set for year-end As equities climbed, volatility dropped, with the VIX falling 1.56% to 16.38. However, US Treasury yields spiked amid strong data and diminished expectations for Federal Reserve rate cuts. The 2-year yield rose 9.5 basis points to 3.88%, while the 10-year yield climbed 7 basis points to 4.35%. DXY (US Dollar Index) surged to 97.422 before paring gains to close at 97.168, supported by US Treasury Secretary Bessent’s commitment to maintaining a strong-dollar policy. Oil Prices Ease on Diplomatic Hopes and OPEC+ Output Plans Crude oil prices retreated slightly on Friday, driven by easing geopolitical tensions and expectations of increased supply from OPEC+. Brent crude dipped 0.51% to $68.45 per barrel WTI crude dropped 0.37% to $66.75 per barrel Oil markets responded to reports that the US and Iran may resume nuclear talks next week, as disclosed by both Iranian officials and US media outlet Axios. Iranian Foreign Minister Abbas Araqchi reaffirmed Tehran’s commitment to the Non-Proliferation Treaty, despite recent tensions and legislation suspending cooperation with the International Atomic Energy Agency. Looking ahead, traders are closely watching the upcoming OPEC+ meeting, where an additional production increase of 411,000 barrels per day (bpd) for August is expected. Four delegates confirmed the proposed hike as the oil alliance continues efforts to reclaim market share. Additional Developments: Sanctions and Diplomacy Adding complexity to the geopolitical picture, the US Treasury imposed fresh sanctions on a network accused of smuggling Iranian oil disguised as Iraqi shipments. Another target included a Hezbollah-linked financial entity. At the same time, Saudi Arabia’s Defense Minister Prince Khalid bin Salman met with President Trump at the White House to discuss regional de-escalation strategies. Meanwhile, Barclays revised its oil price forecast upward, citing stronger demand outlooks. The bank now sees Brent crude averaging $72 per barrel in 2025, and $70 per barrel in 2026. Conclusion: Markets Brace for Trade Decision, but Optimism Lingers Global markets are at a crossroads, with investors balancing optimism over US economic momentum and fiscal policy against the potential fallout of escalating trade tensions. As the July 9 tariff deadline nears and nuclear talks with Iran possibly resume, both equity and energy markets may experience renewed volatility. [b]Always trade with strict risk management. Your capital is the single most important aspect of your trading business.[/b] [b]Please note that times displayed based on local time zone and are from time of writing this report.[/b] Click [url=https://www.hfm.com/hf/en/trading-tools/economic-calendar.html][b]HERE[/b][/url] to access the full HFM Economic calendar. Want to learn to trade and analyse the markets? Join our webinars and get analysis and trading ideas combined with better understanding of how markets work. Click [url=https://www.hfm.com/en/trading-tools/trading-webinars.html][b]HERE[/b][/url] to register for FREE! [url=https://analysis.hfm.com/][b]Click HERE to READ more Market news.[/b][/url] [b]Andria Pichidi HFMarkets[/b] [b]Disclaimer:[/b] This material is provided as a general marketing communication for information purposes only and does not constitute an independent investment research. Nothing in this communication contains, or should be considered as containing, an investment advice or an investment recommendation or a solicitation for the purpose of buying or selling of any financial instrument. All information provided is gathered from reputable sources and any information containing an indication of past performance is not a guarantee or reliable indicator of future performance. Users acknowledge that any investment in Leveraged Products is characterized by a certain degree of uncertainty and that any investment of this nature involves a high level of risk for which the users are solely responsible and liable. We assume no liability for any loss arising from any investment made based on the information provided in this communication. This communication must not be reproduced or further distributed without our prior written permission. -
⭐ MOF NET reacted to a post in a topic:
MZPack 3.18.23 for NT8
-
Does anyone have the mzpack foot print?
-
 Gkrish26 joined the community
 -
Any news on latest demo tournament? When will results come out?
-
I’m new to contests but ran two last year with demo accounts—best part is stress‑testing strategies without risking real equity. Anyone else use contests to refine their risk control and discipline first?
-

MTPredictor Addons for NinjaTrader 8 v8.0.13.2 Crack
knagendratl replied to dave365's topic in Trading Platforms
Can re upload this files pls -
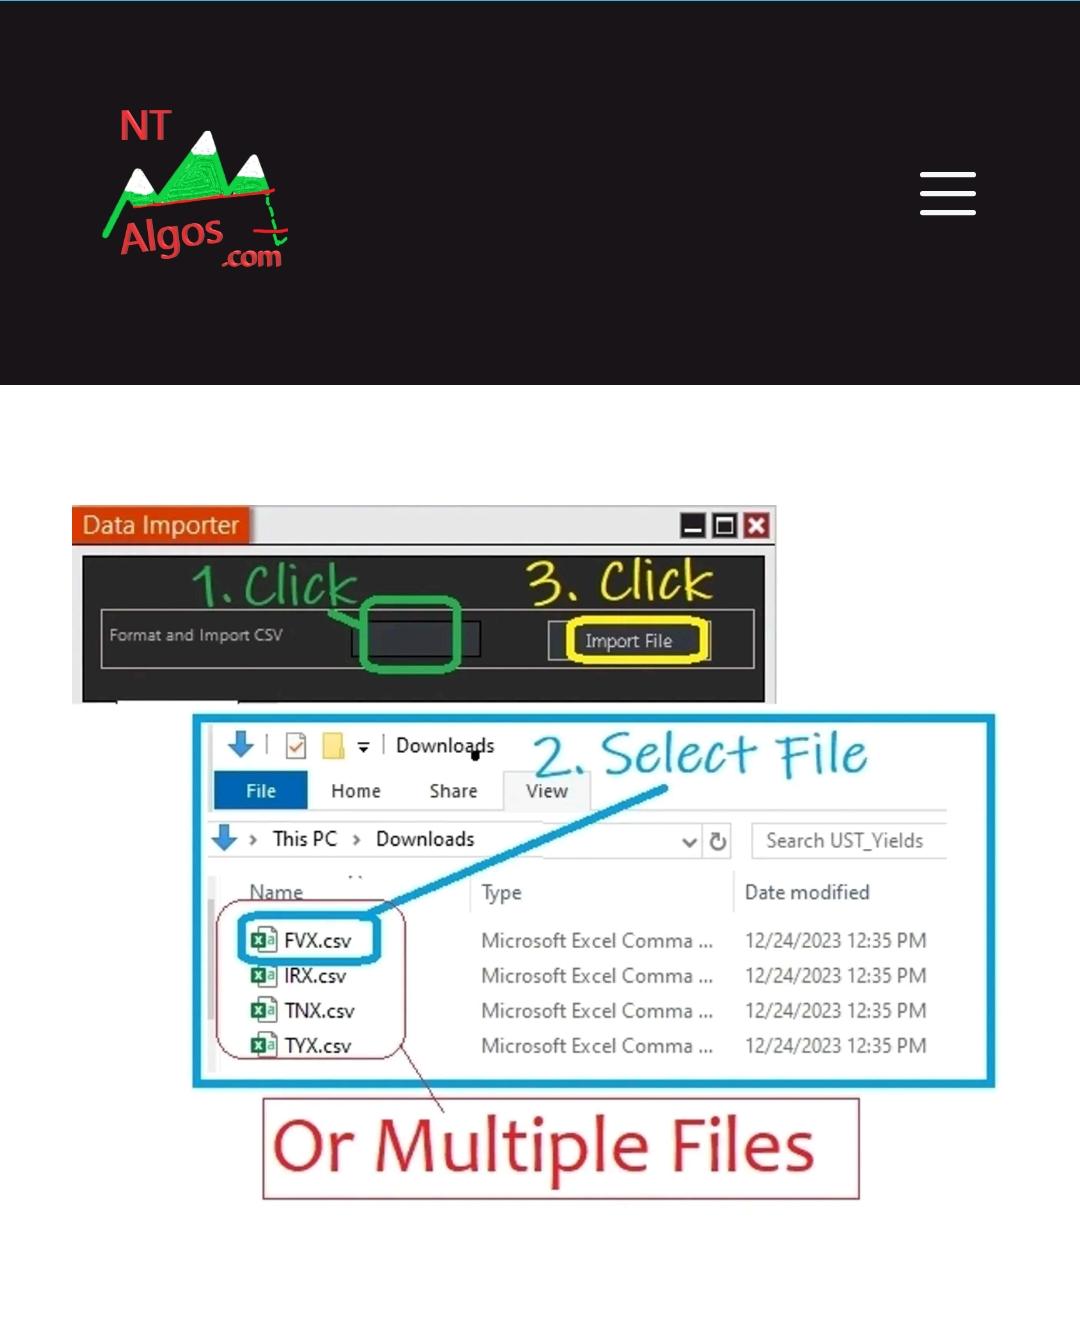
Does anyone have NT Algos data importer (Data Import Tool ) for Ninjatrader . If anyone have pls share .

-

Introduction To Online Forex Trading
binaryowner replied to StefGrig's topic in General Forex Discussions
Since mastering leverage and risk management is key, what simple demo‑account routine helped you wrap your head around pip value and position sizing? -

Market Technical Analysis by RoboForex
RBFX Support replied to RBFX Support's topic in Technical Analysis
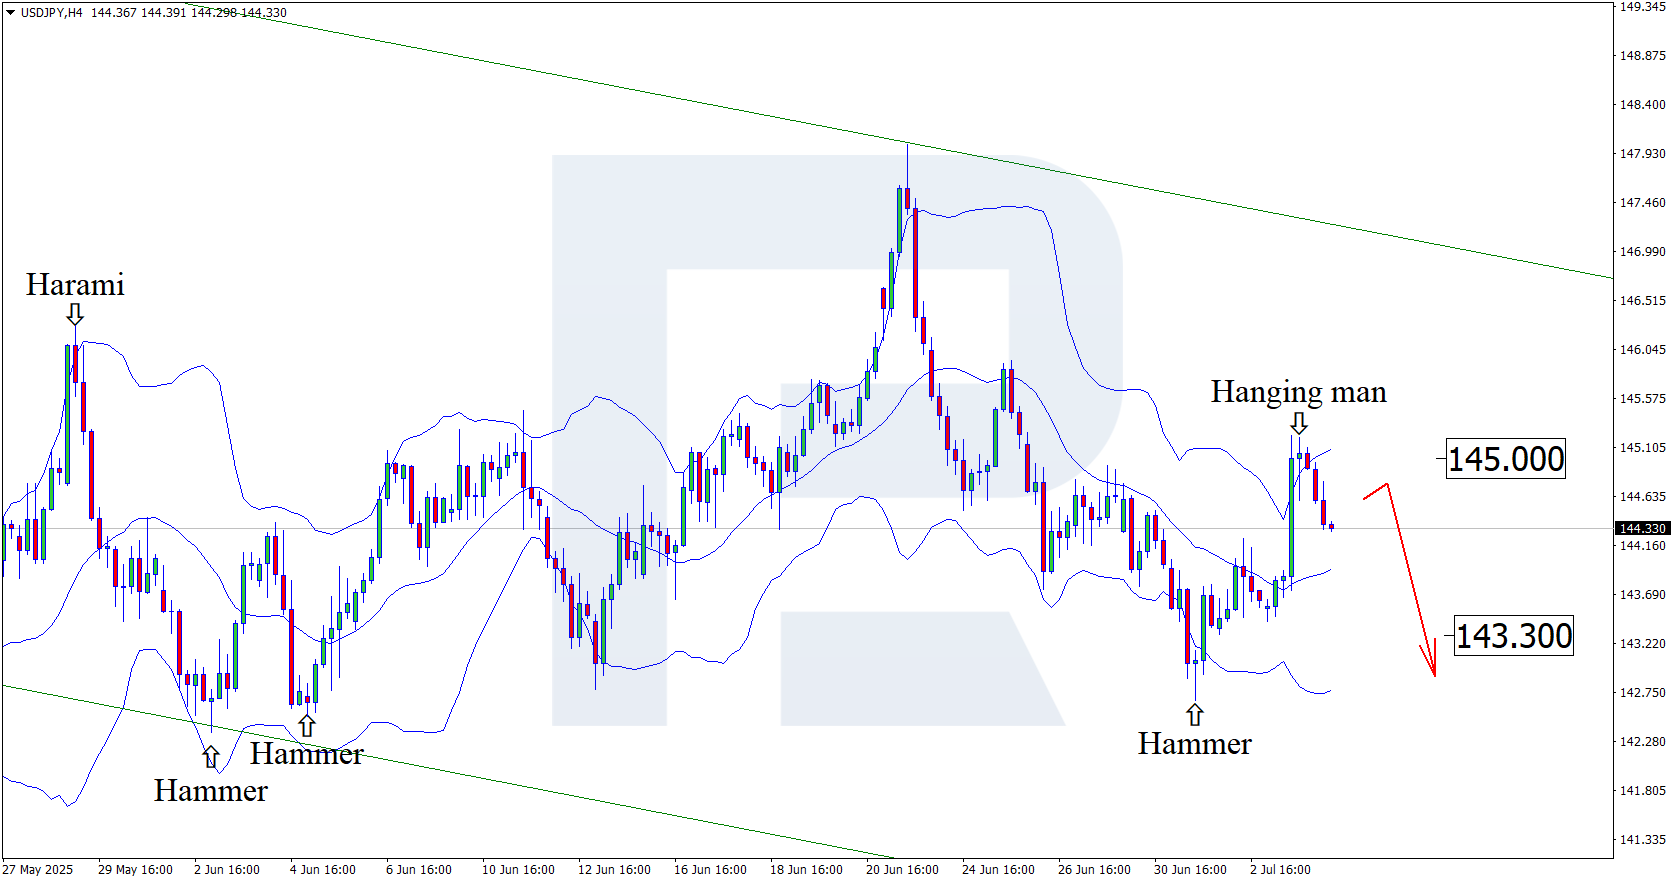
Record Japanese spending pressures the dollar: USDJPY prepares to fall Amid Japan’s economic data, the USDJPY rate may form a downward wave towards 143.30. Details – in our analysis for 4 July 2025. USDJPY technical analysis On the H4 chart, USDJPY, after testing the upper Bollinger Band, formed a Hanging Man reversal pattern and is now near 144.30. At this stage, it continues its downward wave in line with the pattern signal. USDJPY quotes remain within a descending channel, and based on this, it can be assumed that they have every chance of reaching support at 143.30. Against the backdrop of rising Japanese household spending, the USDJPY forecast looks optimistic for the yen. USDJPY technical analysis suggests a decline towards 143.30. Read more - USDJPY Forecast Attention! Forecasts presented in this section only reflect the author’s private opinion and should not be considered as guidance for trading. RoboForex bears no responsibility for trading results based on trading recommendations described in these analytical reviews. Sincerely, The RoboForex Team
-
roboforex Market Fundamental Analysis by RoboForex
RBFX Support replied to RBFX Support's topic in Fundamental Analysis
XAUUSD strengthens after collapse amid strong US employment data XAUUSD quotes are recovering due to rising safe-haven demand amid budgetary and trade risks. Current quote – 3,339 USD. Details – in our analysis for 4 July 2025. XAUUSD forecast: key trading points In June, US companies created 147,000 new jobs US unemployment rate fell to 4.1% instead of the expected 4.3% XAUUSD forecast for 4 July 2025: 3,465 Fundamental analysis XAUUSD price is rising after yesterday’s sharp decline. Gold prices fell following strong US labour market data: in June, US companies created 147,000 new jobs – significantly above the forecast of 110,000. The unemployment rate unexpectedly fell to 4.1% instead of the projected 4.3%. These figures reinforced expectations that the Fed will keep the interest rate at its current level. However, concerns over the growing US budget deficit and persistent uncertainty in trade policy have increased demand for gold as a safe-haven asset. An additional factor was the passage of President Donald Trump’s bill in Congress, which provides for tax cuts and reductions in government spending. RoboForex Market Analysis & Forex Forecasts Attention! Forecasts presented in this section only reflect the author’s private opinion and should not be considered as guidance for trading. RoboForex bears no responsibility for trading results based on trading recommendations described in these analytical reviews. Sincerely, The RoboForex Team -
The download documentation has English explanation on the bottom part
-
roddizon1978 reacted to a post in a topic:
markttechniktrading.de
-
⭐ sapperindi reacted to a post in a topic:
Accurate calculation of Elliott waves for Metastock.
-

Weis Wave NT8 indicator - Need to be unlocked
fxtrader99 replied to fxtrader99's topic in Ninja Trader 8
Up! @apmoo @kimsam please. -
fxtrader99 reacted to a post in a topic:
TDU Footprint & Footprint Trader 2.0.0.12 beta 3
-
Hello, is it still available? Could you post the links again? Thank you very much.