⤴️-Paid Ad- Check advertising disclaimer here. Add your banner here.🔥
All Activity
- Past hour
-
 ⭐ RichardGere reacted to a post in a topic:
Timingsolution & Nifty Updates - 3
⭐ RichardGere reacted to a post in a topic:
Timingsolution & Nifty Updates - 3
-
Minerva247 reacted to a post in a topic:
Timingsolution & Nifty Updates - 3
- Today
-
 Hello, Quick announcement: 1. All the resources in the forums have been moved inside the vault, which is accessible only after you log in to the community. You can access the vault here. 2. Also in the vault, you can request ebooks, materials, and downloads only in specific requirements sections. 3. You can share materials only inside THE VAULT. Do not post materials in other categories, outside the vault, as those are for discussions only. 4. Please do not share materials that are under copyright. Also, we will maintain a Do Not Share list where users can request that their materials not be shared If you have any questions, please post them here!
 -

HFMarkets (hfm.com): Market analysis services.
AllForexnews replied to AllForexnews's topic in Fundamental Analysis
[B]Date: 12th June 2026.[/B] [B]Stock Market Today: Global Stocks Rally as Oil Prices Fall and SpaceX IPO Takes Centre Stage.[/B] Global markets surged on Friday as hopes of a diplomatic breakthrough between the United States and Iran boosted investor sentiment, driving stocks higher while oil prices retreated from recent highs. Meanwhile, traders are closely watching the highly anticipated debut of SpaceX, which is set to become the largest IPO in history. The combination of easing geopolitical tensions, falling energy prices, and renewed appetite for risk assets has created a strong risk-on environment across global financial markets. Global Stock Markets Rise on Iran Ceasefire Hopes Investor confidence improved significantly after US President Donald Trump announced that planned military strikes against Iran had been cancelled and suggested that a broader peace agreement could be finalised within days. Although Iran has yet to confirm a final agreement, markets reacted positively to signs that diplomatic efforts may be gaining momentum after months of conflict that disrupted energy markets and fuelled inflation concerns. Asian equity markets posted strong gains: South Korea’s KOSPI surged 7.8% Japan's Nikkei 225 gained 3.5% Hong Kong’s Hang Seng Index rose 1.8% China’s Shanghai Composite advanced 1.6% Australia’s ASX 200 climbed 1.9% S&P 500 rose 1.8% Dow Jones Industrial Average rose +1.9% Nasdaq Composite rose +2.5% Technology stocks led the rally, with investors returning to AI-related companies after recent volatility. Notable movers included Samsung Electronics, which gained more than 11%, SK Hynix, which rose over 7%, and Tokyo Electron, which jumped more than 10%. US markets also enjoyed a strong session, with all three major indices posting their largest daily gains in months. The rally reflected growing optimism that lower oil prices could ease inflationary pressures and reduce the likelihood of further monetary tightening. The technology sector remained in focus, with investors balancing excitement over artificial intelligence growth against concerns that elevated valuations may be creating speculative excess. Why Are Oil Prices Falling? Oil prices extended losses after reports that diplomatic discussions between Washington and Tehran had progressed, reducing fears of an immediate escalation in the Middle East conflict. Brent crude fell toward $89 per barrel, while U.S. West Texas Intermediate (WTI) crude traded near $86 per barrel. The decline comes despite ongoing uncertainty surrounding the Strait of Hormuz, one of the world's most important energy shipping routes. Roughly 20% of global oil and liquefied natural gas shipments typically pass through the strait, making any disruption a major concern for global energy markets. While markets have welcomed signs of progress, analysts continue to caution that any ceasefire agreement could remain fragile. Should negotiations collapse or supply disruptions persist, oil prices could quickly move higher again, potentially reigniting inflation concerns across major economies. Lower Oil Prices Ease Inflation Concerns Falling energy prices have helped reduce market expectations for additional interest rate increases from the Federal Reserve. Treasury yields moved lower as investors reassessed inflation risks: U.S. 2-Year Treasury Yield: 4.07% U.S. 10-Year Treasury Yield: 4.47% Market pricing for another Federal Reserve rate hike later this year also declined, reflecting growing confidence that lower oil prices could support the disinflation process. For equity markets, the combination of softer energy prices and reduced rate hike expectations provides a supportive backdrop for risk assets. Currency Markets: Yen Remains Under Pressure In foreign exchange markets, the U.S. dollar stabilized after recent weakness. USDJPY traded near 160.20, a level many traders view as potentially sensitive for Japanese authorities. The yen remains close to levels that have previously prompted intervention from the Bank of Japan and the Japanese Ministry of Finance. Meanwhile, EURUSD held above 1.15 as investors continued to monitor developments in both the Middle East and global interest rate expectations. UK Economy Shows Signs of Slowing Economic data released on Friday showed that the UK economy contracted by 0.1% in April. The decline follows a strong first quarter and suggests that higher energy prices, elevated borrowing costs, and geopolitical uncertainty are beginning to weigh on economic activity. The weaker growth figures create an increasingly difficult balancing act for the Bank of England, which must manage inflation risks while avoiding further damage to economic growth. SpaceX IPO Dominates Market Attention The biggest event on traders' calendars today is the historic IPO of SpaceX. The company raised approximately $75 billion in what is expected to become the largest public offering ever, valuing the aerospace and satellite giant at approximately $1.77 trillion. Pre-market indications suggest investors remain highly optimistic, with some unofficial trading venues implying valuations above $2.3 trillion. A successful debut could have broader implications for the technology sector, particularly for future listings involving artificial intelligence, space infrastructure, and next-generation technology companies. Investors will be watching closely to see whether the IPO attracts additional capital into growth stocks or temporarily diverts funds away from established technology leaders. Key Market Themes to Watch Iran Peace Negotiations: Any confirmation or rejection of a ceasefire agreement could trigger significant volatility across equities, commodities, currencies, and safe-haven assets. Oil Price Direction: Crude oil remains one of the most important drivers of inflation expectations and central bank policy outlooks. SpaceX Trading Debut: The performance of the largest IPO in history could influence sentiment across the broader technology sector. Federal Reserve Expectations: Lower energy prices have reduced expectations for further policy tightening, but investors remain sensitive to inflation developments. Market Outlook Global markets are ending the week on a positive note as investors embrace the possibility of easing geopolitical tensions and lower energy prices. Falling oil prices have improved the outlook for inflation, supported equity markets, and reduced pressure on central banks to tighten policy further. However, traders should remain cautious. Previous optimism surrounding Middle East negotiations has faded quickly, and any setback in diplomatic discussions could rapidly reverse today's market moves. For now, risk sentiment remains firmly positive, with global stocks rallying, oil prices retreating, and investors turning their attention to what could become one of the most important IPO debuts in financial market history. [B]Always trade with strict risk management. Your capital is the single most important aspect of your trading business.[/B] [B]Please note that times displayed based on local time zone and are from time of writing this report.[/B] Click [URL='https://www.hfm.com/hf/en/trading-tools/economic-calendar.html'][B]HERE[/B][/URL] to access the full HFM Economic calendar. Want to learn to trade and analyse the markets? Join our webinars and get analysis and trading ideas combined with better understanding of how markets work. Click [URL='https://www.hfm.com/en/trading-tools/trading-webinars.html'][B]HERE[/B][/URL] to register for FREE! [URL='https://analysis.hfm.com/'][B]Click HERE to READ more Market news.[/B][/URL] [B]Andria Pichidi HFMarkets[/B] [B]Disclaimer:[/B] This material is provided as a general marketing communication for information purposes only and does not constitute an independent investment research. Nothing in this communication contains, or should be considered as containing, an investment advice or an investment recommendation or a solicitation for the purpose of buying or selling of any financial instrument. All information provided is gathered from reputable sources and any information containing an indication of past performance is not a guarantee or reliable indicator of future performance. Users acknowledge that any investment in Leveraged Products is characterized by a certain degree of uncertainty and that any investment of this nature involves a high level of risk for which the users are solely responsible and liable. We assume no liability for any loss arising from any investment made based on the information provided in this communication. This communication must not be reproduced or further distributed without our prior written permission. -
 firman07 joined the community
 -
 vojo joined the community
 -
video how to build/verify astro based models
-
 isha joined the community
 -
 Minerva247 joined the community
 -
 EdSantttt joined the community
 -
 Edsanttt joined the community
 -
 EdSantt joined the community
 -
 EdSant joined the community
 -
Maybe you should consider joining the GB at clubbingbuy. It is still pending 3-4 participants.
-
 caradine73 joined the community
 - Yesterday
-
I need it too,please share,thx
- Last week
-
Hi does any have fixed StrategyQuant X . I do appreciate it thx
-
I am interested in anything related to Gann Methods, Education, Research, Books and video courses...i have a lot of Gann related books and Video courses...i can sell or exchange with other Gann material...
- Earlier
-

roboforex Market Fundamental Analysis by RoboForex
RBFX Support replied to RBFX Support's topic in Fundamental Analysis
US Tech forecast: index hits a new all-time high The US Tech index reached a new all-time high – unusually, the trend is only gaining momentum. The US Tech forecast for next week is positive. US Tech forecast: key takeaways Recent data: US services PMI came in at 50.7 in May Market impact: the current data is negative for the technology sector Fundamental analysis The release of the US services PMI at 50.7, below the forecast of 50.9 and the previous reading of 50.9, indicates slightly weaker momentum than the market expected. The reading is still above 50.0, meaning the services sector continues to expand, but the pace of growth is slowing. Such data could have a dual impact on the US Tech index. On the one hand, a weaker PMI reduces confidence in the sustainability of economic growth, which could increase caution towards technology companies, particularly those whose valuations are already at high levels. RoboForex Market Analysis & Forex Forecasts Attention! Forecasts presented in this section only reflect the author’s private opinion and should not be considered as guidance for trading. RoboForex bears no responsibility for trading results based on trading recommendations described in these analytical reviews. Sincerely, The RoboForex Team -
Market Technical Analysis by RoboForex
RBFX Support replied to RBFX Support's topic in Technical Analysis
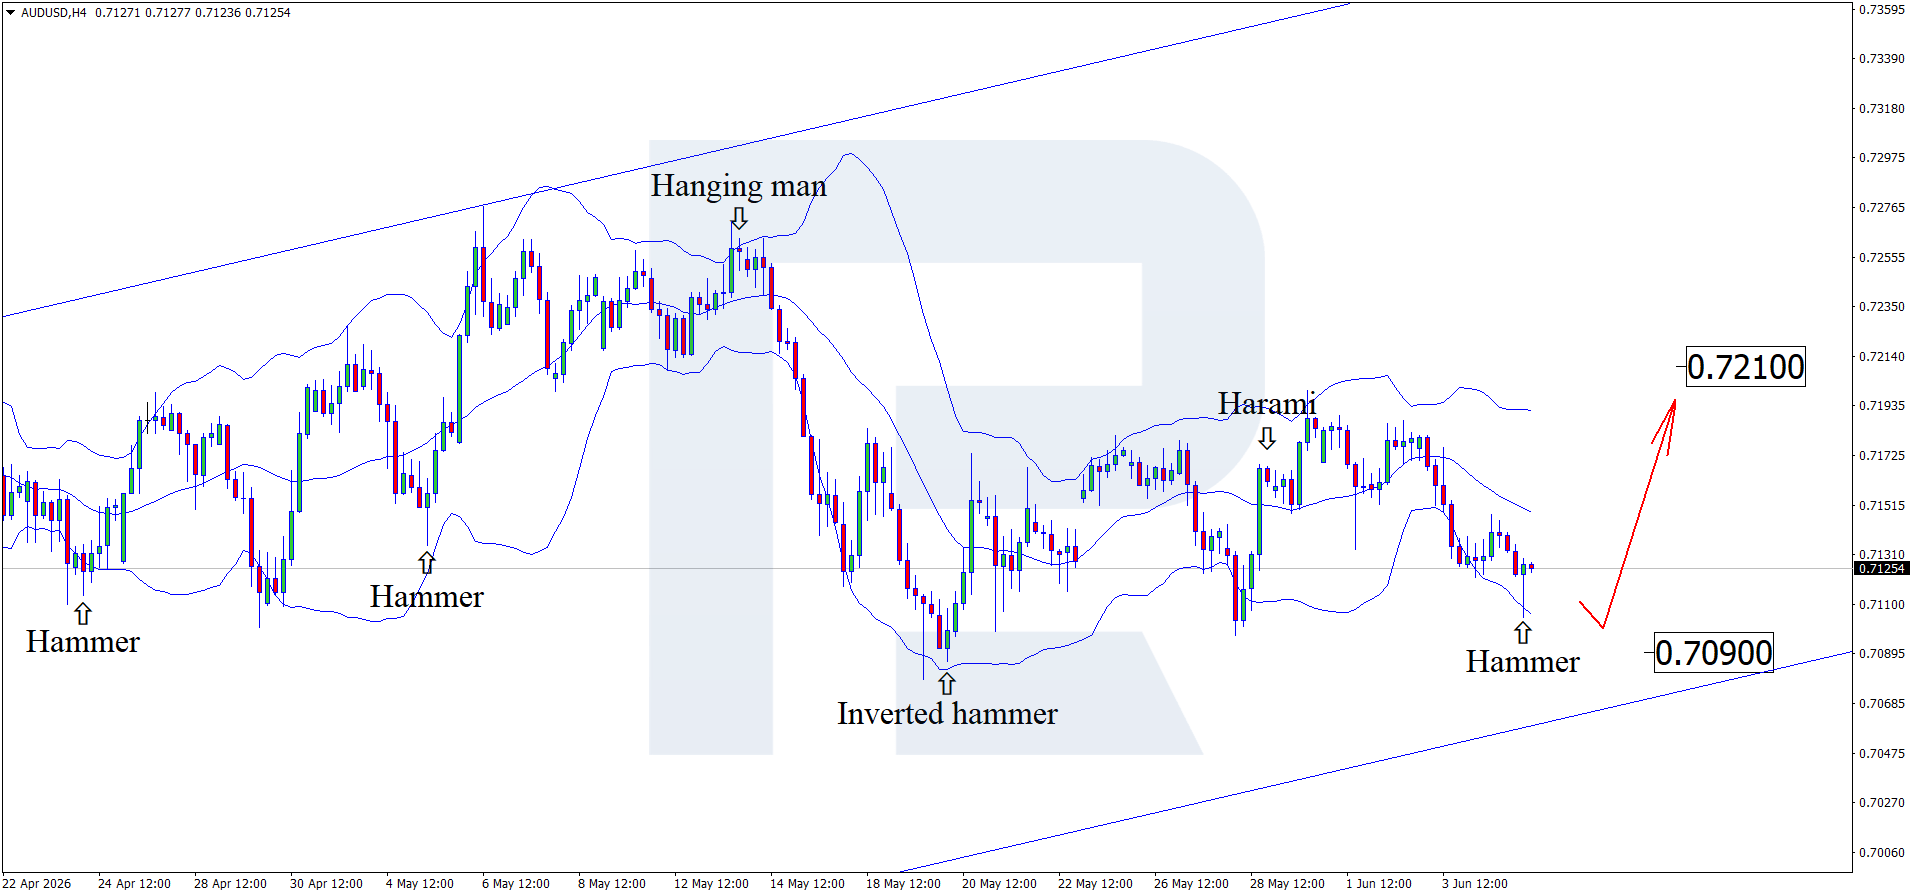
The market is underestimating the threat: AUDUSD may surprise today After a week of decline, the AUDUSD pair may spring a surprise amid the Nonfarm Payrolls release. Quotes are testing the 0.7120 level. Technical outlook The AUDUSD pair formed a Hammer reversal pattern near the lower Bollinger Band on the H4 chart. At this stage, quotes remain within an ascending channel and may continue their upward wave as the pattern signal plays out. The Australian dollar has not given up hope of strengthening; weak Australian statistics may be offset by weak US statistics. Read more - AUDUSD Forecast Attention! Forecasts presented in this section only reflect the author’s private opinion and should not be considered as guidance for trading. RoboForex bears no responsibility for trading results based on trading recommendations described in these analytical reviews. Sincerely, The RoboForex Team
-
Pips don’t pay your rent but the dollars do. Beginners count pips because $10 loss feels smaller than 10 pip loss. Check pip value first is checking if the bullet fits the gun. If you don’t know the dollar risk before entry, you’re gambling.
-
HFMarkets (hfm.com): Market analysis services.
AllForexnews replied to AllForexnews's topic in Fundamental Analysis
Date: 5th June 2026. Gold at a Crossroads: All Eyes on NFP Friday. As May’s NFP Change and the unemployment rate approaches for the US, Gold prices again take a dip. The price of the safe-haven asset has been forming a descending triangle pattern, indicating pressure on demand, but also forming a clear support level. The price movement of Gold and its outlook will particularly depend on the upcoming employment data. NFP Friday - What To Expect Market experts are expecting May’s NFP Employment Change to come in at 85,000, which is 30,000 lower than the previous month. Even though the market is expecting a lower employment change, a figure of 85,000 is still higher than the six-month average of 74,000. Traders can keep up to date with the latest releases with HFM's Calendar. The market also continues to expect the US unemployment rate to remain at 4.3% and for the average salary growth to be 0.3%. If the NFP reads higher than expectations, markets will expect the Dollar to potentially rise and Gold to simultaneously fall. Pressure on Gold will particularly rise if NFP comes in higher while the Unemployment Rate drops to 4.2%. However, traders should note that this would all depend on the data released. So far, this week’s employment data seems skewed toward an upside surprise or in line with current market expectations. The reason for this is that the recent ADP Employment figures beat expectations and rose to a 13-month high. In addition to this, the JOLTS Job Openings also came in considerably higher than expectations. However, yesterday’s Weekly Unemployment Claims rose to a four-month high of 225,000. The descending triangle pattern seen on Gold is also known to be a potential indication of downward price movement. Therefore, technical analysis will also be in line with the fundamentals if the US employment data is positive. However, a lower employment change and a higher unemployment rate can have the opposite effect. Gold Holds Neutral, But What Signals Are Emerging? On NFP Friday, the price of Gold fell during the Asian session by 1.09% to the $4,426.65 support level before rebounding at the London open. Nonetheless, the price continues to maintain lower highs and trades lower as the NFP release approaches. The US Dollar Index is also declining this morning, which can provide some support for Gold. However, a key factor will also be bond yields, which the US is struggling to keep below 4.50%. US bond yields in the last two weeks of May fell from their recent highs, but in June they have not fallen further. In June, bond yields have continued to trade sideways. How bond yields react after the NFP release will particularly impact Gold. If bond yields rise, gold may come under pressure, while lower bond yields can support the price. Gold trading remains active, although speculative positions continue to decline. This suggests that gold is moving away from its risk-driven investment appeal and returning to its traditional role as a safe-haven asset. According to the latest CFTC report, net speculative gold positions fell from 159.8 thousand to 154.3 thousand last week. However, investors still hold large buy positions. Buyers held 124.5 thousand positions, while sellers held 27.6 thousand. Last week, buyers slightly increased their positions, while sellers reduced theirs. Furthermore, what remains key for Gold is the possibility of an interest rate hike declining. Over the past 24 hours the possibility of a rate hike has remained at 46%, but investors will be watching how this changes after the NFP release. HFM - Gold 1-Hour Chart The price of Gold continues to remain below the key moving averages on the 1-hour and 2-hour charts. However, the price trades at 48.74 on the RSI, which is a clear neutral indication, meaning the price is not witnessing a clear sell signal. However, if the price declines below $4,442.15, Gold may see sell signals strengthen. If the price rises above $4,484.80, buy signals can potentially materialise. However, indications provided by technical analysis will also need to be in line with the NFP release, the US Dollar reaction, as well as the bond market. Key Takeaways: Gold remains under pressure ahead of the NFP release, with the price forming a descending triangle pattern. A stronger-than-expected NFP reading could support the US Dollar and pressure Gold, especially if unemployment falls and bond yields rise. A weaker NFP figure or higher unemployment rate could support Gold, particularly if the Dollar and US bond yields move lower after the release. Gold’s technical signal remains neutral for now. A move below $4,442.15 could strengthen sell signals, while a move above $4,484.80 could support buy signals. Always trade with strict risk management. Your capital is the single most important aspect of your trading business. Please note that times displayed based on local time zone and are from time of writing this report. Click HERE to access the full HFM Economic calendar. Want to learn to trade and analyse the markets? Join our webinars and get analysis and trading ideas combined with better understanding of how markets work. Click HERE to register for FREE! Click HERE to READ more Market news. Michalis Efthymiou HFMarkets Disclaimer: This material is provided as a general marketing communication for information purposes only and does not constitute an independent investment research. Nothing in this communication contains, or should be considered as containing, an investment advice or an investment recommendation or a solicitation for the purpose of buying or selling of any financial instrument. All information provided is gathered from reputable sources and any information containing an indication of past performance is not a guarantee or reliable indicator of future performance. Users acknowledge that any investment in Leveraged Products is characterized by a certain degree of uncertainty and that any investment of this nature involves a high level of risk for which the users are solely responsible and liable. We assume no liability for any loss arising from any investment made based on the information provided in this communication. This communication must not be reproduced or further distributed without our prior written permission. -
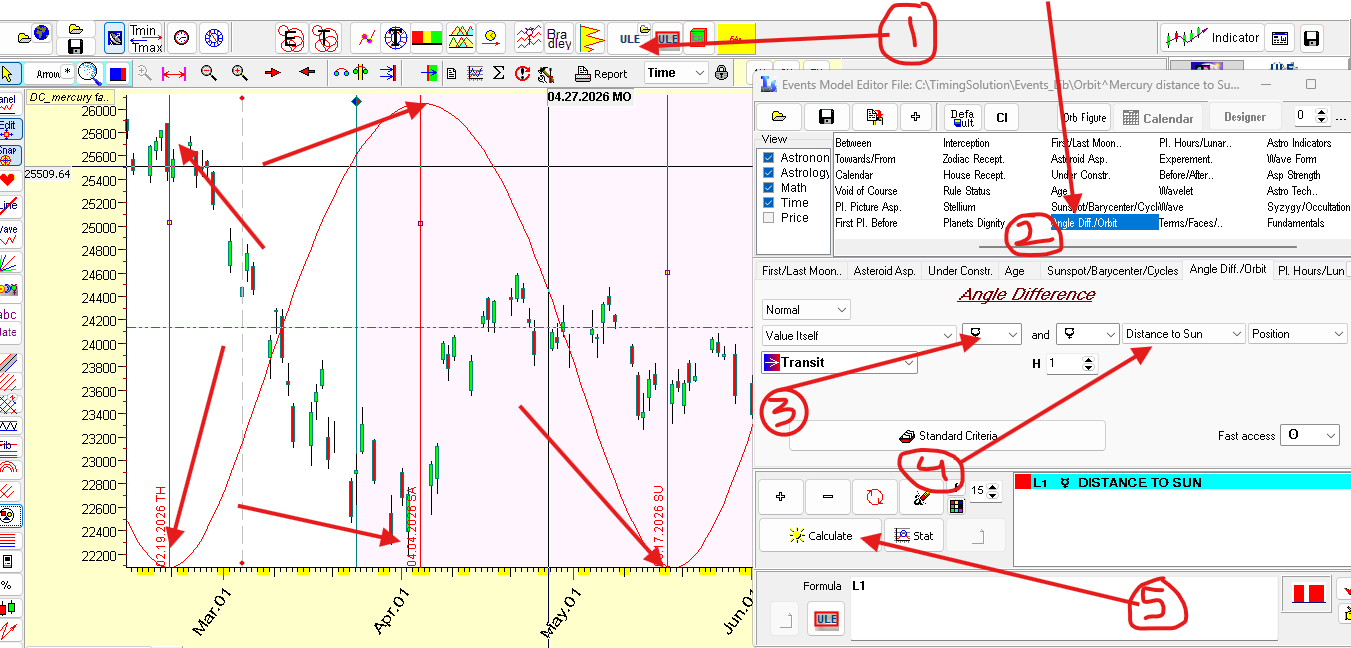
Yes Agreed, I am also trying to find tradeable technique on Nifty in TS. Astro based techniques tend deviate 1 or 2 days from the date of occurrence. Also I think we can not trade only based on Astro technique alone, we need to have validation from other technical indicators. Lets observe how Nifty reacts around future dates.
-
Santosh Thanks for the picture. What I have noticed in TS is that, historically its good at picking turning points/ups/downs. But on a forecasting basis, it mostly fails, this was my observation. Lost heavily based on its forecasts some years ago. Recall my posts earlier -:( Just as a validation, pickup 2 dates in the future and lets see if it works! Please understand, I am genuinely interested and not to test/poke fun !!
-
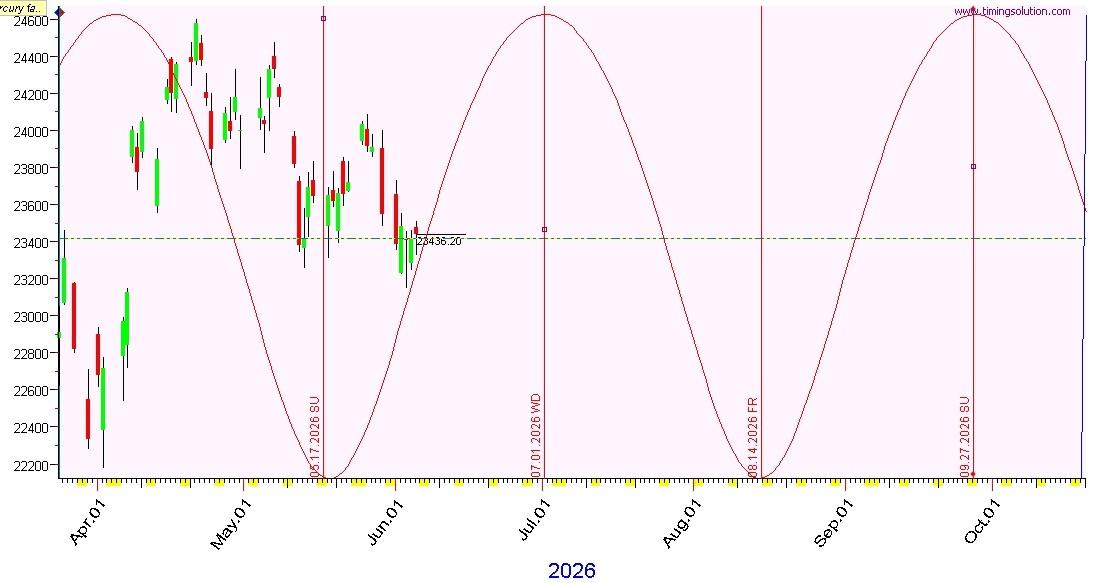
most of the time Nifty tend to change its direction when mercury reaches farthest to sun, check screenshot attached to do same in TS
-
Market Technical Analysis by RoboForex
RBFX Support replied to RBFX Support's topic in Technical Analysis
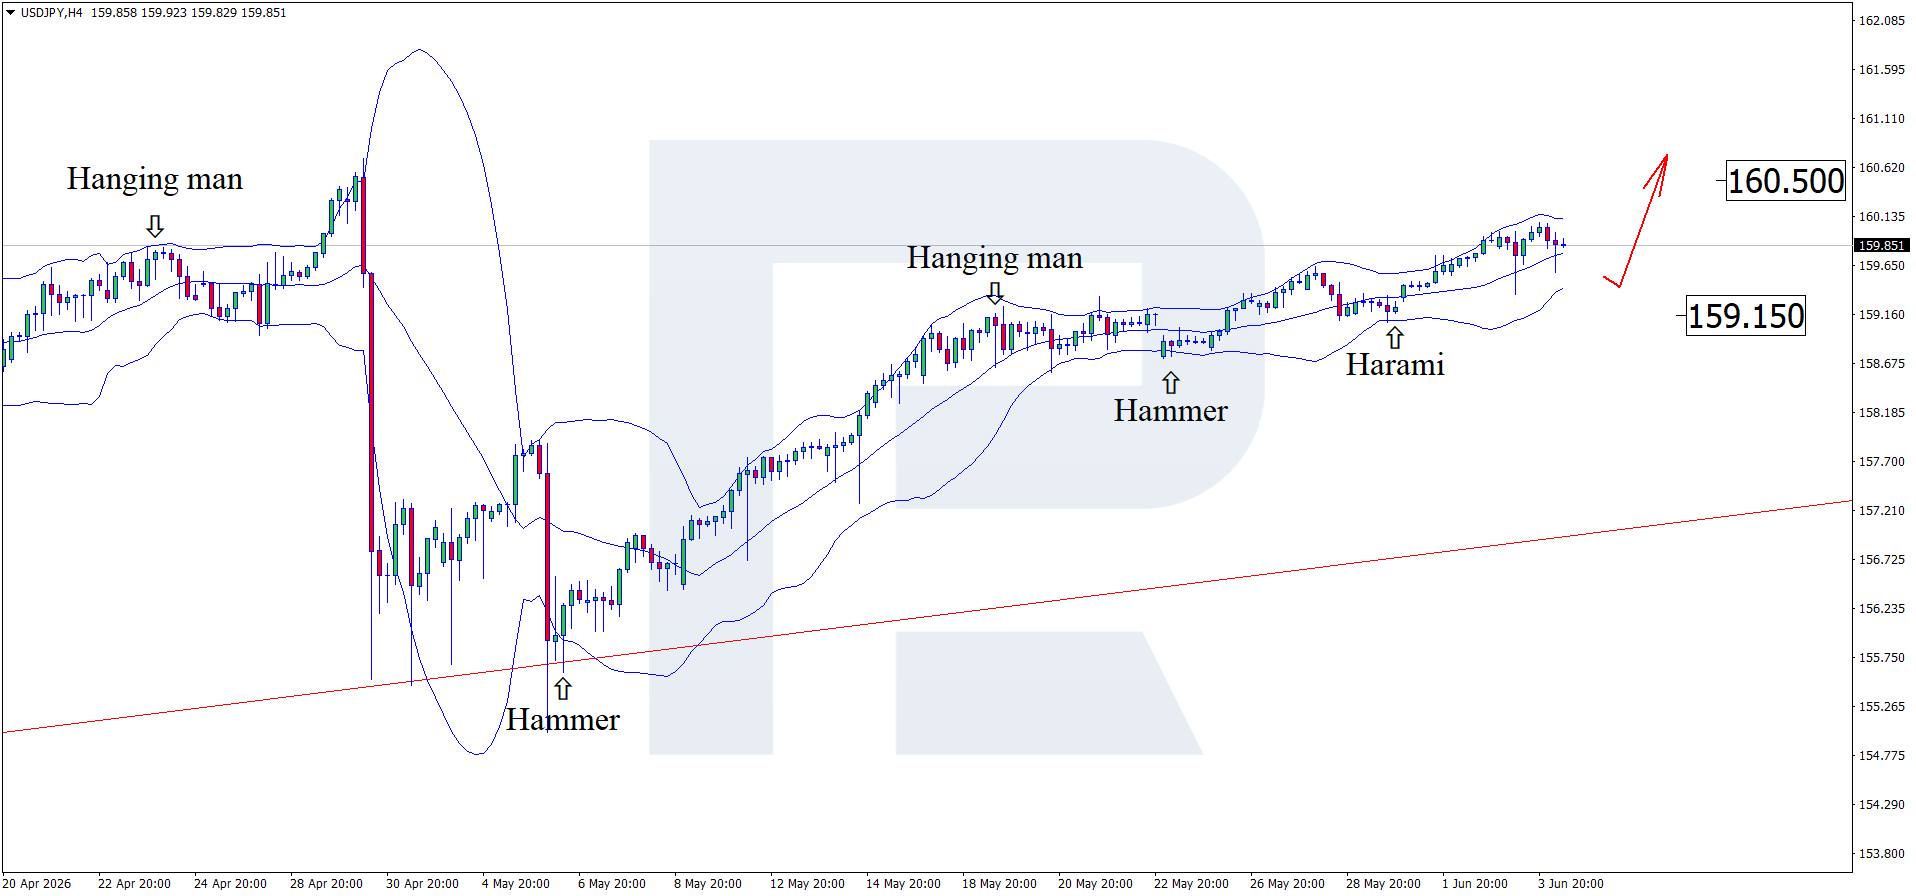
USDJPY trapped in a vice, the Japanese government is keeping a low profile After testing the psychological 160.00 level, the USDJPY pair failed to consolidate above it and pulled back. The rate currently stands at 159.85. Technical outlook On the H4 chart, the USDJPY pair formed a Harami reversal pattern near the lower Bollinger Band and is trading around 159.85. Since the price remains within an ascending channel, it could form an upward wave following the pattern signal, with the upside target remaining at 160.50. The USDJPY pair attempted to break above the psychological 160.00 level and consolidate above it, but buyers lacked the strength to do so. Read more - USDJPY Forecast Attention! Forecasts presented in this section only reflect the author’s private opinion and should not be considered as guidance for trading. RoboForex bears no responsibility for trading results based on trading recommendations described in these analytical reviews. Sincerely, The RoboForex Team
-
roboforex Market Fundamental Analysis by RoboForex
RBFX Support replied to RBFX Support's topic in Fundamental Analysis
Brent may spring an unpleasant surprise The situation in the Middle East is triggering Brent prices. After rising, quotes are forming a corrective wave and are currently hovering around 96.30 USD. Brent forecast: key takeaways US crude oil inventories fell by 8 million barrels last week Inventories at the largest terminal in Cushing declined to minimum operating levels Brent forecast for 4 June 2026: 100.50 Fundamental analysis The Brent forecast for 4 June 2026 shows that, after rising, oil prices are forming a corrective wave, primarily driven by geopolitical de-escalation, which has eased supply concerns. At this stage, Brent quotes are testing the 96.30 USD per barrel mark. A ceasefire agreement between Israel and Lebanon was announced a day earlier. This breakthrough, mediated by the US, is viewed by the market as an important step towards de-escalating the conflict in the Middle East. RoboForex Market Analysis & Forex Forecasts Attention! Forecasts presented in this section only reflect the author’s private opinion and should not be considered as guidance for trading. RoboForex bears no responsibility for trading results based on trading recommendations described in these analytical reviews. Sincerely, The RoboForex Team -
HFMarkets (hfm.com): Market analysis services.
AllForexnews replied to AllForexnews's topic in Fundamental Analysis
Date: 4th June 2026. US Dollar Surges While Broadcom Triggers a Tech Sell-Off. An interesting 24 hours for the financial markets, with strong new US economic data, a Hezbollah-Israel ceasefire, and Broadcom earnings. The US Dollar saw a significant rise on Wednesday and is now trading close to a two-month high. The latest US economic data, higher oil prices, and the lack of progress with Iran support the US Dollar. In addition to the US Dollar and oil rising, stock fell 1% as traders took a slightly more risk-off approach. This is due to weaker Broadcom earnings and interest rate expectations. Broadcom Earnings Fail to Meet Analysts’ Extreme Predictions Broadcom is the sixth most influential stock for the NASDAQ and holds a weight of almost 5%. The stock is declining more than 12%, with the price falling from $481 to $413. The reason for the decline was the latest earnings report, which was made public after the market closed. Even though the quarterly earnings report did not meet analysts’ expectations, most analysts are advising that the predictions may have been slightly overoptimistic and the official figures remain positive. Nonetheless, the stock continues to come under pressure from selling pressure as do NVIDIA, Micron Technology, and AMD stocks. Broadcom reported strong Q2 FY2026 results, with revenue up 48% YoY to $22.19 billion, adjusted EPS of $2.44, and adjusted EBITDA of $15.24 billion. The main driver was AI, with AI semiconductor revenue rising 143% YoY to $10.8 billion. For the next quarter, Broadcom guided revenue of around $29.4 billion and AI semiconductor revenue of $16.0 billion. This was the main sticking point for investors, who had been expecting greater guidance for the next quarter. NASDAQ - Broadcom’s Forward Guidance Pressures Tech Stocks The NASDAQ fell 0.80% on Wednesday, opened with a bearish gap this morning, and is falling a further 0.18% so far. The decline is largely due to the decline among semiconductor stocks, particularly Broadcom, which is witnessing extreme volatility. HFM - NASDAQ 30-Minute Chart However, the stronger US Dollar and higher oil prices are damaging demand for stocks, particularly while index trading is at an all-time high. A fear for investors is that the Strait of Hormuz remains closed for a further month. As a result, oil prices will remain higher for longer, and this is impacting interest rate expectations and can pressure GDP growth. According to the Chicago exchange, the market’s expectations for interest rate hikes in 2026 have risen over the past month from 32.9% to 46.6%. The increase in the likelihood of hawkish interest rate adjustments is pressuring demand for stocks. The VIX index, which rose 1.40% this morning, and the put-all ratio, which increased for the first time since 15 May, also point to sell signals. The put-all ratio also suggests that the stock market may be overstretched. However, the component percentage is yet to indicate a full bearish signal. 59% of the most influential stocks are decreasing in value, not enough to support a sell signal. If a further two stocks turn negative, the NASDAQ component percentage will also indicate a sell. Technical analysis, on the other hand, is providing a sell signal on smaller timeframes. The price trading below the VWAP and moving averages also shows this. The US Dollar - ADP Employment Change Exceeds Expectations The US Dollar is trading slightly lower this morning, but is considerably higher than yesterday’s open. The worst-performing currencies of the day so far are the Canadian Dollar and the Australian Dollar. The recent ADP Employment Change and ISM Services PMI were key reasons for the Dollar’s rise. April JOLTS data showed US job openings rising from 6.887 million to 7.618 million, well above forecasts of 6.860 million, signalling continued labour-market strength. Yesterday’s ADP NFP Change also came in higher than expectations, again supporting the currency further. The ADP NFP Change came in at 122,000, higher than expectations and the previous month. The ISM Services Index also read higher than expectations. Markets now await May employment data, which could increase expectations of tighter Fed policy if results are strong. The NFP change and unemployment rate will be made public tomorrow afternoon. Stronger data can again further support the Dollar. HFM - AUDUSD 30-Minute Chart Key Takeaways: The US Dollar strengthened after stronger US labour and services data reduced expectations of Fed support. The recent ADP Employment Change and ISM Services PMI was a key reason for the Dollar’s rise. Broadcom’s results were positive, but its AI guidance disappointed high investor expectations, pressuring semiconductor stocks. The NASDAQ weakened as tech stocks fell, the US Dollar rose, and oil prices increased. Markets look to May NFP and unemployment data, which could further influence Fed rate expectations. Always trade with strict risk management. Your capital is the single most important aspect of your trading business. Please note that times displayed based on local time zone and are from time of writing this report. Click HERE to access the full HFM Economic calendar. Want to learn to trade and analyse the markets? Join our webinars and get analysis and trading ideas combined with better understanding of how markets work. Click HERE to register for FREE! Click HERE to READ more Market news. Michalis Efthymiou HFMarkets Disclaimer: This material is provided as a general marketing communication for information purposes only and does not constitute an independent investment research. Nothing in this communication contains, or should be considered as containing, an investment advice or an investment recommendation or a solicitation for the purpose of buying or selling of any financial instrument. All information provided is gathered from reputable sources and any information containing an indication of past performance is not a guarantee or reliable indicator of future performance. Users acknowledge that any investment in Leveraged Products is characterized by a certain degree of uncertainty and that any investment of this nature involves a high level of risk for which the users are solely responsible and liable. We assume no liability for any loss arising from any investment made based on the information provided in this communication. This communication must not be reproduced or further distributed without our prior written permission. -
Do not open too many trades at the same time. When you overtrade, you lose focus and make mistakes. It is better to wait for one high-quality setup today. Patience pays much better than trading twenty times a day.
-

Do emotions determine profits more than analysis?
hhduy replied to Bambang Sugiarto's topic in General Forex Discussions
Analysis gives you the plan, but emotion changes it. Many people know how to read charts. However, they cannot sit still when the market moves fast. Discipline is the real key to profit. -
roboforex Market Fundamental Analysis by RoboForex
RBFX Support replied to RBFX Support's topic in Fundamental Analysis
US 30 index forecast: growth momentum has weakened, but the uptrend remains The US 30 index is trading near its all-time high, but the likelihood of a downward correction is increasing. The US 30 forecast for today is positive. US 30 forecast: key takeaways Recent data: US GDP rose by 1.6% year-over-year in Q1 2026 Market impact: the data is negative for the stock market Fundamental analysis US quarterly GDP data came in below expectations, showing actual growth of 1.6%, below the forecast of 2.0% but up from the previous 0.5%. For the US 30 index, this is a mixed signal, but in the short term, it is more likely to have a moderately negative effect. For the US 30 index, which includes major US industrial, financial, consumer, and technology companies, softer GDP could reduce appetite for more cyclical stocks. RoboForex Market Analysis & Forex Forecasts Attention! Forecasts presented in this section only reflect the author’s private opinion and should not be considered as guidance for trading. RoboForex bears no responsibility for trading results based on trading recommendations described in these analytical reviews. Sincerely, The RoboForex Team -
HFMarkets (hfm.com): Market analysis services.
AllForexnews replied to AllForexnews's topic in Fundamental Analysis
Date: 3rd June 2026. US Dollar Surges as Employment Data Sees Rate Cut Hopes Fade. The US Dollar regains momentum due to positive employment data fading any likelihood of interest rate cuts in 2026. The US JOLTS Job Openings data made public on Tuesday afternoon read considerably higher than market expectations. As a result, the US Dollar Index was quick to increase in value, with the bullish momentum continuing during this morning’s Asian session. The Middle East tensions are also partially supporting the price of the US Dollar due to its safe-haven status. According to reports, negotiations had been put on hold by Iran due to its dissatisfaction with Israel. However, according to Axios, the negotiations are back on track after President Trump pressured Netanyahu to avoid further escalations. Nonetheless, the higher tensions are triggering higher oil prices, which again are supporting the US Dollar. JOLTS Job Openings - US Dollar Finds Further Support The US JOLTS Job Openings rose to their highest since December 2026 and came in almost 800,000 above expectations. Analysts were expecting a figure in the region of 6.70-7.60 million new job vacancies, whereas the figure came in at 7.62 million. This afternoon, the US will also release the ADP NFP Change and the ISM Services PMI. Both releases will also further impact the Federal Reserve rate expectations and therefore also the US Dollar. Currently, there is less than a 1% possibility of the Federal Reserve reducing interest rates in 2026, according to the CME. According to the CME, there is a 42% chance of no adjustments this year, a 1% chance of a small cut, and a 57% chance of a hike. The market’s hawkish expectations for monetary policy are supporting the price of the US Dollar. While inflation is rising and the employment sector remains resilient, there is little need for the Federal Reserve to consider lowering interest rates. This afternoon, the US Treasury Secretary, Scott Bessent, will also speak regarding the 2027 budget. Investors will closely monitor comments from Mr Bessent, and they could potentially impact the Dollar and US Markets. AUDUSD - Australian GDP Underperforms While the US Dollar is the best-performing currency of the day, one of the currencies coming under pressure is the Australian Dollar. The Australian Dollar had been one of the best-performing of the previous days and of the year so far. However, a string of poor economic releases is putting the currency and the Reserve Bank of Australia under pressure. For this reason, the AUDUSD is trading 0.25% lower during this morning’s Asian session. Earlier in the day, Australia released its quarterly Gross Domestic Product. The GDP figure was 0.3%, lower than the market’s expectations of 0.5%. In addition to this, last week’s inflation figures also fell from 4.6% to 4.2%, again lower than expectations and pressuring the RBA not to become overly hawkish. HFM - AUDUSD 30-Minute Chart The AUD still remains the best-performing currency of the year, but poor economic data can support a correction in favour of the USD. On the 2-hour chart, the price is trading at the 100-bar SMA and slightly below the 75-bar EMA. In addition to this, the RSI is trading at 46.20, slightly above the sell zone. On smaller timeframes, such as the 5-minute chart, the price trades below the 200-bar SMA and with clear lower lows. However, on this timeframe, the RSI is again trading above 45.00. For this reason, the AUDUSD is showing a minor bearish bias, but not yet a clear bearish signal. However, if the price falls below 0.71565, sell signals may potentially materialise. Crude Oil - Trump Rebukes Netanyahu The price of crude oil continues to increase in value as the sentiment towards de-escalation in the Middle East remains shaky. Israel carried out new strikes in southern Lebanon despite a reported US-backed de-escalation effort. Reuters reported that Israel struck south Lebanon after holding off on attacks against Beirut due to US pressure. Currently, the market is unsure whether the US is brokering a ceasefire or simply a series of actions to de-escalate. So far, Israel is holding off on attacking the Lebanese capital. Hezbollah has accepted a US proposal to stop attacks on Israel in exchange for Israel avoiding strikes on Beirut and its suburbs. Fighting, however, has continued in the south. HFM - Crude Oil 30-Minute Chart Nonetheless, the price of Crude Oil continues to rise, with charts showing clear buy signals on smaller timeframes. For example, the RSI continues to rise above 65.00, and the price trades above the VWAP. Nonetheless, $100 per barrel is a clear psychological price for traders and can act as a resistance level. Key Takeaways: JOLTS Job Openings exceeded expectations, reinforcing confidence in the US labour market and boosting the Dollar. Markets now see almost no chance of Fed rate cuts in 2026, with expectations shifting towards rates remaining unchanged or even rising. Australia's GDP growth missed forecasts, increasing pressure on the RBA and helping drive AUD/USD lower. Uncertainty around Israel-Lebanon de-escalation efforts is keeping oil prices elevated, while safe-haven demand continues to support the US Dollar. Always trade with strict risk management. Your capital is the single most important aspect of your trading business. Please note that times displayed based on local time zone and are from time of writing this report. Click HERE to access the full HFM Economic calendar. Want to learn to trade and analyse the markets? Join our webinars and get analysis and trading ideas combined with better understanding of how markets work. Click HERE to register for FREE! Click HERE to READ more Market news. Michalis Efthymiou HFMarkets Disclaimer: This material is provided as a general marketing communication for information purposes only and does not constitute an independent investment research. Nothing in this communication contains, or should be considered as containing, an investment advice or an investment recommendation or a solicitation for the purpose of buying or selling of any financial instrument. All information provided is gathered from reputable sources and any information containing an indication of past performance is not a guarantee or reliable indicator of future performance. Users acknowledge that any investment in Leveraged Products is characterized by a certain degree of uncertainty and that any investment of this nature involves a high level of risk for which the users are solely responsible and liable. We assume no liability for any loss arising from any investment made based on the information provided in this communication. This communication must not be reproduced or further distributed without our prior written permission. -
Market Technical Analysis by RoboForex
RBFX Support replied to RBFX Support's topic in Technical Analysis
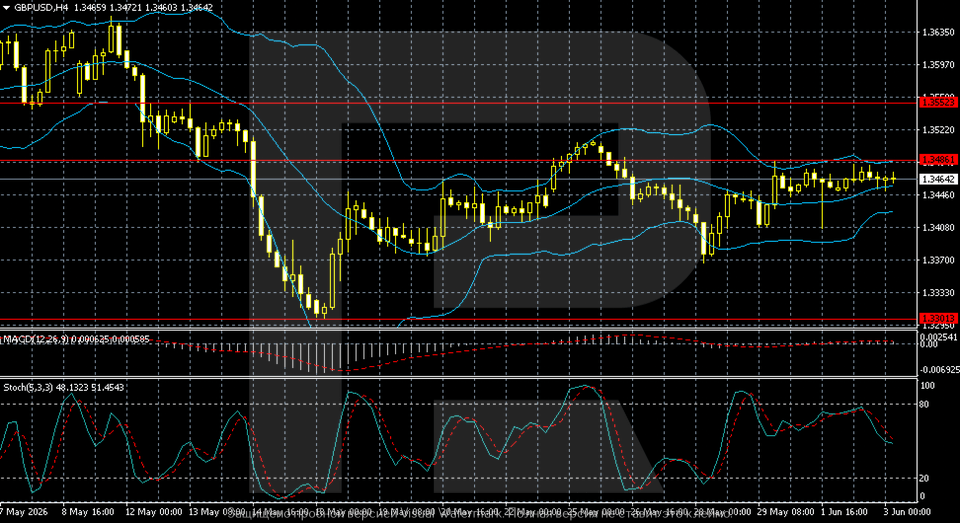
GBPUSD on hold: caught between oil rally and high interest rates The GBPUSD pair is standing in a narrow sideways range near 1.3464. The market needs strong news. Technical outlook The GBPUSD pair remains in a consolidation phase on the H4 chart after the sharp decline from May highs in the 1.3630–1.3650 area. After forming a local low near 1.3300, buyers recouped some losses, but a sustainable upward momentum has yet to emerge. The GBPUSD pair remains without a strong catalyst, but holds below crucial levels. Read more - GBPUSD Forecast Attention! Forecasts presented in this section only reflect the author’s private opinion and should not be considered as guidance for trading. RoboForex bears no responsibility for trading results based on trading recommendations described in these analytical reviews. Sincerely, The RoboForex Team
-

More than 2000 usd bonus without initial deposit
binaryowner replied to maxbox's topic in Trading Contests & Bonuses
A no-deposit bonus always needs the small print checked properly. Usually the catch is in withdrawal conditions, minimum lots, profit caps, or needing a deposit later before any profit can leave the account. I’d see it more as a test account/promo than something to depend on as real capital. If we consider bonuses with relatively fair conditions, I would suggest to take a look at HFM offers for newly registered client -
Are prizes and awards from brokers real?
binaryowner replied to hafidfx's topic in Trading Contests & Bonuses
Some broker prizes, like demo contest prizes from HFM, are real, but I’d treat them as marketing first, not free money. The prize itself matters less than the conditions behind it: trading volume, withdrawal rules, verification, and whether demo contest winnings can actually be cashed out. Good for motivation maybe, but not a reason to overtrade or increase leverage -

Anybody can recommend a broker for News trading??
Bambang Sugiarto replied to venturefx's topic in Forex Brokers
I use hw.site; it’s very beneficial there, with stable servers and tight spreads, so we can execute our trading plan.