

⤴️-Paid Ad- Check advertising disclaimer here. Add your banner here.🔥


santosh26_80
-
Posts
41 -
Joined
-
Last visited
-
Days Won
1
About santosh26_80

- Birthday 06/26/1980
Recent Profile Visitors
5,456 profile views




santosh26_80's Achievements






-
 ⭐ santosh26_80 reacted to a post in a topic:
Timingsolution & Nifty Updates - 3
⭐ santosh26_80 reacted to a post in a topic:
Timingsolution & Nifty Updates - 3
-
⭐ santosh26_80 reacted to a post in a topic:
Timingsolution & Nifty Updates - 3
-
⭐ santosh26_80 reacted to a post in a topic:
Timingsolution & Nifty Updates - 3
-
⭐ santosh26_80 reacted to a post in a topic:
Timingsolution & Nifty Updates - 3
-
 ⭐ kesk reacted to a post in a topic:
Timingsolution & Nifty Updates - 3
⭐ kesk reacted to a post in a topic:
Timingsolution & Nifty Updates - 3
-
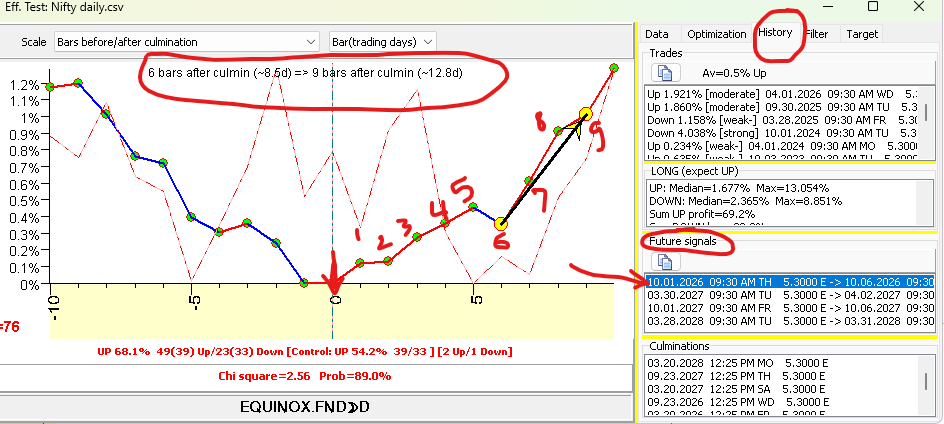
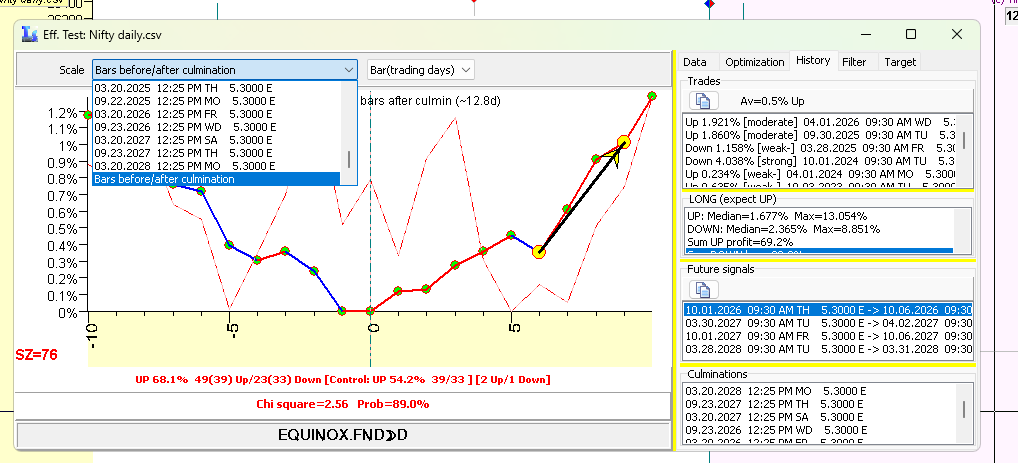
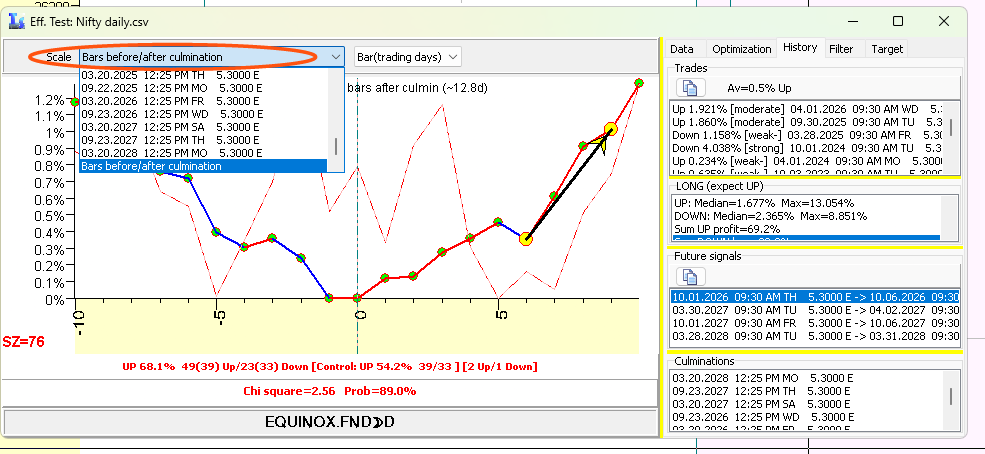
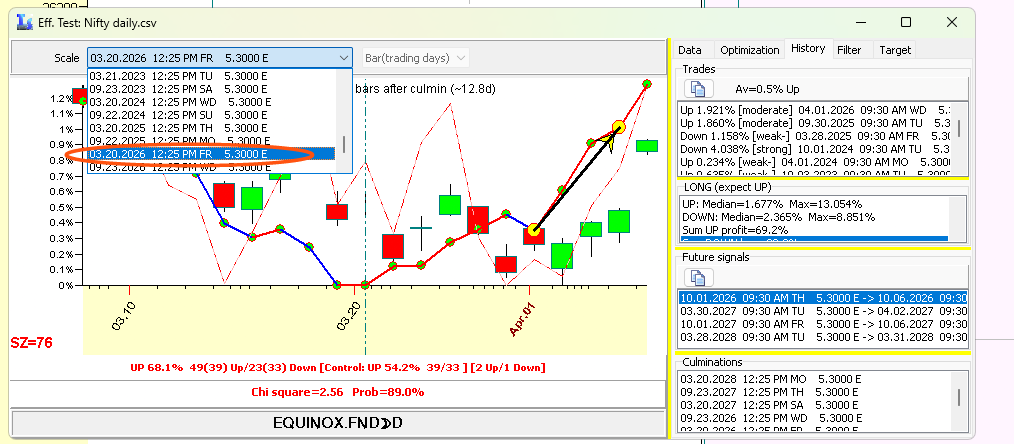
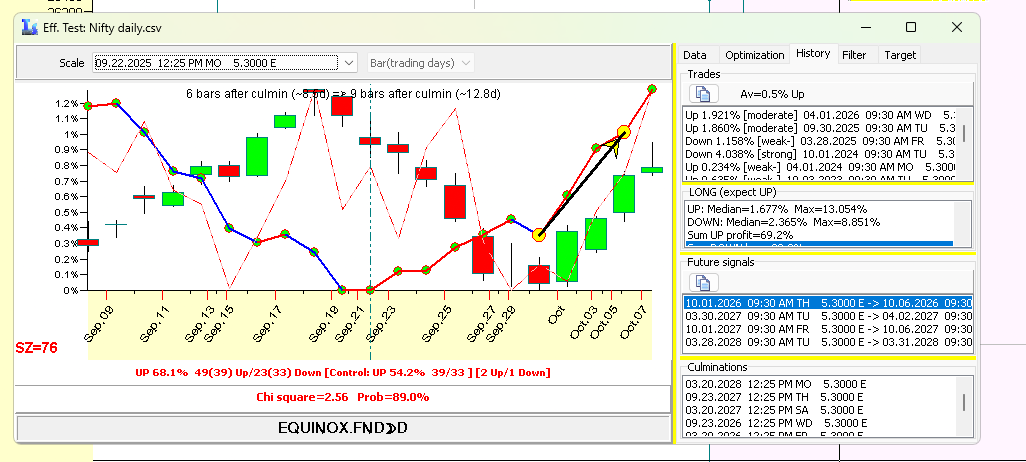
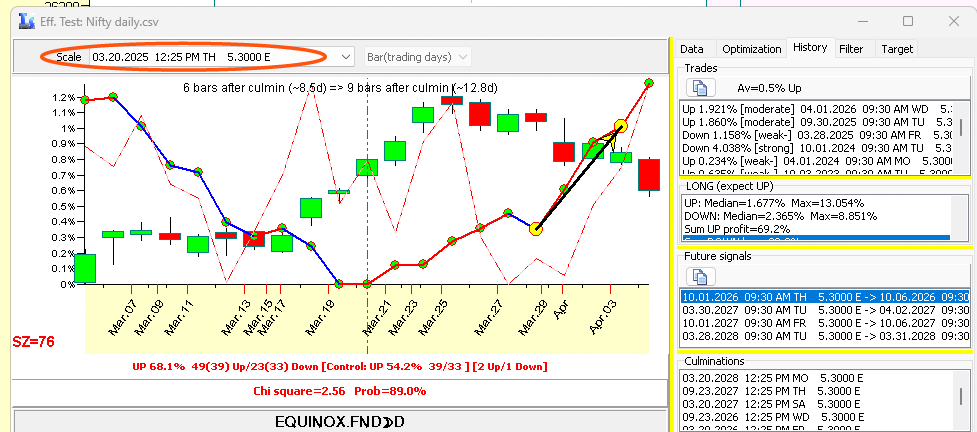
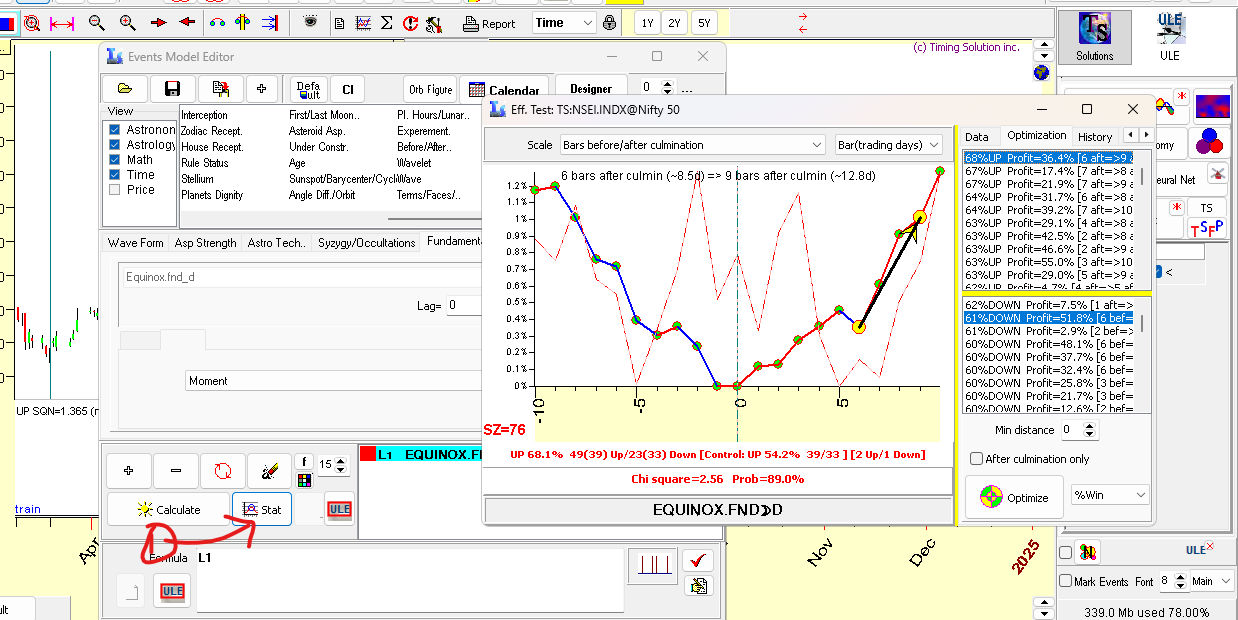
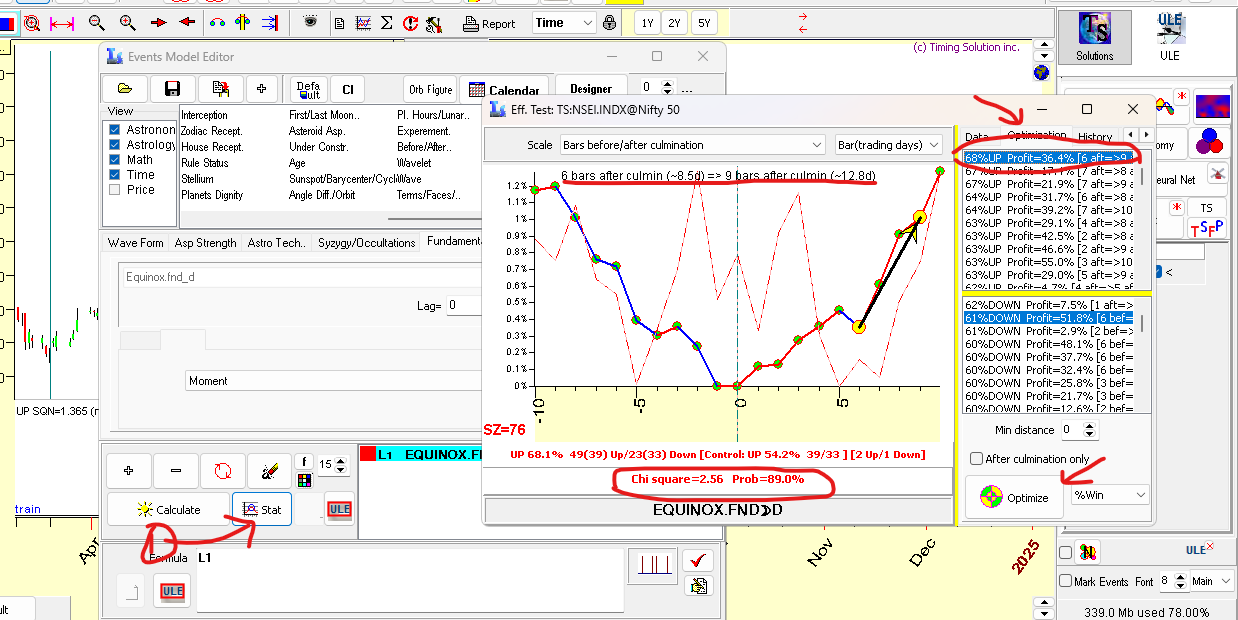
Hi Kesk, Actually see third last image, Top red underline it shows this predictable zone is active "6 bars after Culmination till 9 bars" & it has high probability, Zero line is culmination date, here i have used only equinox dates while creating fundamentals. When I saw articles around these events decided to test this in TS, I am trying to share the methodology how to do it in TS, (Or how I am trying to find some method which will help to find CIT's which is right at least 60-70% of time). Below are some more inputs on dates future & past how to check verify in TS. Also see some article aroud the event - hXXps://brameshtechanalysis.com/2024/06/23/ganns-celestial-trading-wisdom-equinoxes-and-solstices-in-financial-markets/ Check below image, Click on History to check how selected event (6bars after culmin. to 9 bars) is worked in past & percentages it has give in those dates, Also there are future dates of these probable image. I have marked bars with numbers how where predictable zone is shown in Image. If you select other lines from data tab you will get different predictable zones, I have chosen this because program showing high statistical probability of this event ie. almost 89%. Next see circled box that's where you can select history events to see how this has performed in past, Select the date here & you will see actual price action on these bars (in this case 6 to 9 bars after culmination. See when i selected date 20-march-2026, then 22- Sept 2025, 20 march 2025, Below are the results respectively, So i came across video claiming that this event has impact on market, decided to validate it in TS, found high probability event so shared method here to get if anyone has more input on it. Note. : Since event date is passed to recreate in TS delete 4-5 days data so that you get details for current event other wise you will get info on next events

-
⭐ santosh26_80 reacted to a post in a topic:
Timingsolution & Nifty Updates - 3
-
⭐ santosh26_80 reacted to a post in a topic:
Timingsolution & Nifty Updates - 3
-
⭐ RichardGere reacted to a post in a topic:
Timingsolution & Nifty Updates - 3
-
⭐ kesk reacted to a post in a topic:
Timingsolution & Nifty Updates - 3
-
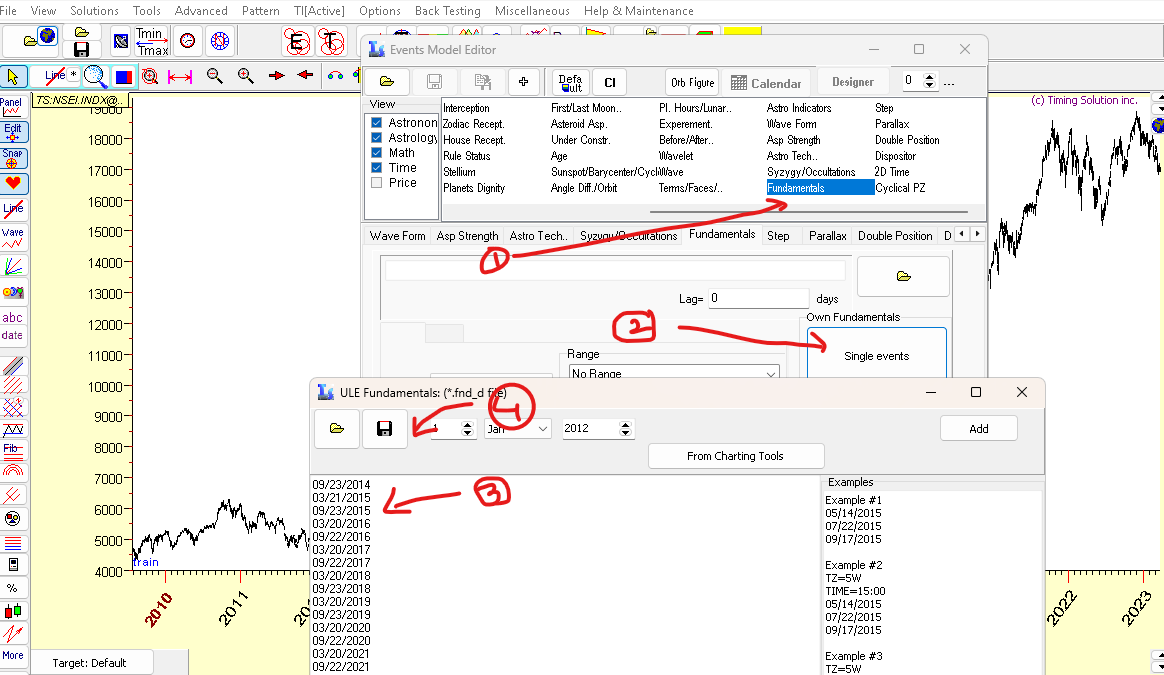
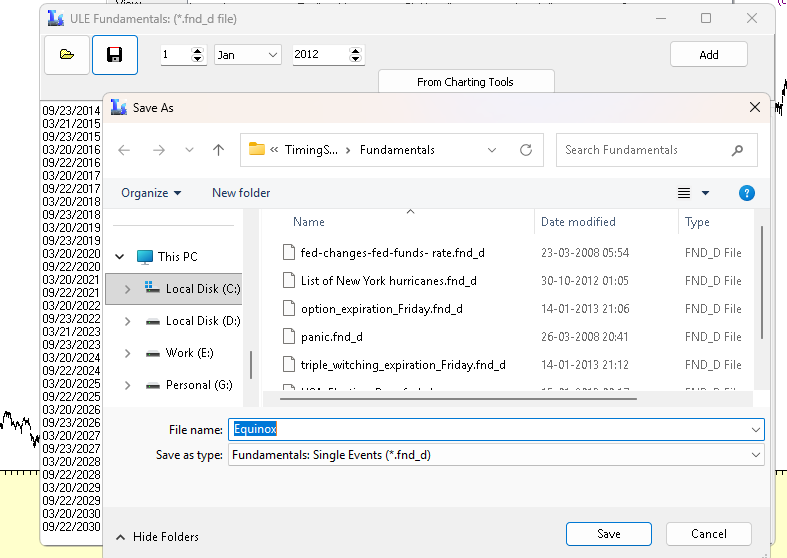
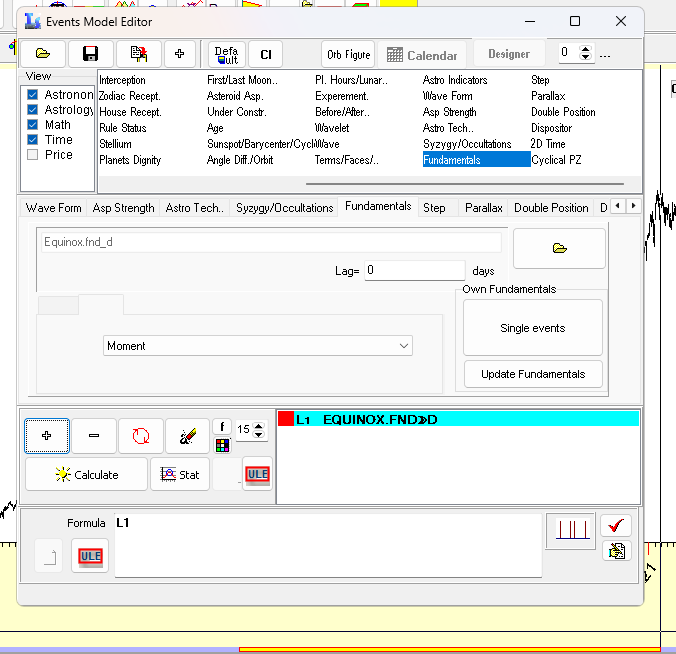
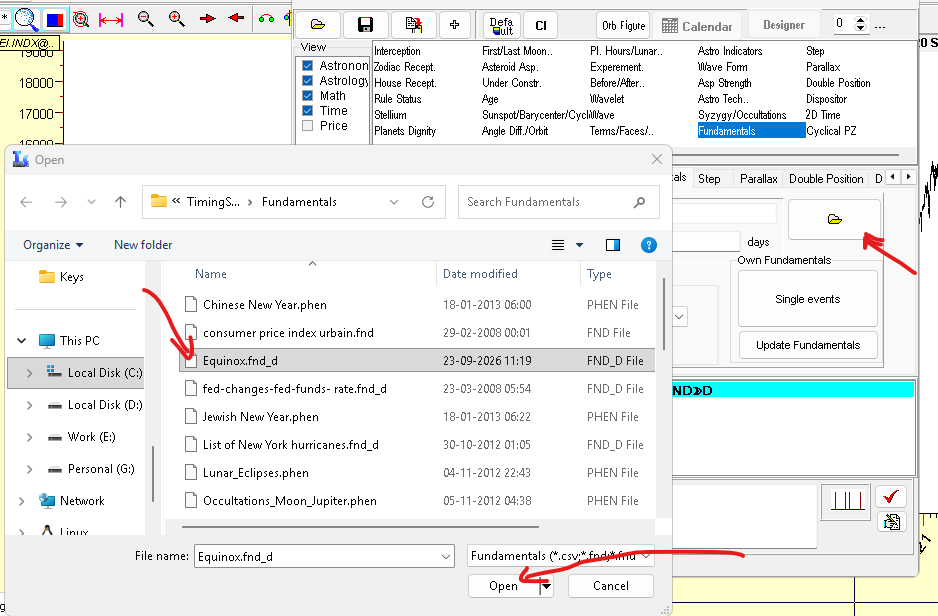
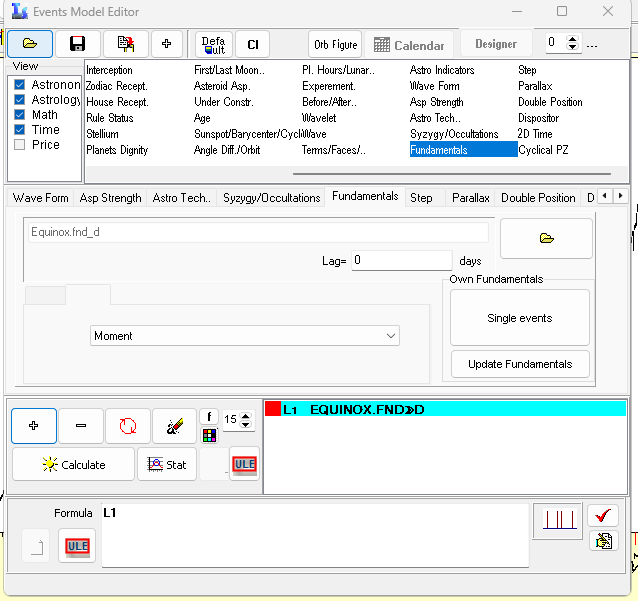
Today is equinox, most of the time we get trend changes around this date check below how to do it in TS, In Ule model, select Fundamentals, add events , Add all the Equinox dates & save file. Then Go to open folder & select file we saved, then add and calculate. Then click on stats --> optimization---> optimize, we have highlighted event, after 6 days culmination to 9 days with 89% probability of going up.
-
⭐ santosh26_80 reacted to a post in a topic:
Timingsolution & Nifty Updates - 3
-
⭐ santosh26_80 reacted to a post in a topic:
Timingsolution & Nifty Updates - 3
-
⭐ santosh26_80 reacted to a post in a topic:
Timingsolution & Nifty Updates - 3
-
⭐ santosh26_80 reacted to a post in a topic:
Timingsolution & Nifty Updates - 3
-
Yes Kesk, may be need to find past data of only events seen in india , partial or total and then analyze statistical significance of days around actual event
-
Hi Ali7qe, If you have any idea on how to apply cycles using natal data then little guidance on that will be really helpful. Thanks
-
Minerva reacted to a post in a topic:
Timingsolution & Nifty Updates - 3
-
Jean Luc Groschard reacted to a post in a topic:
Timingsolution & Nifty Updates - 3
-
a83n3rmkva reacted to a post in a topic:
Timingsolution & Nifty Updates - 3
-
⭐ RichardGere reacted to a post in a topic:
Timingsolution & Nifty Updates - 3
-
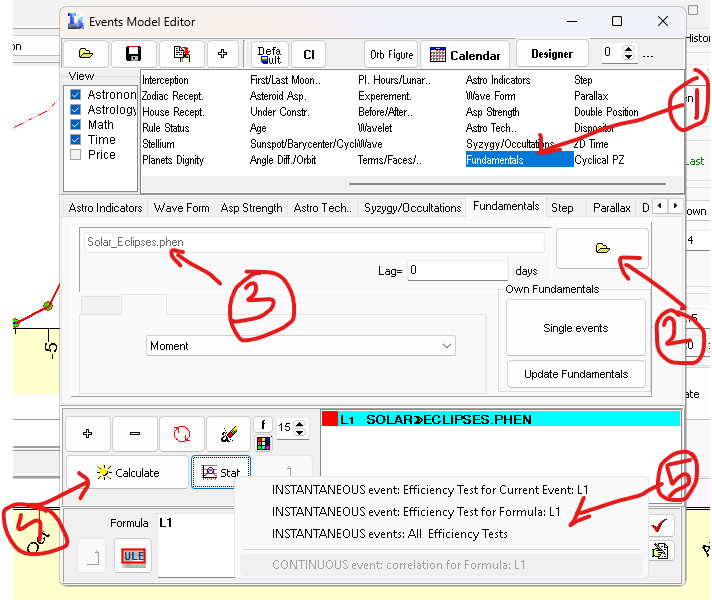
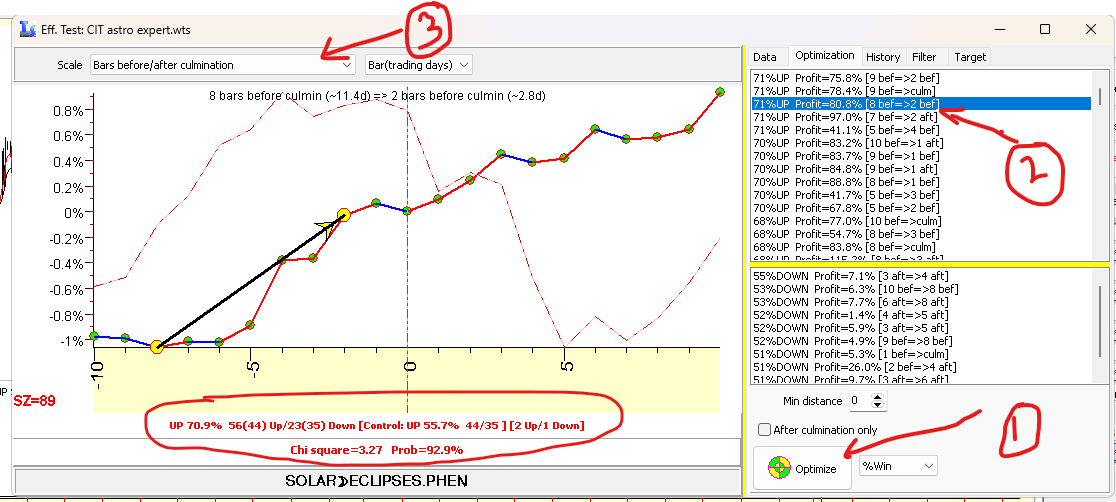
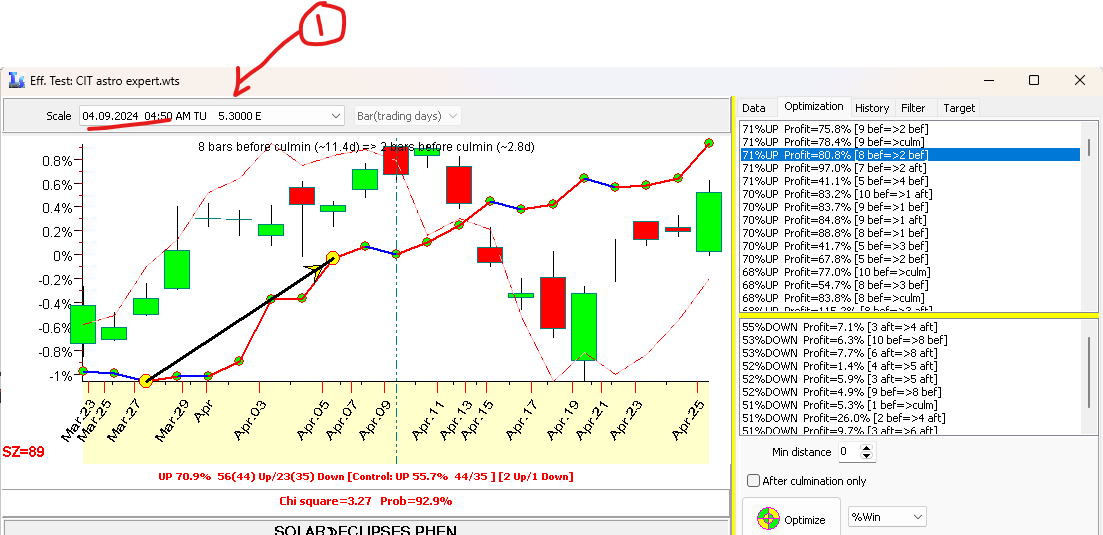
Solar eclipse is around i was checking the effect on nifty found high probability event showing up movement from 3rd Aug to 11 Aug, below are the screen shots how to do it. Run Fundamentals from ULE model & in efficiency test optimize it to get predictable zones.
-
My perspective is different on this, look for change in trend on these date instead of finding tops and bottoms. as far as trading is concerned still needs to figure out how to trade this , may be entry on breakout of high/ low of the day and keeping the dates low/ high as SL.. let’s observe couple of more dates.
-
a83n3rmkva reacted to a post in a topic:
Timingsolution & Nifty Updates - 3
-
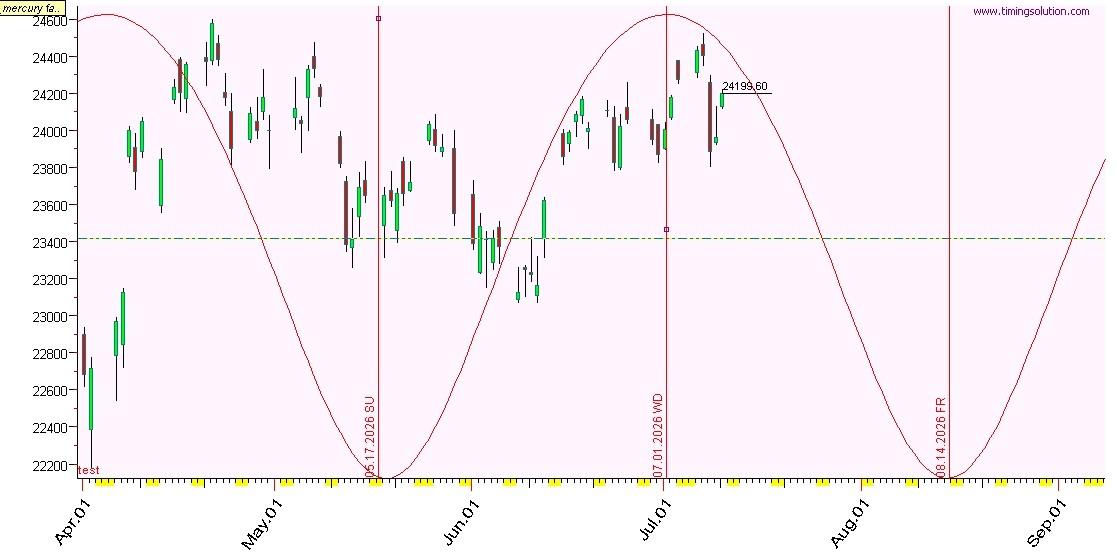
Updated chart
-
⭐ kesk reacted to a post in a topic:
Timingsolution & Nifty Updates - 3
-
Yes Agreed, I am also trying to find tradeable technique on Nifty in TS. Astro based techniques tend deviate 1 or 2 days from the date of occurrence. Also I think we can not trade only based on Astro technique alone, we need to have validation from other technical indicators. Lets observe how Nifty reacts around future dates.
-
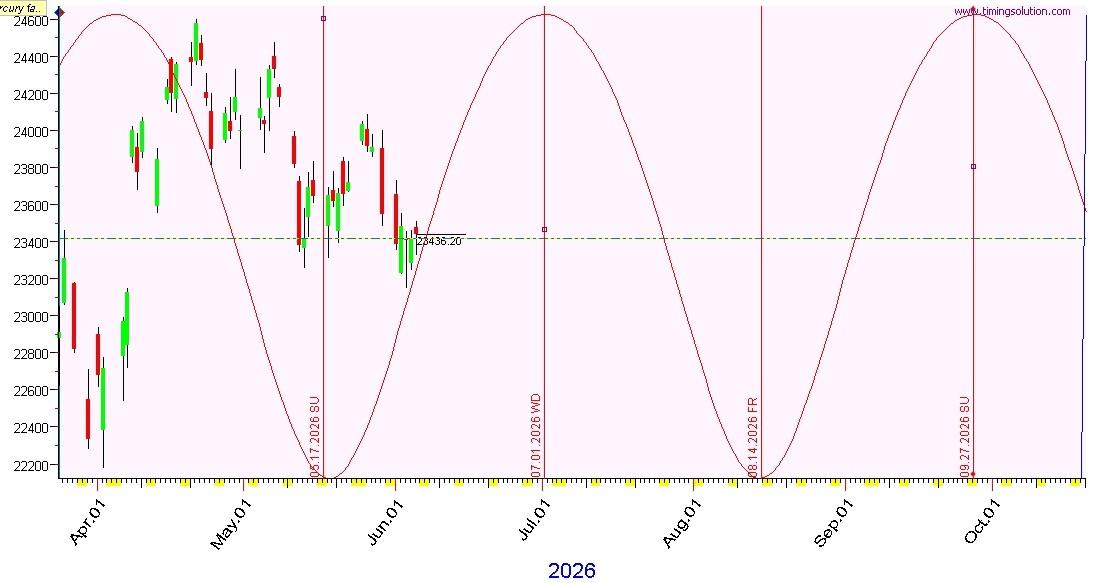
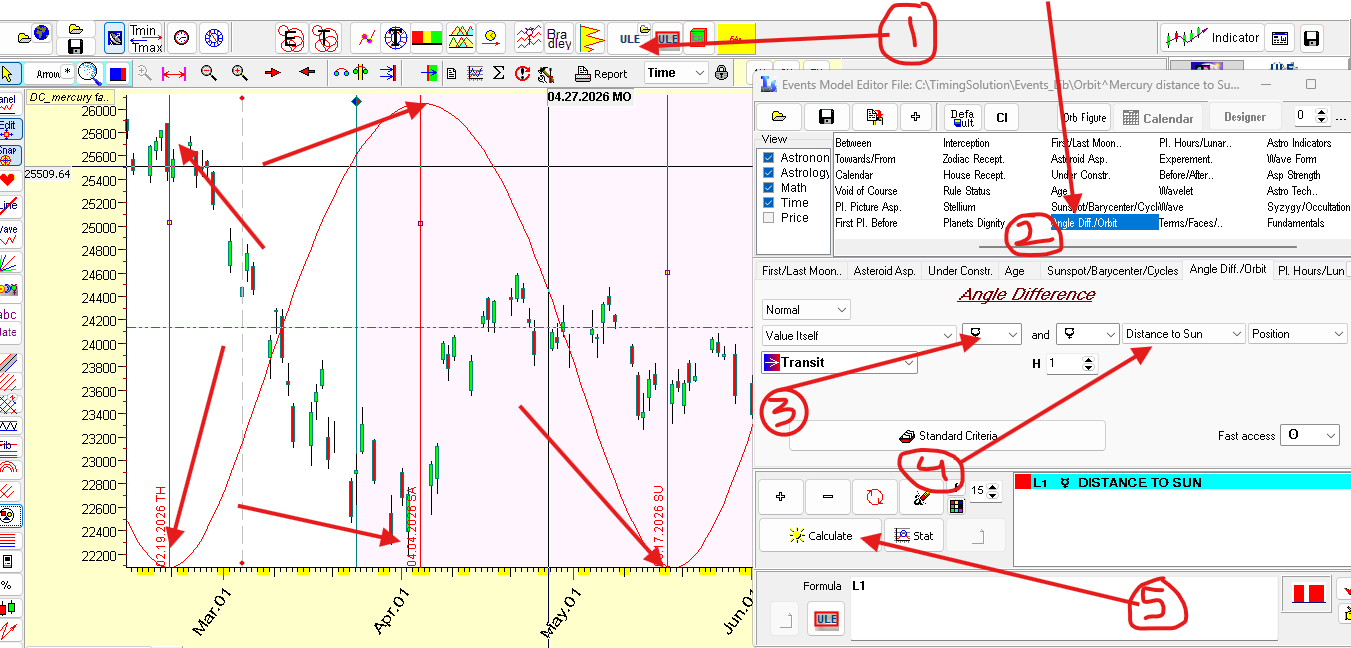
most of the time Nifty tend to change its direction when mercury reaches farthest to sun, check screenshot attached to do same in TS
-
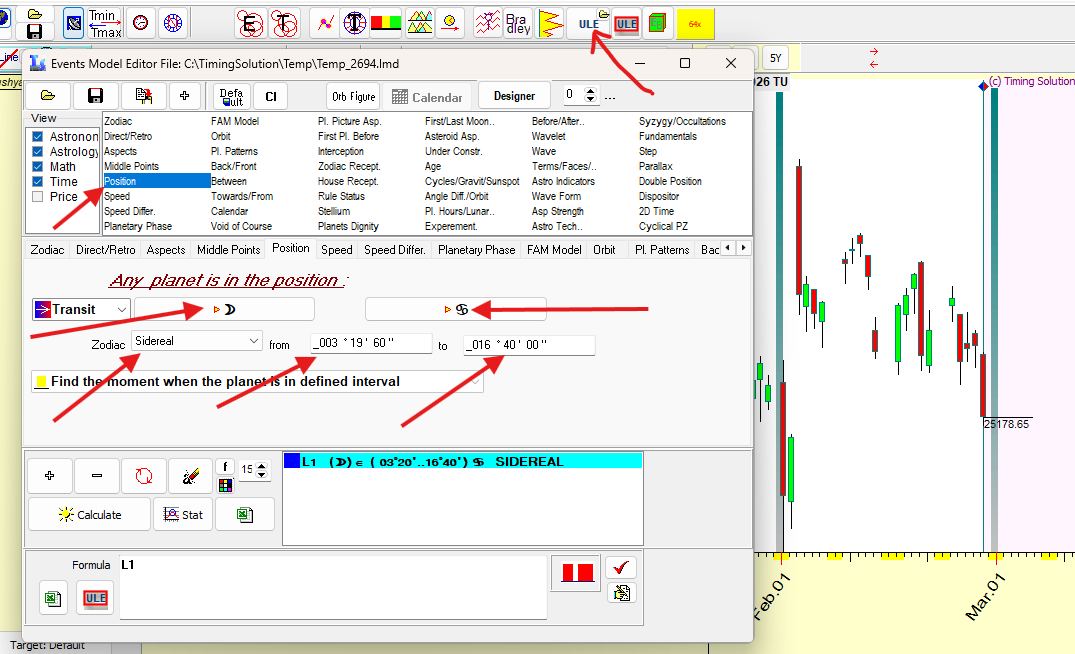
Come across this " https://www.youtube.com/watch?v=F0V-P-uLF7A " video on Pushya nakshtra as per video nifty gives reversal around this time. Pushya nakshtra is when Moon is in Cancer from 3° 20' to 16° 40' below are the step to use this on TS. Use ULE to create as below SS
-
For me also TI menu locked
-
⭐ ajeet reacted to a post in a topic:
Timingsolution & Nifty Updates - 3
-
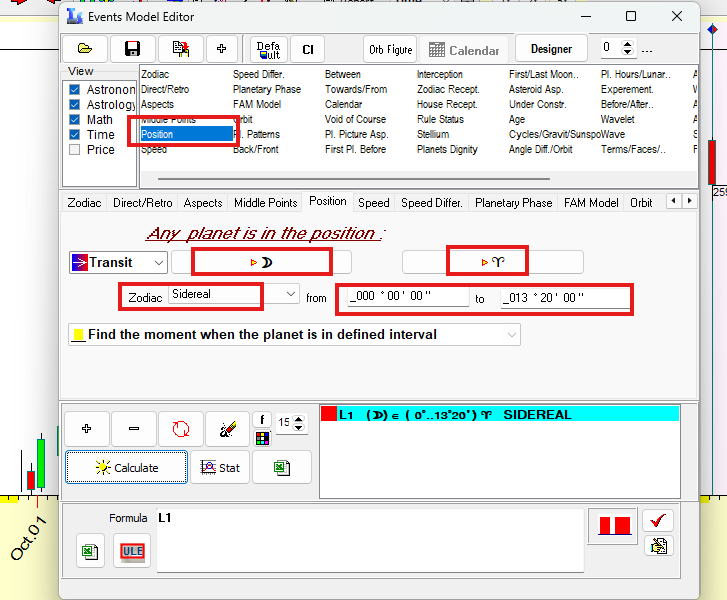
For users using TS for astrology see the attached screenshot for selecting "Ashwini" Nakshatra timings in TS, it is when Moon passes from ARIES 0 degrees to 13'20" Degrees. Similarly You can calculate for remaining 26. you can get other nakshatra degrees on google. Make sure to choose Viewing location "Bombay"
-
I checked for me also coming 13 for Moon - 1/27
-
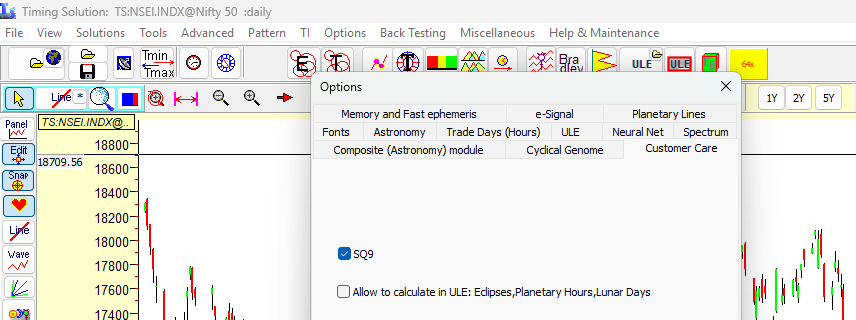
Hi sunny_16977, In options Menu go to Timing Solution options-->> Customer care And enable SQ9. After this in tools menu square of nine is available.
-
Hi sradia, Its working for me