

⤴️-Paid Ad- Check advertising disclaimer here. Add your banner here.🔥
All Activity
- Today
-

HFMarkets (hfm.com): Market analysis services.
AllForexnews replied to AllForexnews's topic in Fundamental Analysis
Date: 17th August 2026. Weak Dollar Triggers New Trends, But What Risks Remain? The US Dollar declines for a second consecutive day reaching a key support level for the currency. Expectations that the Federal Reserve will pause for the upcoming months are driving the Dollar lower. At the same time, Gold and the stock market continue to gain bullish momentum and reach previous highs. However, economists are paying close attention to bond yields, which continue to remain at a significant high and oil still trades above $80 per barrel. Over the weekend, Israel has attacked Iran’s proxy in Lebanon and Trump will soon announce the “economic plan” for Iran. While oil prices remain above $80 and US bond yields remain high, the risk of a quick sudden decline is still elevated. Historic Oil Disruptions US Dollar Weakens To Key Levels The US Dollar is the worst-performing currency of the day despite higher oil prices and higher bond yields. The decline is driven by investors pricing in no rate hike in September or October. A prolonged pause has become likely for the upcoming 2 months due to a slightly weaker consumer inflation and considerably lower producer inflation. However, investors should keep in mind that the Dollar index is trading at a key support level at 99.25. This level was tested on July 31st and August 7th. However, the price is not forming a descending triangle pattern but rather a range bound condition. This means that buyers continue to hold strength at times. On the other hand, as the asset continues to retest the support level, the level may weaken and prompt a breakout. Even though the Dollar is trading clearly lower, investors should be cautious of high oil prices and bond yields which normally push the price higher. The best performing currencies of the day so far are the Australian Dollar, New Zealand Dollar and Swiss Franc. NASDAQ Rises But Risk Remain The NASDAQ moved higher, but not at the same pace as the decline seen in July. A neutral Federal Reserve is driving the bullish impulse wave. However, the fact that the Dollar is declining but yields are rising indicates key concerns for stocks. Investors fear the huge government borrowing, that inflation will remain high for years and that hikes will return later in the year. Analysts advise that the AI trend will remain bumpy and that traders should be cautious of the above triggering a sudden decline. The key resistance level stands at $30,750, but NVIDIA’s earnings towards the end of the month will also influence the long-term price movement. This week, the main earnings report release will come from Walmart which is the 12th most influential stock for the NASDAQ. Walmart stocks rose 3.90% over the past week. Gold Turns Bullish In The Short-term The key factors for Gold are inflation and the Middle East. The US plans to hit Iran's economy hard, with President Donald Trump saying he doesn't care whether the conflict ends before the November US midterm elections. Scott Bessent also advises the move will hit Iran hard and will be the harshest ever seen. If the move keeps oil prices higher for longer, Gold may come under pressure again. HFM - Gold 30-Minute Chart The 30-minute and 1-hour signals are currently both “Strong Buy” according to moving averages. Gold also broke above the previous $4,380 resistance, while remaining above its short-term EMA structure. If the price rises above $4,406.00, which is the level where the current impulse wave surpasses 65% of the previous retracement, bullish signals will strengthen. For bullish signals to be valid, traders will also be monitoring whether the Dollar remains closer to 99.00. Bond yields will also need to avoid rebounding during the day. Key Takeaways: The US Dollar falls for a second day as markets increasingly price in a Fed pause. The US Dollar Index is testing key support near 99.25. Gold and the NASDAQ remain bullish in the short-term, supported by a weaker Dollar and reduced expectations for rate hikes. High US bond yields and oil prices above $80 remain major risks and could trigger sudden reversals across markets. Middle East tensions and Trump’s upcoming economic measures against Iran could keep oil and inflation risks elevated. NVIDIA and Walmart earnings remain a key catalyst for the NASDAQ. Always trade with strict risk management. Your capital is the single most important aspect of your trading business. Please note that times displayed based on local time zone and are from time of writing this report. Click HERE to access the full HFM Economic calendar. Want to learn to trade and analyse the markets? Join our webinars and get analysis and trading ideas combined with better understanding of how markets work. Click HERE to register for FREE! Click HERE to READ more Market news. Michalis Efthymiou HFMarkets Disclaimer: This material is provided as a general marketing communication for information purposes only and does not constitute an independent investment research. Nothing in this communication contains, or should be considered as containing, an investment advice or an investment recommendation or a solicitation for the purpose of buying or selling of any financial instrument. All information provided is gathered from reputable sources and any information containing an indication of past performance is not a guarantee or reliable indicator of future performance. Users acknowledge that any investment in Leveraged Products is characterized by a certain degree of uncertainty and that any investment of this nature involves a high level of risk for which the users are solely responsible and liable. We assume no liability for any loss arising from any investment made based on the information provided in this communication. This communication must not be reproduced or further distributed without our prior written permission. -
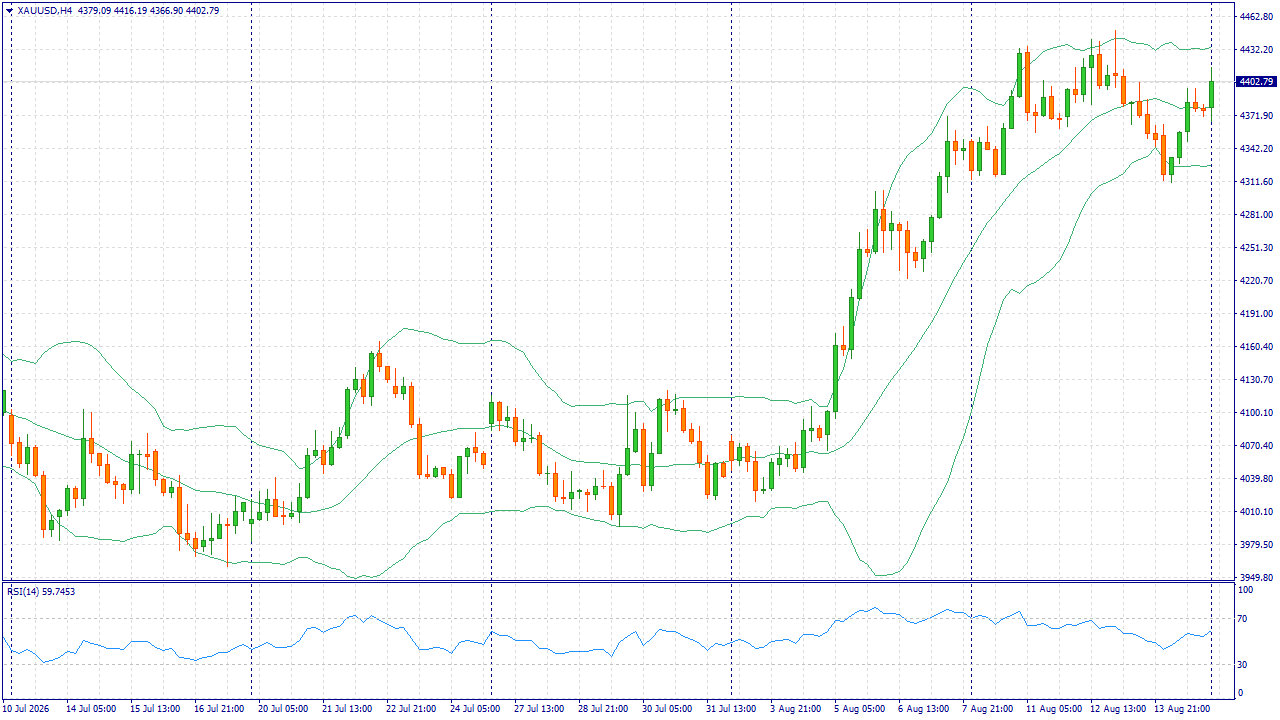
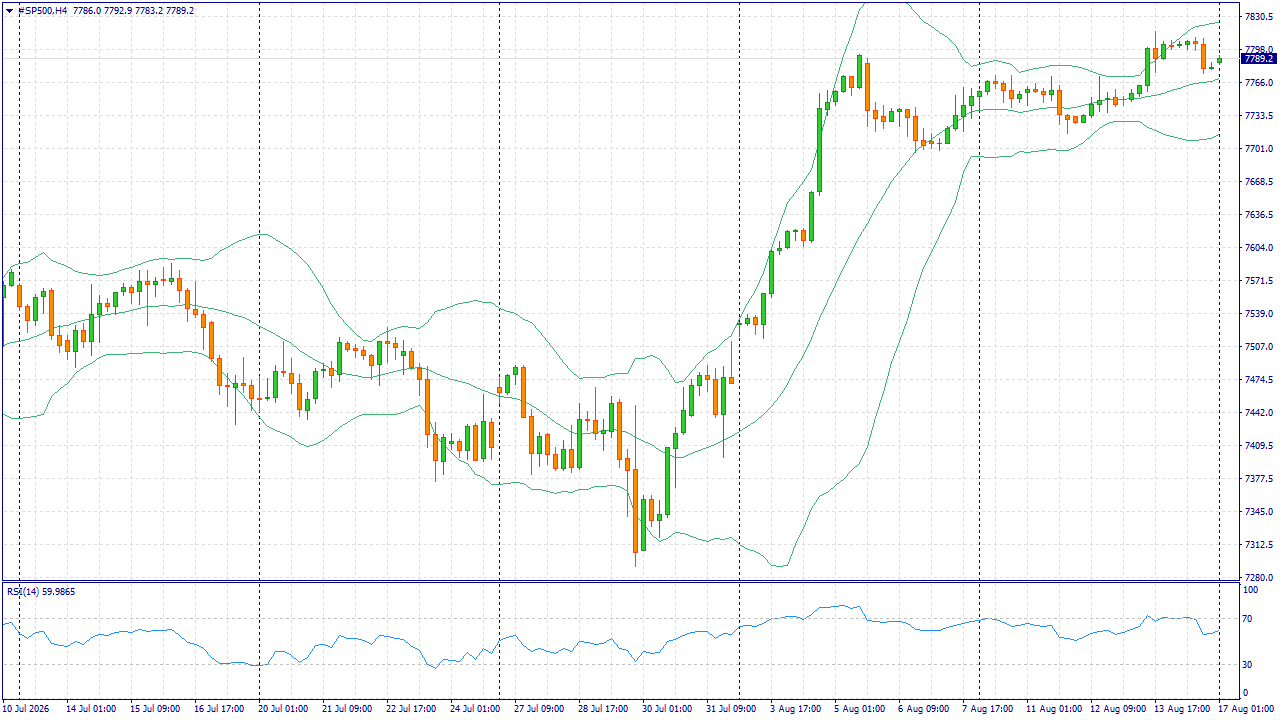
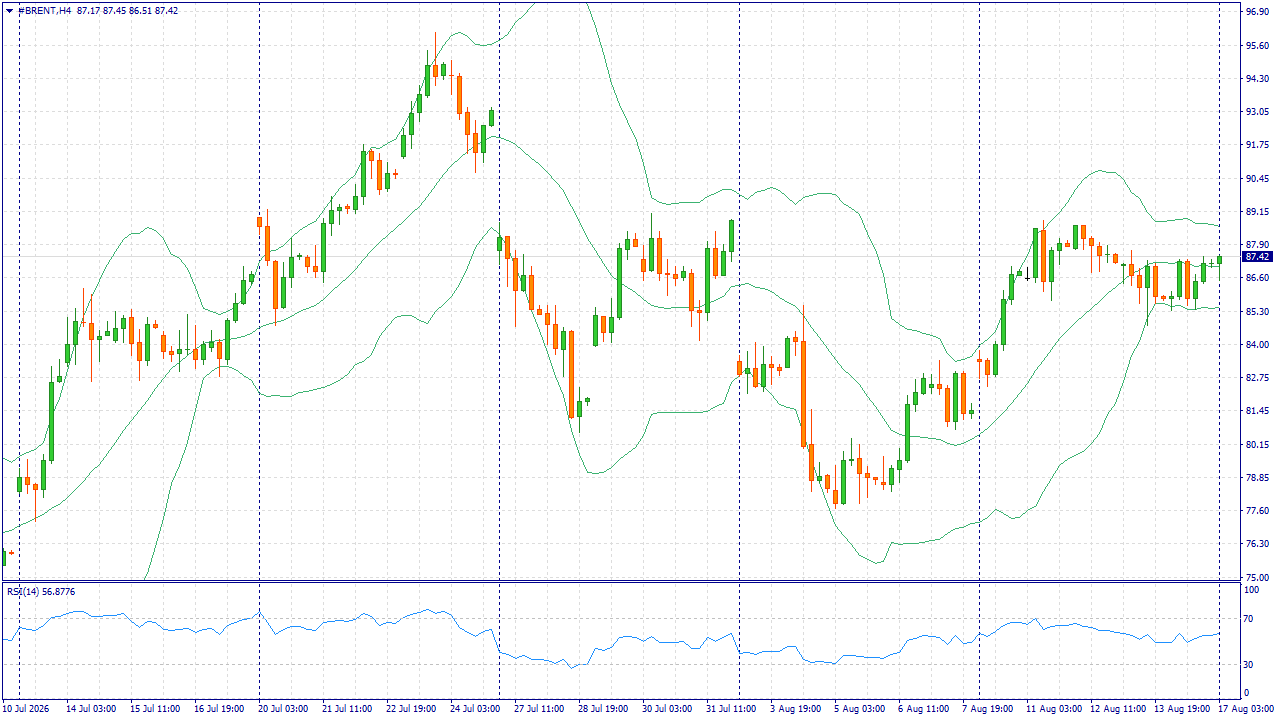
 Weekly overview: XAUUSD, #SP500, #BRENT | 21 August 2026 XAUUSD: BUY 4390.00, SL 4360.00, TP 4462.50 Exclusively for our readers — get $10 to start trading with no deposit required! Register, complete verification, and enter the promo code INDOINVEST10 in your Client Area. This is a limited offer: the bonus is available to the first 100 participants only. Gold starts the week supported by a weaker US dollar and reduced expectations of a Federal Reserve rate hike in September. Softer US inflation and retail sales data are easing monetary policy pressure, while tensions in the Middle East continue to support demand for defensive assets. At the same time, XAUUSD has already posted a significant advance, increasing the risk of profit-taking. However, central bank demand and persistent geopolitical uncertainty continue to support the metal. As long as Federal Reserve expectations remain softer, the base-case scenario allows for a moderate continuation of gold’s advance. Trading idea: BUY 4390.00, SL 4360.00, TP 4462.50 #SP500: BUY 7790, SL 7730, TP 7930 #SP500 enters the week near record levels, with the reduced probability of a Federal Reserve rate hike in September remaining the main positive factor. A strong earnings season also provides support, as most companies in the index have exceeded profit expectations, helping to sustain investor interest in equities. Risks are linked to elevated US Treasury yields and high oil prices, which could intensify inflation concerns. This week, the market will also assess the Federal Reserve minutes and earnings reports from major retailers. As long as the corporate backdrop remains resilient and interest rate expectations stay softer, the base-case scenario supports further gains in #SP500. Trading idea: BUY 7790, SL 7730, TP 7930 #BRENT: BUY 88.60, SL 86.60, TP 93.60 Brent starts the week after a strong advance, with the risk of supply disruptions through the Strait of Hormuz remaining the main driver. Shipping activity in the region has declined noticeably, while the lack of progress in US-Iran negotiations is preserving the geopolitical premium and limiting the scope for a sustained decline in oil prices. The upside is constrained by expectations of higher global supply and the possibility of shipping flows normalizing. However, over the current weekly horizon, the immediate risk to supply still outweighs medium-term pressure. If the situation around the Strait of Hormuz does not improve materially, the fundamental backdrop should continue to support Brent. Trading idea: BUY 88.60, SL 86.60, TP 93.60
-
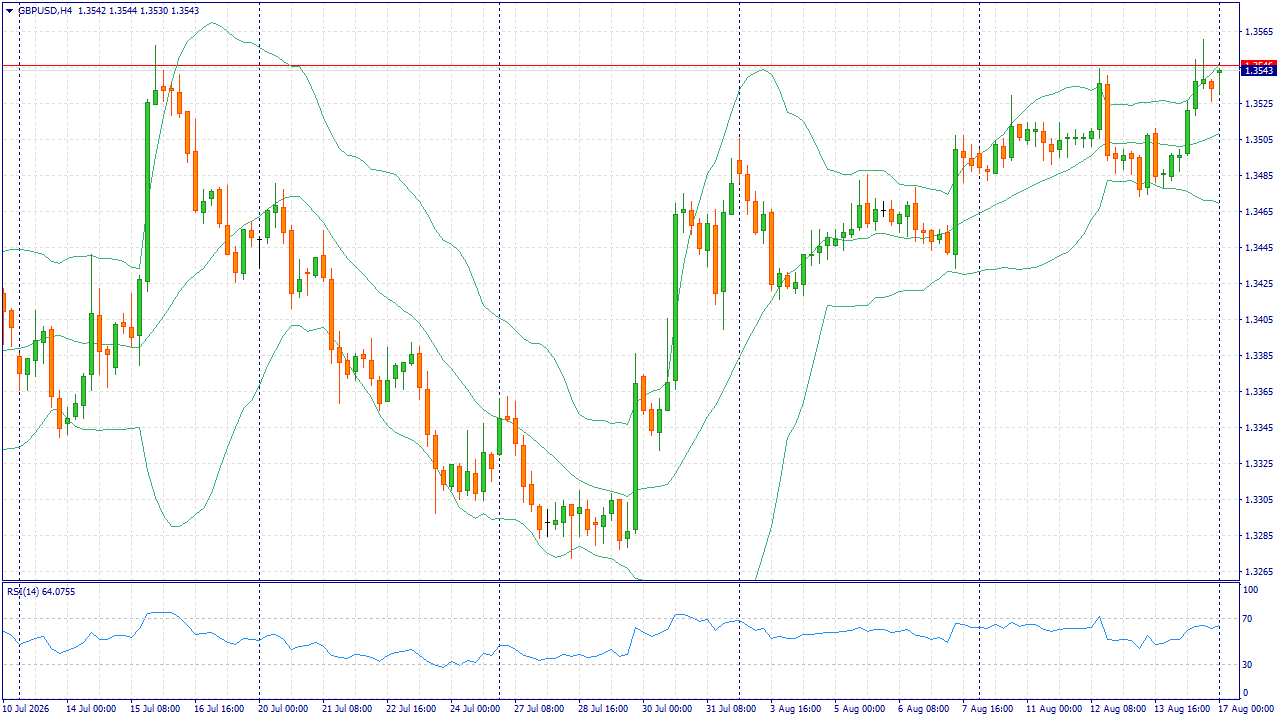
 Market Fundamental Analysis for August 17, 2026 GBPUSD GBPUSD: Exclusively for our readers — get $10 to start trading with no deposit required! Register, complete verification, and enter the promo code INDOINVEST10 in your Client Area. This is a limited offer: the bonus is available to the first 100 participants only. The pound enters Monday with support from the latest UK economic data. June GDP grew more strongly than expected, while previously released business activity indicators pointed to an improvement in the services sector. This reduces concerns about a sharp slowdown in the UK economy and allows the market to maintain a more resilient assessment of the British currency’s outlook. At the same time, the US dollar lost some support after an unexpected decline in US retail sales and more moderate inflation readings. The probability of a Federal Reserve rate hike in September has fallen noticeably, while UK short-term interest rates remain elevated. For GBPUSD, this combination reduces pressure from the interest rate differential and supports demand for the pound. The main constraint is the approach of important UK inflation and labor market data, which could change expectations for Bank of England policy. The upside potential therefore does not appear one-sided. Nevertheless, there is currently no strong local factor weighing on the pound, while the softer US dollar impulse coincides with resilience in the UK economy. If these conditions persist, the bias remains toward a moderate rise in GBPUSD. Trading idea: BUY 1.3540, SL 1.3505, TP 1.3620
- Yesterday
-
 Najai joined the community
 -
 wes joined the community
 -
 koar joined the community
 -
 Ferreira joined the community
 -
 tgfedragr joined the community
 - Last week
-
Welcome to Indo-Investasi.com. Please feel free to browse around and get to know the others. If you have any questions please don't hesitate to ask.
-
 Myholliday joined the community
 -
AI Drives #NQ100 Higher Again: NVIDIA and Micron Lead the Sector The U.S. technology sector received fresh support from artificial intelligence-related companies. On August 12, the Nasdaq gained around 0.5%, although the index remains approximately 0.4% below last Friday’s closing level since the beginning of the current week. At the same time, the Nasdaq rose 5.2% last week, highlighting continued strong interest in the technology sector. NVIDIA and Micron were at the center of attention. NVIDIA (#NVDIA) shares rose by around 3%, while Micron (#Micron) gained nearly 5%. Investors are increasing their positions in chipmakers again amid sustained demand for data-center equipment and artificial intelligence infrastructure. Key Drivers of Technology Sector Growth: AI demand remains strong. Major technology companies continue to increase spending on data centers and computing capacity. This supports expectations for further growth in NVIDIA processor sales and demand for Micron server memory. Investors are returning to semiconductor stocks. After the recent correction, chipmakers are once again attracting buyers. The market is becoming more selective, but companies directly benefiting from the expansion of AI infrastructure remain among investors’ favorites. Lower pressure from the Fed. Softer U.S. inflation data reduced the likelihood of a rate hike in September. Lower rate expectations traditionally support high-valued technology stocks and increase demand for #NQ100. According to FreshForex analysts, the base-case scenario for #NQ100 remains further growth. Demand for AI infrastructure remains strong, while the lower probability of another Fed rate hike provides additional support for the technology sector. If NVIDIA and Micron continue to strengthen, the index could maintain its upward momentum and test new local highs. Our trading platform offers 250+ instruments, including CFDs on stocks, indices, and cryptocurrencies. Follow market trends and seize trading opportunities. Exclusively for our readers — get $10 to start trading with no deposit required! Register, complete verification, and enter the promo code INDOINVEST10 in your Client Area. This is a limited offer: the bonus is available to the first 100 participants only.
-
HFMarkets (hfm.com): Market analysis services.
AllForexnews replied to AllForexnews's topic in Fundamental Analysis
Date: 14th August 2026. PPI Boosts Market Sentiment, Pushing Stocks Higher. The latest inflation data from Wednesday saw the possibility of an interest rate hike fall slightly. However, an even more positive development for the stock market is the latest producer price index. The first reaction to the release of the Producer Price Index was minimal, but volatility soon kicked in as the US session opened. The Producer Price Index did not rise at all in July, whereas analysts were expecting a moderate rise of 0.2%. As a result, producer inflation fell from 5.5% to 4.7%, significantly lower than market expectations. The PPI YoY continues to read higher than the Federal Reserve’s target but has now seen three consecutive months of declines. In addition to this, the Core Producer Price Index rose 0.2%, lower than the 0.3% consensus. The lower producer inflation, along with the decline in oil prices is supportive of the global stock market. Crude oil prices have fallen more than 2% over the past 24 hours and any further decline could indicate a prolonged pause by the Federal Reserve. The possibility of an interest rate hike in September continues to fall, from 40% on Wednesday to 32% this morning. As a result, sentiment towards the stock market could rise further. However, analysts continue to advise that up-and-down volatility in the medium to longer term is likely to continue due to the AI trend, high earnings, and fear over AI-spending. Cisco and Applied Materials Earnings Report Cisco, which made its quarterly earnings report public on Wednesday, is the 15th most influential stock in the NASDAQ. Applied Materials Inc. is the 16th most influential and together they make up 2.10% of the NASDAQ. Cisco’s latest earnings report was strong, with fourth-quarter revenue rising 18% year-on- year to $17.3 billion, beating the high end of its guidance, while non-GAAP EPS increased 23% to $1.22. Cisco also reported a 35% increase in total product orders, with networking orders up 40%. Looking ahead, the company expects $72.2–$73.4 billion in revenue, suggesting continued growth. However, due to AI spending and the slightly lower gross margin are triggering a sell-off for the time being. Applied Material stock has fallen 5% after the company announced its quarterly report, weakening the bullish momentum of the NASDAQ. Applied Material Inc. is experiencing a similar reaction to most stocks within this earnings season. The company saw both earnings and revenue beat expectations, but the stock declines suggest that the results were simply not high enough. PPI Report Boost The NASDAQ The NASDAQ rose more than 1.30% in response to the Producer Price Index reading considerably lower than expectations. The inflation rate decline did little to change analysts’ views on upcoming interest rate decisions. However, Thursday’s PPI report was seen as particularly positive for the stock market. The price of the NASDAQ is now trading above key moving averages on most timeframes and is yet to become overbought. In addition to this, the VIX continues to trade lower, indicating strong investor sentiment for now. However, the price this morning is trading slightly below the VWAP. Therefore, buy signals will strengthen once bullish momentum is regained. Lastly, 76% of the NASDAQ’s most influential companies rose on Thursday, providing a further bullish indication from component analysis. HFM - NASDAQ 30-Minute Chart Key Takeaway Points: Inflation is cooling: July PPI was flat, lowering September Fed hike odds from 40% to 32%, which is bullish for stocks. Earnings are strong, but expectations are higher: Cisco and Applied Materials beat estimates, yet both sold off as investors demanded more. NASDAQ remains bullish: It jumped 1.3%+, trades above key moving averages, and remains below overbought levels. Momentum needs confirmation: The VIX is falling, but NASDAQ is slightly below VWAP, so short-term volatility remains likely. Always trade with strict risk management. Your capital is the single most important aspect of your trading business. Please note that times displayed based on local time zone and are from time of writing this report. Click HERE to access the full HFM Economic calendar. Want to learn to trade and analyse the markets? Join our webinars and get analysis and trading ideas combined with better understanding of how markets work. Click HERE to register for FREE! Click HERE to READ more Market news. Michalis Efthymiou HFMarkets Disclaimer: This material is provided as a general marketing communication for information purposes only and does not constitute an independent investment research. Nothing in this communication contains, or should be considered as containing, an investment advice or an investment recommendation or a solicitation for the purpose of buying or selling of any financial instrument. All information provided is gathered from reputable sources and any information containing an indication of past performance is not a guarantee or reliable indicator of future performance. Users acknowledge that any investment in Leveraged Products is characterized by a certain degree of uncertainty and that any investment of this nature involves a high level of risk for which the users are solely responsible and liable. We assume no liability for any loss arising from any investment made based on the information provided in this communication. This communication must not be reproduced or further distributed without our prior written permission. -

Market Technical Analysis by RoboForex
RBFX Support replied to RBFX Support's topic in Technical Analysis
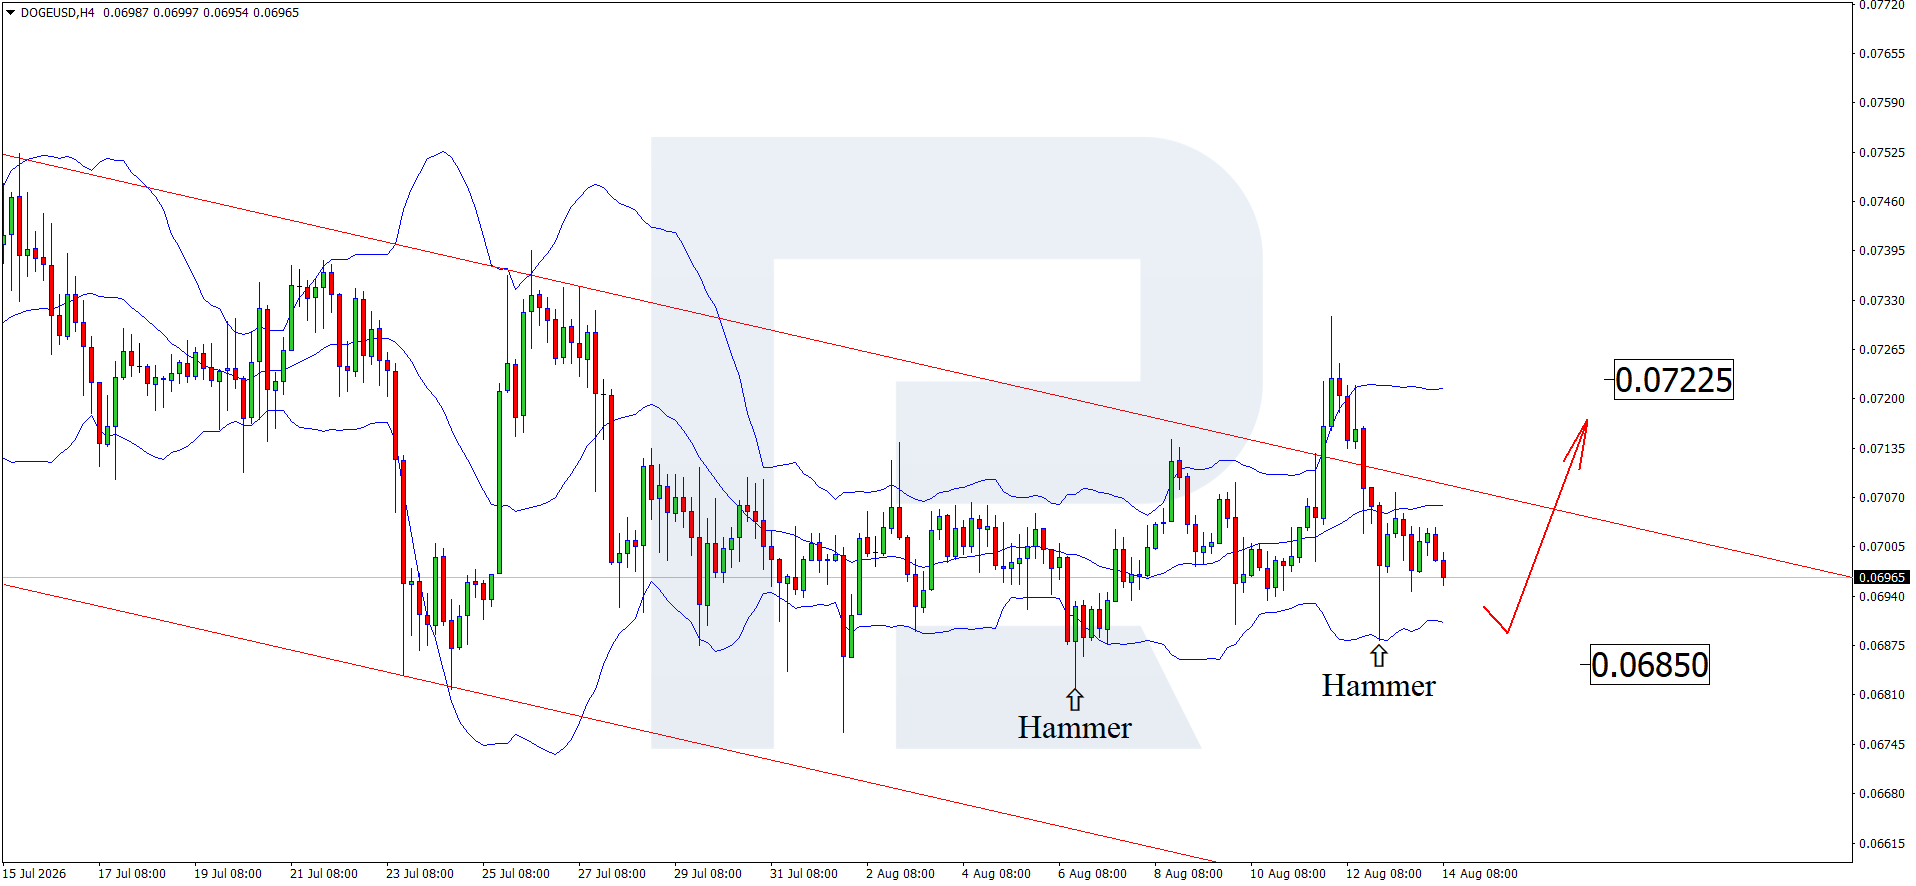
ÐOGE Pay is a game-changer: Dogecoin could surprise the market Awaiting a driver for further movement, DOGEUSD is correcting today, with the price currently at 0.06967. Technical outlook On the H4 chart, DOGEUSD formed a Hammer reversal pattern near the lower Bollinger Band. At this stage, prices could form an upward wave as the pattern signal plays out, with the correction target at the 0.07225 resistance level. Dogecoin remains sensitive to broader cryptocurrency market sentiment. Read more - DOGEUSD Forecast Attention! Forecasts presented in this section only reflect the author’s private opinion and should not be considered as guidance for trading. RoboForex bears no responsibility for trading results based on trading recommendations described in these analytical reviews. Sincerely, The RoboForex Team
-
roboforex Market Fundamental Analysis by RoboForex
RBFX Support replied to RBFX Support's topic in Fundamental Analysis
US Tech forecast: index poised to reach a new all-time high The US Tech index has broken above the resistance level and could set a new all-time high. The US Tech forecast for next week is positive. US Tech forecast: key takeaways Recent data: US CPI rose by 3.4% year-on-year in July Market impact: the current data is positive for the technology sector Fundamental analysis The US inflation data is, overall, a moderately positive signal for the US Tech index and the US stock market. Annual consumer price inflation slowed from 3.5% to 3.4% in July. At the same time, monthly price growth was only 0.1%, while core inflation, excluding food and energy, rose by 0.2% month-on-month and slowed to 2.5% year-on-year from 2.6% previously. The impact on the US Tech index is broadly positive, as the technology sector is particularly sensitive to interest rate expectations. RoboForex Market Analysis & Forex Forecasts Attention! Forecasts presented in this section only reflect the author’s private opinion and should not be considered as guidance for trading. RoboForex bears no responsibility for trading results based on trading recommendations described in these analytical reviews. Sincerely, The RoboForex Team -
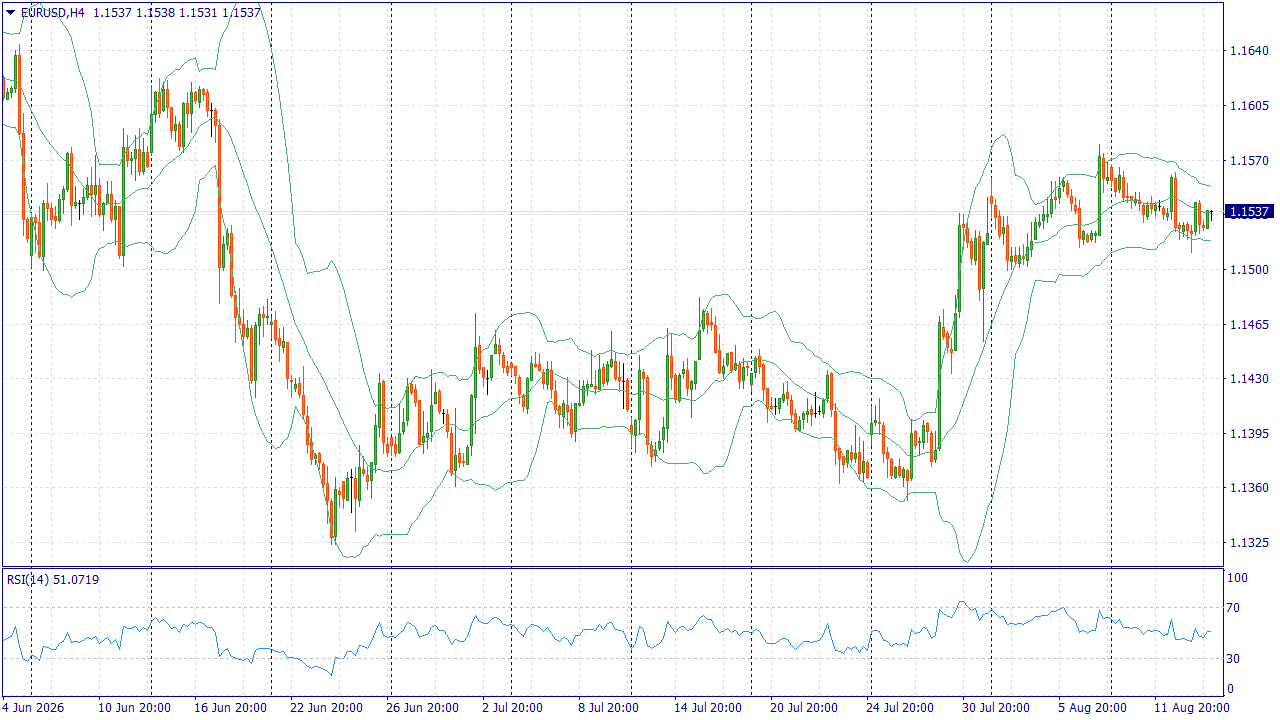
Market Fundamental Analysis for August 14, 2026 EURUSD Event to watch today: 15:30 EET. USD – Consumer Price Index EURUSD: Exclusively for our readers — get $10 to start trading with no deposit required! Register, complete verification, and enter the promo code INDOINVEST10 in your Client Area. This is a limited offer: the bonus is available to the first 100 participants only. The euro is supported by firmer expectations regarding ECB policy. A recent survey of economists shows that most expect another rate hike in September, as eurozone inflation remains above target and the economy grew more strongly than expected in the second quarter. This combination limits the case for a rapid shift toward a softer policy stance and supports the European currency. At the same time, the US dollar has lost momentum following July producer price data, which showed no monthly increase despite market expectations for a rise. Combined with moderate consumer inflation, this reduced the probability of a Federal Reserve rate hike in September to around 35%. Lower rate expectations reduce the dollar’s interest rate advantage and create conditions for a recovery in EURUSD. The main risk to this scenario comes from today’s US retail sales data. A strong reading could revive demand for the dollar and partly change market expectations for Federal Reserve policy. Until the release, however, the euro retains an advantage due to the combination of firmer ECB expectations and reduced expectations for a US rate hike. If this backdrop persists, the base-case scenario supports further gains in EURUSD. Trading idea: BUY 1.1535, SL 1.1510, TP 1.1590
-
celestial events do leave their footprint (impact) irrespective of whether it is visible in a region or not.
-
Yes Kesk, may be need to find past data of only events seen in india , partial or total and then analyze statistical significance of days around actual event
-
Market Technical Analysis by RoboForex
RBFX Support replied to RBFX Support's topic in Technical Analysis
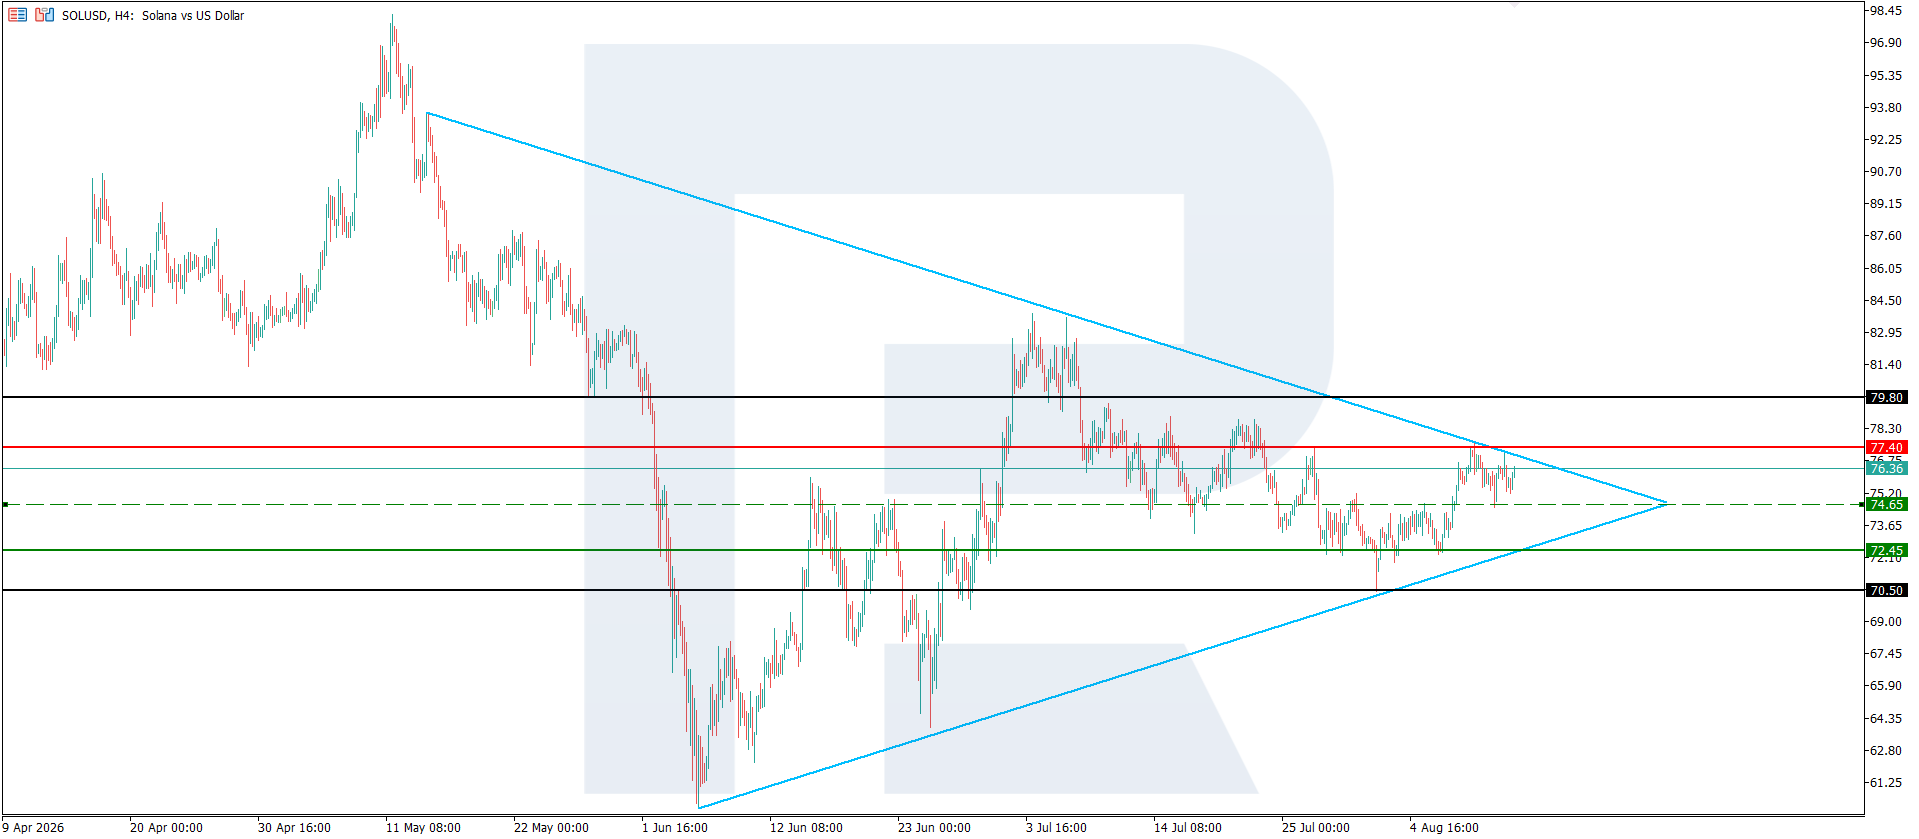
Solana begins partnership with MoneyGram The Solana price is poised to resume growth, currently standing at 76.33. Technical outlook On the D1 chart, SOLUSD has formed a Triangle chart pattern. A breakout in line with the uptrend is the most likely scenario. Lows have been rising consistently since late May 2026. Consolidation above 74.65 would provide an additional bullish signal. SOLUSD remains in an uptrend. SOLUSD technical analysis suggests a rise towards the 79.80 resistance level. Read more - SOLUSD Forecast Attention! Forecasts presented in this section only reflect the author’s private opinion and should not be considered as guidance for trading. RoboForex bears no responsibility for trading results based on trading recommendations described in these analytical reviews. Sincerely, The RoboForex Team
-
roboforex Market Fundamental Analysis by RoboForex
RBFX Support replied to RBFX Support's topic in Fundamental Analysis
Gold (XAUUSD) on the rise: US inflation data drives gains Gold (XAUUSD) prices rose to 4,440 USD, with slowing US inflation weighing on the dollar. XAUUSD forecast: key takeaways US CPI rose by 3.4% year-on-year Slowing US inflation supported gold XAUUSD forecast for 13 August 2026: 4,515 Fundamental analysis Gold (XAUUSD) reached 4,440 USD per ounce on Wednesday following the release of inflation data. Annual US inflation slowed from 3.5% to 3.4%, fully matching the forecast. Core inflation also declined to 2.5% year-on-year from 2.6%, which is a more important signal for the Federal Reserve. The likelihood of a Federal Reserve rate hike in September fell to around 40% following the CPI data, from 46% before the release. RoboForex Market Analysis & Forex Forecasts Attention! Forecasts presented in this section only reflect the author’s private opinion and should not be considered as guidance for trading. RoboForex bears no responsibility for trading results based on trading recommendations described in these analytical reviews. Sincerely, The RoboForex Team -
HFMarkets (hfm.com): Market analysis services.
AllForexnews replied to AllForexnews's topic in Fundamental Analysis
Date: 13th August 2026. US Inflation Falls to 3.4% as Dollar Strengthens and Gold Struggles. US inflation fell from 3.5% to 3.4% in line with analysts’ expectations. The decline at first had a positive impact on Gold and the stock market, but they could not maintain momentum. Even though the decline remains a positive factor for the economy, 3.4% is still seen as a considerably high inflation rate and a weak decline. The stock market and metals experienced volatile trading as buyers and sellers competed for control. However, the US Dollar is emerging as the clear winner as the currency rises to a two-week high. With inflation falling by only 0.1% and oil prices remaining above $83 per barrel, demand for the Dollar remains strong. Currently, the Japanese Yen is the best-performing currency due to a change in stance from the Japanese administration. However, the US Dollar is firmly the second-best-performing currency of the day, and the US Dollar Index is only 0.07% away from reaching 100.00. Gold Struggles for Momentum Despite Lower September Rate-Hike Expectations Due to the inflation rate decline and weak employment data, the possibility of a September rate hike has fallen to 34%. This is considerably lower than in previous weeks. However, the possibility of a rate hike later in the year has not faded. This, along with geopolitical tensions, is resulting in the US Dollar increasing in value and applying further pressure on metals. According to President Trump, the US is changing its tactics to bring Iran to the negotiation table. The US will now increase economic pressure on Iran rather than take military action. The renewed focus on economic measures highlights the ongoing uncertainty surrounding Iran’s position and is also supporting the Dollar. This could continue to influence oil prices, shipping activity, and broader market sentiment. Gold is trading downwards on Thursday after rising to a new two-month high. The price has fallen to form a bearish breakout but has not yet fully formed a trend formation. On smaller timeframes, the price is trading below key moving averages, which indicates downward price movement. However, on larger timeframes, the price remains at a neutral level. The US Dollar Index is trading close to the psychological price of 100.00. If the Dollar rises above this level, Gold may struggle to regain bullish momentum. The key support level for Gold can be seen at $4,359.55. Traders will monitor whether the price rebounds off this level. If the price breaks below this level, bearish signals may potentially strengthen. HFM - Gold 20-Minutes USDJPY - Japan’s Government Supports Faster Rate Hikes Due to Currency Weakness The best-performing currency of the day is the Japanese Yen, as investors price in the change in tone from the Japanese government. In terms of the USDJPY price pattern, the price is forming an ascending triangle pattern, indicating that it is not able to maintain bearish momentum. However, the pattern does not indicate a clear rise either. Japan’s government is reportedly supportive of an earlier Bank of Japan rate hike, potentially as soon as September or October, as policymakers seek to address persistent inflation and weakness in the Japanese Yen. The shift in government support adds pressure on the BOJ to accelerate monetary policy normalisation, particularly as recent data showed Japanese wholesale inflation remaining elevated, with producer prices rising 7.2% year-on-year in July. For financial markets, an earlier rate hike could provide meaningful support to the Yen and increase pressure on USDJPY, particularly given the recent focus on currency intervention. Investors are now likely to pay close attention to upcoming BOJ communication. Analysts continue to advise that if the Bank of Japan is looking to hike only once in 2026, this may not be enough to support the Yen. According to analysts, the BOJ must hike on two occasions to avoid being a victim of the carry trade. For this reason, as mentioned above, the upcoming BOJ communication will be vital for the Yen. HFM - USDJPY 20-Minute Chart Key Takeaways: US inflation fell to 3.4% as expected. However, the modest decline has done little to ease concerns over persistently high inflation. The US Dollar is emerging as the clear winner due to geopolitical tensions. The currency is reaching a two-week high as strong demand continues to pressure Gold and other metals. Gold is struggling to maintain momentum, with $4,359.55 acting as a key support level. The Dollar Index is approaching the psychological 100.00 level, which may further pressure Gold. The Japanese Yen is strengthening on expectations of faster rate hikes due to a supportive tone from the Japanese government. Always trade with strict risk management. Your capital is the single most important aspect of your trading business. Please note that times displayed based on local time zone and are from time of writing this report. Click HERE to access the full HFM Economic calendar. Want to learn to trade and analyse the markets? Join our webinars and get analysis and trading ideas combined with better understanding of how markets work. Click HERE to register for FREE! Click HERE to READ more Market news. Michalis Efthymiou HFMarkets Disclaimer: This material is provided as a general marketing communication for information purposes only and does not constitute an independent investment research. Nothing in this communication contains, or should be considered as containing, an investment advice or an investment recommendation or a solicitation for the purpose of buying or selling of any financial instrument. All information provided is gathered from reputable sources and any information containing an indication of past performance is not a guarantee or reliable indicator of future performance. Users acknowledge that any investment in Leveraged Products is characterized by a certain degree of uncertainty and that any investment of this nature involves a high level of risk for which the users are solely responsible and liable. We assume no liability for any loss arising from any investment made based on the information provided in this communication. This communication must not be reproduced or further distributed without our prior written permission. -
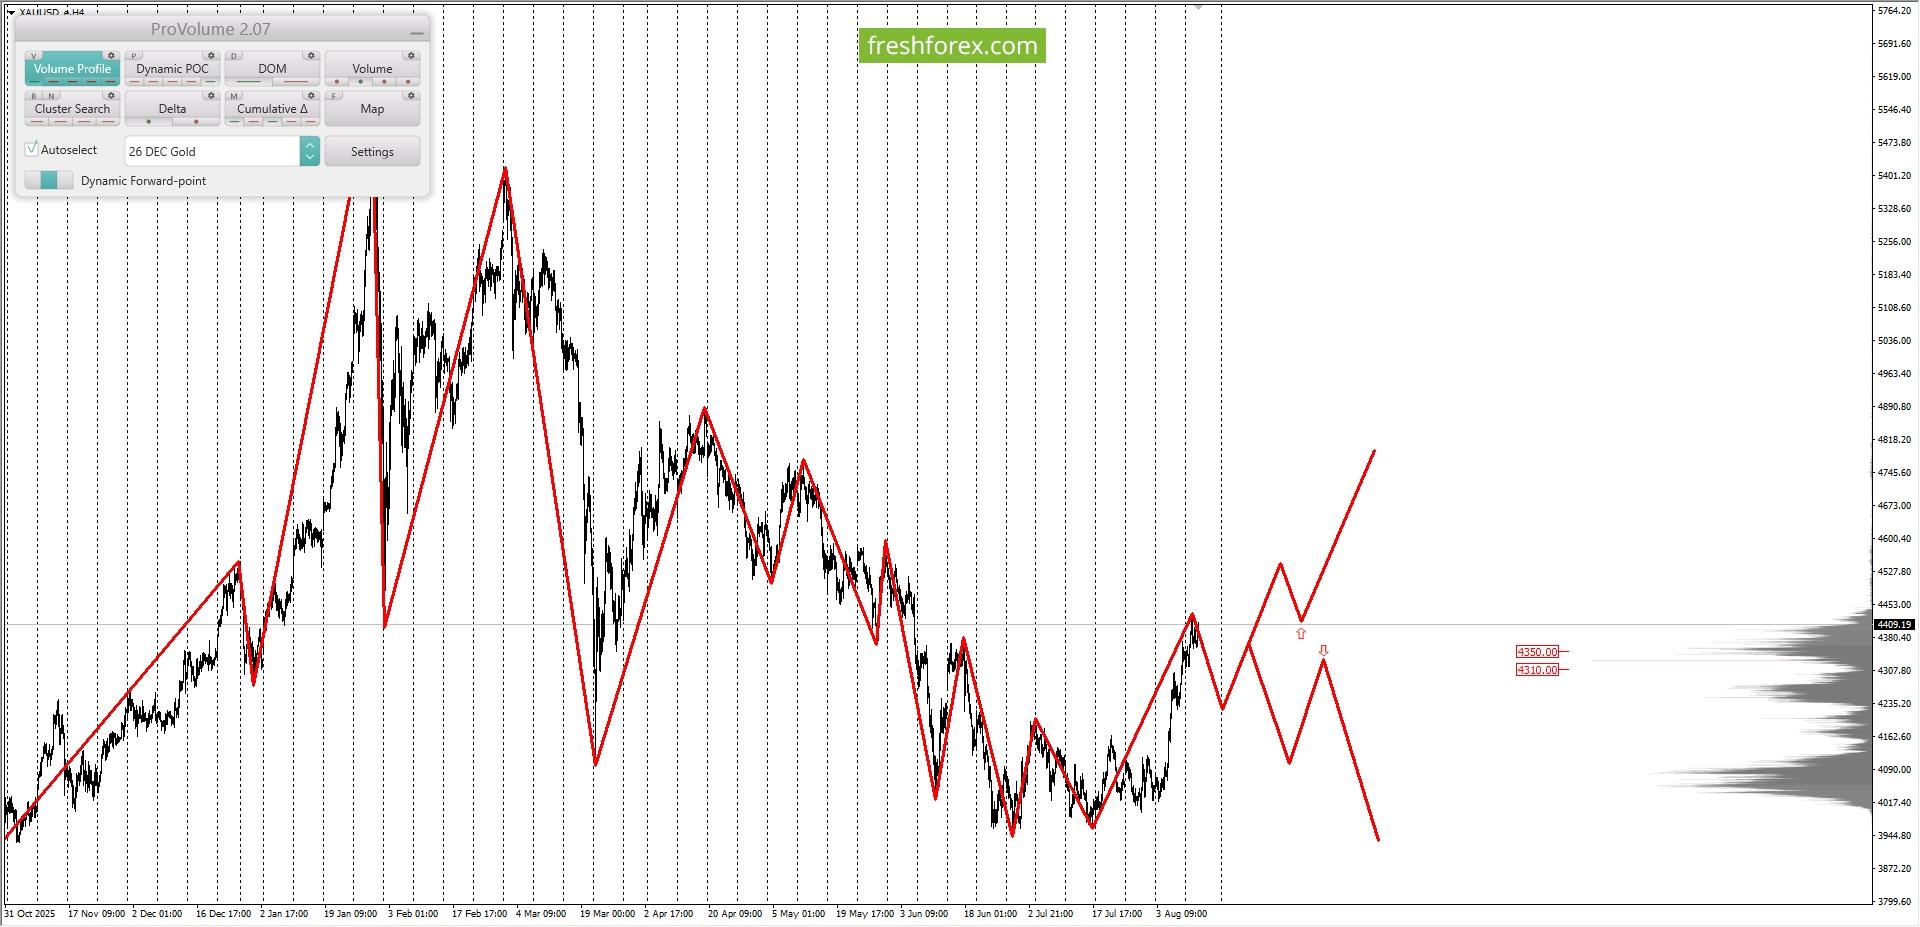
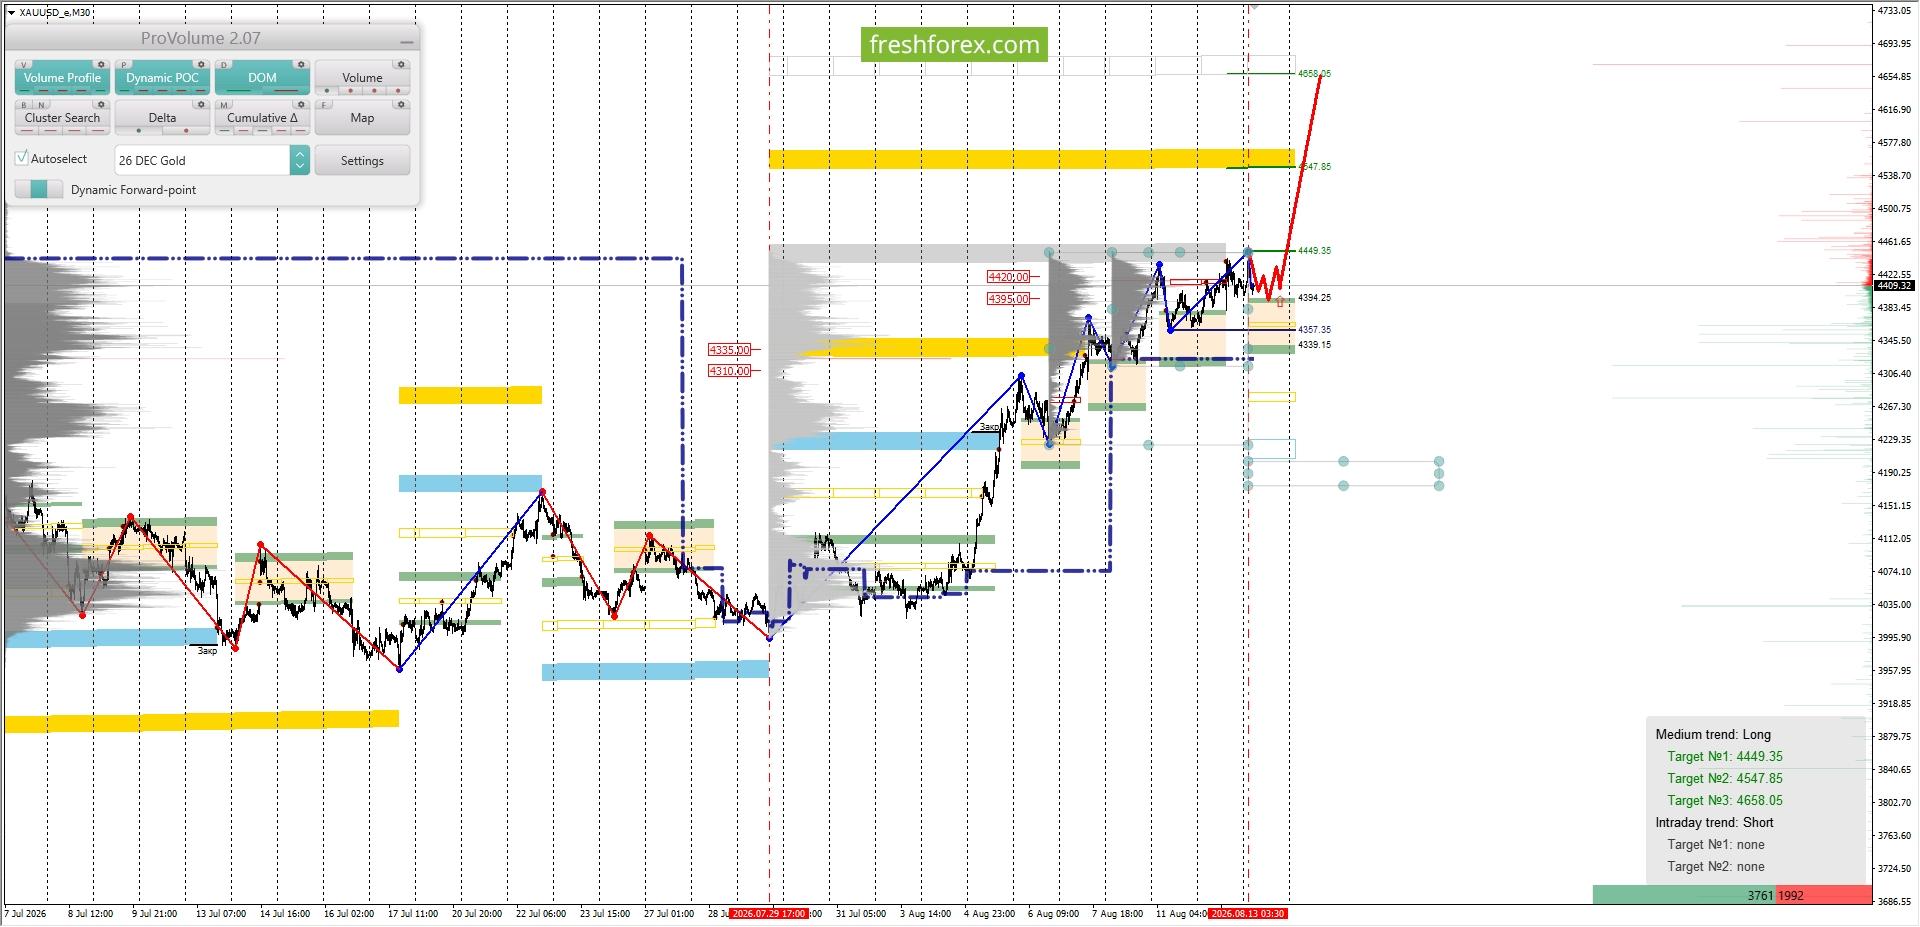
Analysis of margin levels for August 13, 2026 XAUUSD XAUUSD: BUY 4339.15-4394.25, TP1-4449.35, TP2-4658.05. Exclusively for our readers — get $10 to start trading with no deposit required! Register, complete verification, and enter the promo code INDOINVEST10 in your Client Area. This is a limited offer: the bonus is available to the first 100 participants only. Long-term trend: bullish. The largest concentration of volume in the current contract is located within the 4290.00–4330.00 range. At present, trading activity in XAUUSD is taking place above this range, indicating buyer strength. Medium-term trend: bullish. The largest concentration of medium-term volume is located within the 4310.00-4335.00 and 4395.00-4420.00 ranges. At present, trading activity in XAUUSD is taking place above these ranges, indicating buyer strength. From a margin requirements perspective, the favorable buying area is located between the 1/4 and 1/2 zones drawn from the high of 13.08.2026. The upper boundary of the 1/4 zone is 4394.25. The upper boundary of the 1/2 zone is 4339.15. Intraday targets: a renewal of the highs from 13.08.2026 at 4449.35. Medium-term targets: a test of the lower boundary of the GWCZ at 4658.05. Trading recommendation: consider buying from the favorable price range if a reversal pattern forms. Buy: 4339.15–4394.25, Take Profit 1–4449.35, Take Profit 2–4658.05.
-
Santosh, Your post on Eclipse. The nature of them is that, they are visible in some regions/countries while its not seen/observed in others. So in this case, should one consider or not if its not observed in a particular country? I hope/believe since its a celestial event, should be considered whether seen or not.
-
Hi Ali7qe, If you have any idea on how to apply cycles using natal data then little guidance on that will be really helpful. Thanks
-
entries alone are rarely the whole edge. Two traders can take basically the same setup and get completely different results just from sizing, exits and how consistently they follow the plan. A journal makes that pretty obvious after enough trades
-
 Carlos joined the community
 -
roboforex Market Fundamental Analysis by RoboForex
RBFX Support replied to RBFX Support's topic in Fundamental Analysis
USDJPY tests 159.40 and retains upside potential towards 160.90 The USDJPY pair is recovering after the currency intervention and testing the 159.40 resistance level. A breakout above this level could open the way towards 160.90. The rate currently stands at 159.40. USDJPY forecast: key takeaways The USDJPY pair is recovering after the currency intervention and testing the 159.40 resistance level The key macroeconomic event of the day will be the release of the US CPI USDJPY forecast for 12 August 2026: 160.90 Fundamental analysis Fundamental analysis of USDJPY for 12 August 2026 shows that pressure on the yen persists. Over the past two days, the pair has risen towards 159.30–159.45 despite the recent joint currency intervention by the US and Japan. This shows that fundamental demand for the dollar currently remains stronger than the effect of the intervention. At the same time, the domestic backdrop in Japan is gradually becoming more supportive for the yen. The summary of the Bank of Japan’s July meeting, published on 10 August, showed that several board members favour faster rate hikes due to inflation risks. RoboForex Market Analysis & Forex Forecasts Attention! Forecasts presented in this section only reflect the author’s private opinion and should not be considered as guidance for trading. RoboForex bears no responsibility for trading results based on trading recommendations described in these analytical reviews. Sincerely, The RoboForex Team