

⤴️-Paid Ad- Check advertising disclaimer here. Add your banner here.🔥
All Activity
- Today
-

VIP Membership - FREE upgrade for OLD and ACTIVE Members
⭐ nkp9999 replied to MrAdmin's topic in Announcements
Thank you. -
VIP Membership - FREE upgrade for OLD and ACTIVE Members
⭐ nkp9999 replied to MrAdmin's topic in Announcements
Hi, I am not sure if I have a VIP status or not. Please let me know. Thanks -

roboforex Market Fundamental Analysis by RoboForex
RBFX Support replied to RBFX Support's topic in Fundamental Analysis
US Tech rises on optimism in the AI sector US Tech has reached a new all-time high and is now correcting. The current price is 30,682. US Tech forecast: key takeaways The US Services Purchasing Managers Index rose to 58.7 The yield on 30-year US Treasuries rose to 5.44%, the highest level since 2004 Fundamental analysis The combination of two factors — a sharp rise in long-term US Treasury yields and a much stronger-than-expected services business activity index — is creating a primarily negative backdrop for US Tech. This does not point to a deterioration in the US economy. This is particularly important for US Tech. Technology companies are valued to a large extent on the basis of expected cash flows and profits to be generated many years into the future. RoboForex Market Analysis & Forex Forecasts Attention! Forecasts presented in this section only reflect the author’s private opinion and should not be considered as guidance for trading. RoboForex bears no responsibility for trading results based on trading recommendations described in these analytical reviews. Sincerely, The RoboForex Team -
Market Technical Analysis by RoboForex
RBFX Support replied to RBFX Support's topic in Technical Analysis
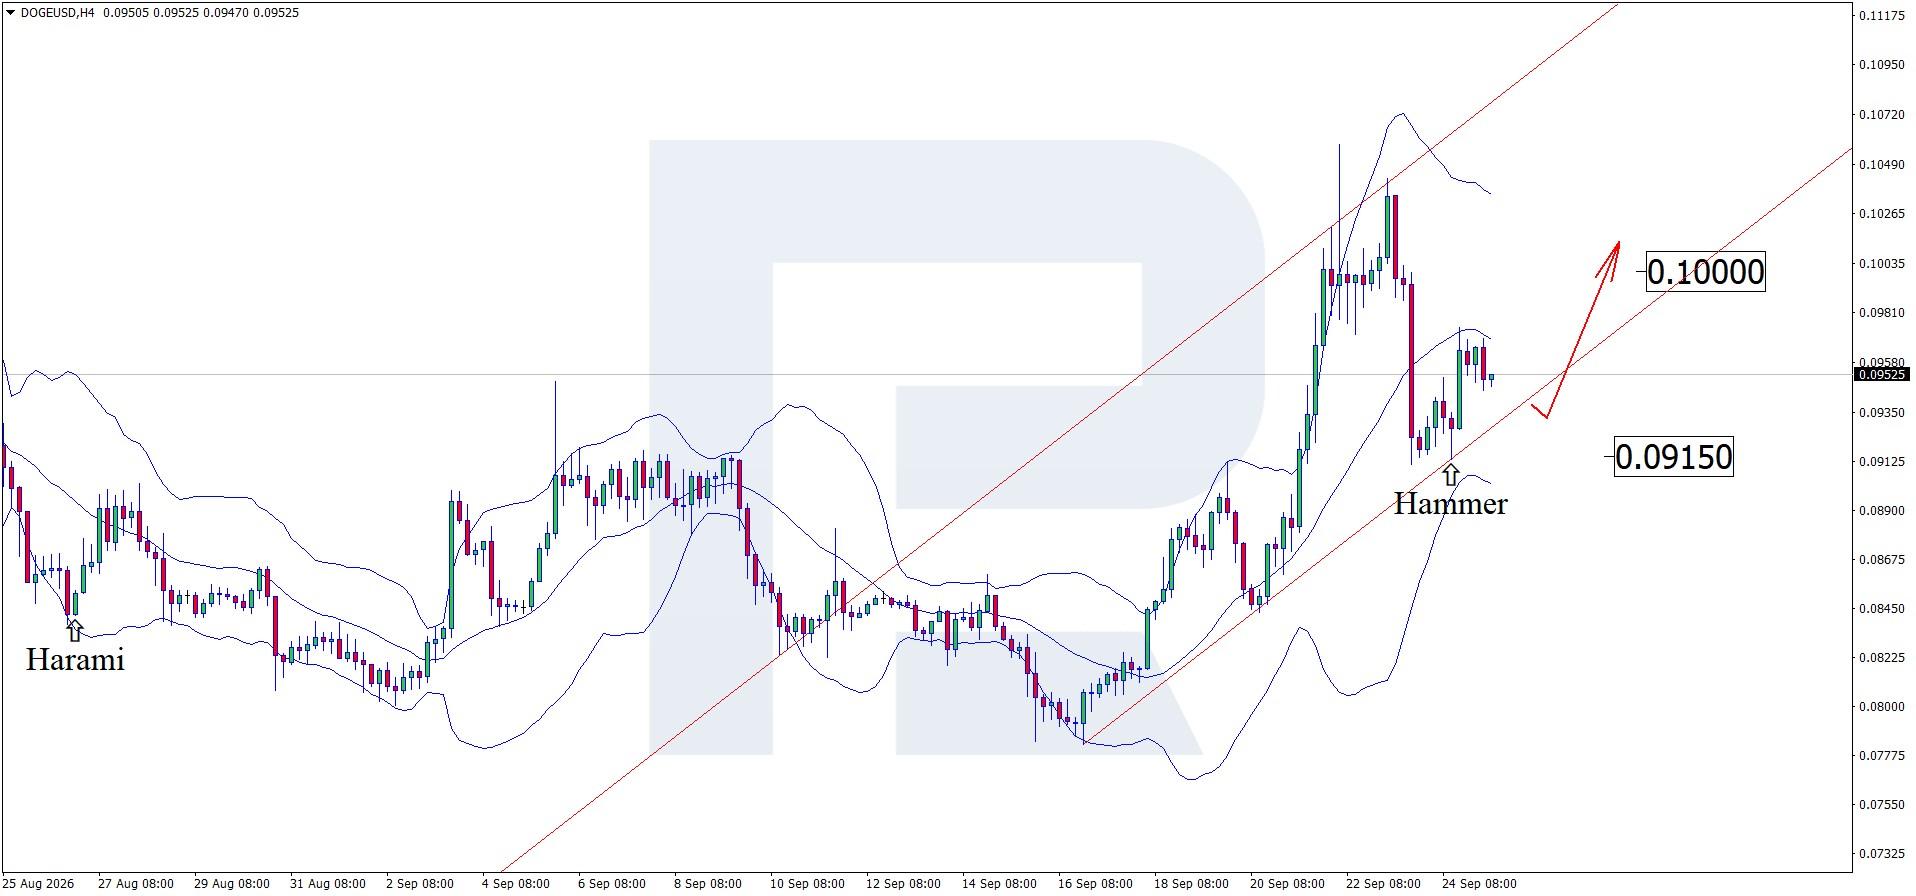
DOGEUSD under dual pressure: payments grow while investor interest declines Dogecoin's practical use is gradually increasing, which could support further growth in its price. The current price is 0.0952. Technical outlook On the H4 chart, DOGEUSD formed a Hammer reversal pattern near the lower Bollinger Band. At this stage, the price could continue the upward wave as the pattern signal plays out, with resistance around 0.1000 serving as the upside target. The main risk to further DOGEUSD gains remains buyers' inability to break above the 0.1000 resistance level and consolidate above it. Read more - DOGEUSD Forecast Attention! Forecasts presented in this section only reflect the author’s private opinion and should not be considered as guidance for trading. RoboForex bears no responsibility for trading results based on trading recommendations described in these analytical reviews. Sincerely, The RoboForex Team
-

HFMarkets (hfm.com): Market analysis services.
AllForexnews replied to AllForexnews's topic in Fundamental Analysis
[B]Date: 25th September 2026.[/B] [B]Treasury Yields Ease From 19-Year High as Oil Prices Fall.[/B] Stock market today: US stock futures are pointing higher on Friday as Treasury yields pull back from their highest levels in nearly two decades and oil prices cool on hopes for a US–Iran deal. After two days of heavy selling in government bonds, investors are getting a pause. It isn’t a turnaround yet, but it's enough to steady stocks before the opening bell. 10-Year Treasury Yield Pulls Back From 19-Year High The 10-year Treasury yield slipped to around 5.17% in Asian trading, down from Thursday’s 19-year peak just above 5.22%. The size of the recent move matters more than today’s dip. The 10-year gained roughly 20 basis points in two sessions, its sharpest two-day jump since the tariff shock of April 2025. Longer-dated bonds did even worse. The 30-year Treasury yield briefly topped 5.50%, a level last seen in 2004. That rise has already reached ordinary households: US mortgage rates are now around 7%, a heavy burden on a housing market that was already struggling. Global Bond Sell-off Spreads to Japan and Australia The pressure isn't limited to the US. Japan’s 10-year government bond yield climbed above 3.1%, its highest level since 1996, and Australian 10-year yields moved above 5.4%. Investors worldwide are demanding more compensation to lend over the long-term, driven by both inflation and large government deficits. Fed Rate Hike Odds Rise to 71% for October Fed funds futures now put the odds of another US rate hike next month at about 71%, up from roughly even odds earlier this week. Markets are pricing close to four more quarter-point hikes before this cycle ends. The two-year Treasury yield, which tracks near-term Fed expectations, is holding near 4.9%, around a two-year high. Other central banks are moving in the same direction. Norway’s Norges Bank raised rates on Thursday, and Sweden’s Riksbank signalled it will likely follow by year-end. Mexico’s central bank held steady but dropped its promise of a long pause. That shift has kept the US dollar strong. The US dollar Index is heading for a weekly gain of about 1%, near its highest level since late July. Oil Prices Today: Brent Falls on US-Iran Truce Hopes Oil’s pullback is a big reason bonds have calmed. Brent crude fell about 1% to roughly $105.50 a barrel, after rising more than 7% over the previous two sessions. WTI crude dropped more sharply to around $93. The dip comes from hopes for diplomacy. US and Iranian negotiators in New York are reportedly working on a phased agreement: Tehran would reopen the Strait of Hormuz, and Washington would lift its blockade of Iranian ports. Since the war began in late February, about a fifth of global oil and gas shipments have been disrupted, so any credible path to reopening the strait would matter a great deal. The risks remain real. Saudi Arabia intercepted six Houthi ballistic missiles aimed at Taif and the Red Sea export hub of Yanbu on Thursday, a reminder that oil infrastructure is still a target. The Brent-WTI spread is also worth watching. At about $12.70, it's the widest since May. Much of the gap comes from fears that Washington could ban diesel exports, which would leave more fuel in the US market and push domestic prices down relative to global prices. Asian Markets: Nikkei Rises, Hang Seng Falls After Trump–Xi Talks With mainland China, South Korea, and Taiwan closed for holidays, trading in Asia was light. Japan’s Nikkei 225 led the region with a gain of about 1%. The yen also firmed to around 158.25 per dollar after Finance Minister Satsuki Katayama said President Trump shares Tokyo's concern about the currency’s weakness. Hong Kong’s Hang Seng fell about 1% as the Trump-Xi summit continued without concrete deals on AI, trade, Taiwan, or Iran. Australian stocks also slipped as mining shares struggled. Corporate News: Anthropic, Oracle, Paramount Skydance Anthropic signed a seven-year, $11.6 billion computing deal with Akamai Technologies, adding to a long run of large AI infrastructure agreements. Oracle is taking steps to limit its cost exposure on a massive data center being built in New Mexico. Paramount Skydance is aiming to complete a $52 billion debt sale within the next week to fund its takeover of Warner Bros. Discovery. With yields this high, that financing will be closely watched. What to Watch Before the US Market Open Today The 10-year Treasury yield near 5.2%: If it stays below Thursday's peak, stocks may have room to rebound. A new high would quickly erase today’s calm. US-Iran headlines: Signs of real progress on Hormuz would likely push oil prices and yields lower. Another attack on Gulf infrastructure could reverse that quickly. Bitcoin options expiry: About $15 billion in Deribit contracts settle today, which could mean volatile trading in crypto. Fed speakers: With rate hike odds climbing, any comments from policymakers will move short-term yields. Weekly closes: The dollar’s 1% gain and bonds’ worst two days since spring will shape how investors position for next week. Today looks like a pause, not the end of the bond sell-off. Oil prices remain above $100, central banks are raising rates, and long-term Treasury yields are near their highest in about two decades. Investors should enjoy the calm without assuming it will last. The bond market is still setting the direction for stocks. [B]Always trade with strict risk management. Your capital is the single most important aspect of your trading business.[/B] [B]Please note that times displayed based on local time zone and are from time of writing this report.[/B] Click [URL='https://www.hfm.com/hf/en/trading-tools/economic-calendar.html'][B]HERE[/B][/URL] to access the full HFM Economic calendar. Want to learn to trade and analyse the markets? Join our webinars and get analysis and trading ideas combined with better understanding of how markets work. Click [URL='https://www.hfm.com/en/trading-tools/trading-webinars.html'][B]HERE[/B][/URL] to register for FREE! [URL='https://analysis.hfm.com/'][B]Click HERE to READ more Market news.[/B][/URL] [B]Andria Pichidi HFMarkets[/B] [B]Disclaimer:[/B] This material is provided as a general marketing communication for information purposes only and does not constitute an independent investment research. Nothing in this communication contains, or should be considered as containing, an investment advice or an investment recommendation or a solicitation for the purpose of buying or selling of any financial instrument. All information provided is gathered from reputable sources and any information containing an indication of past performance is not a guarantee or reliable indicator of future performance. Users acknowledge that any investment in Leveraged Products is characterized by a certain degree of uncertainty and that any investment of this nature involves a high level of risk for which the users are solely responsible and liable. We assume no liability for any loss arising from any investment made based on the information provided in this communication. This communication must not be reproduced or further distributed without our prior written permission. -
The real test is usually live execution, not the advertised spread. Around CPI/NFP you can have a decent raw spread but still get noticeably worse fills, especially on gold. I’d compare slippage over a decent sample rather than judging it from one news release
-

Introduction To Online Forex Trading
binaryowner replied to StefGrig's topic in General Forex Discussions
Exactly, demo is good for learning mechanics but it hides a lot of what matters live. Even a very small live account teaches you more about spreads, slippage, execution and your own reaction to losses than endlessly increasing the demo balance. Regulation matters too, but execution and withdrawals still need to be tested in practice -
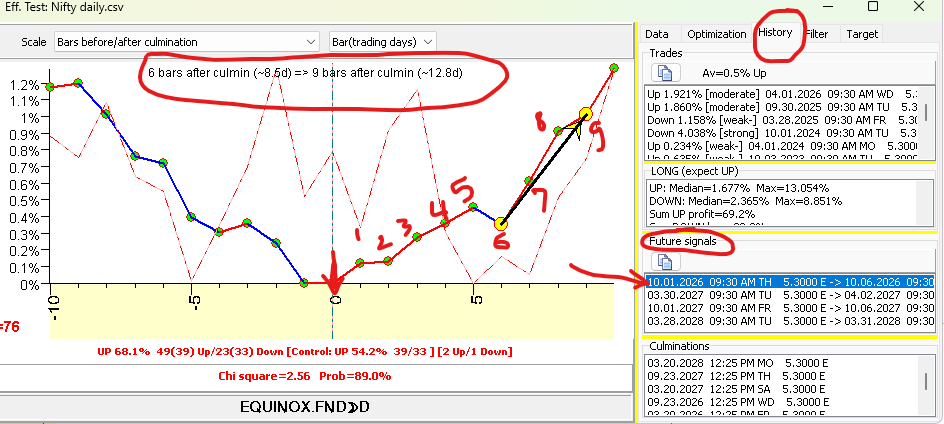
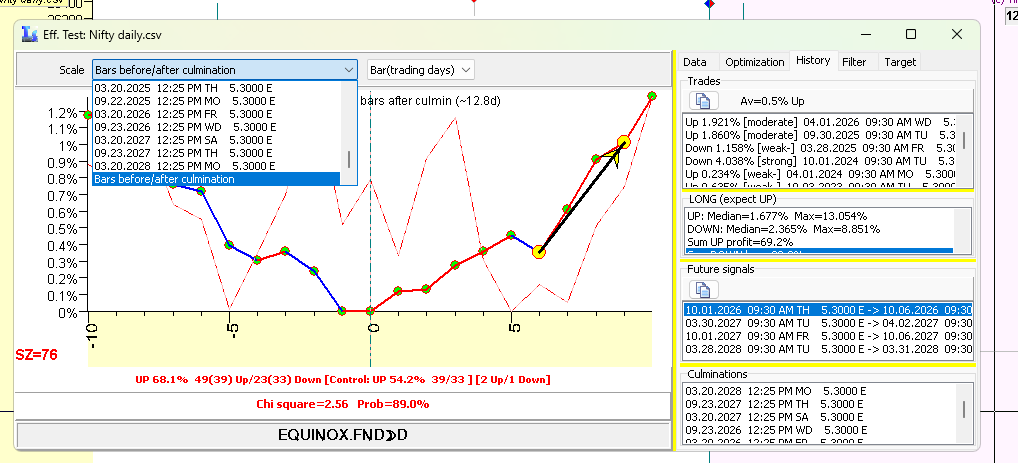
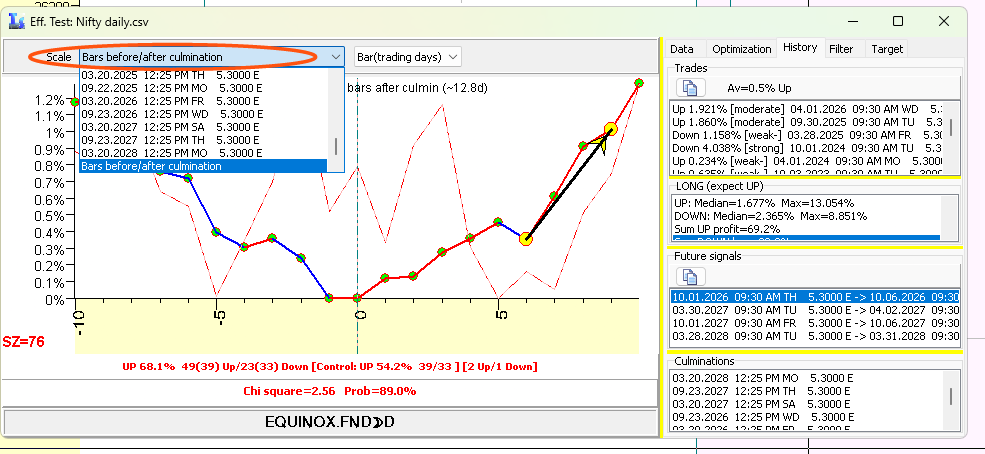
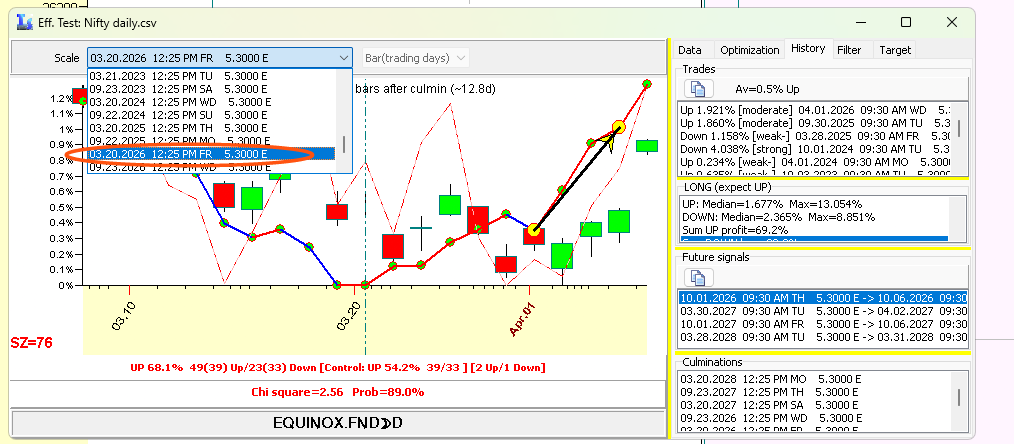
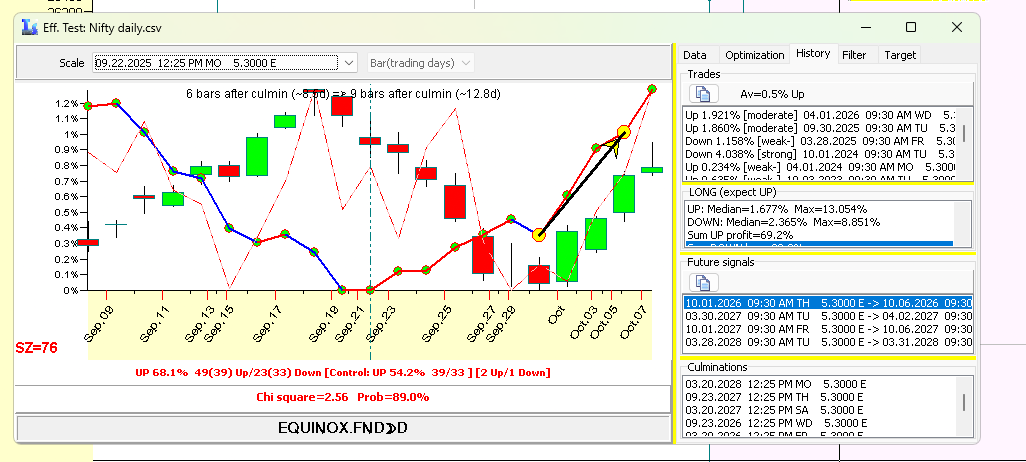
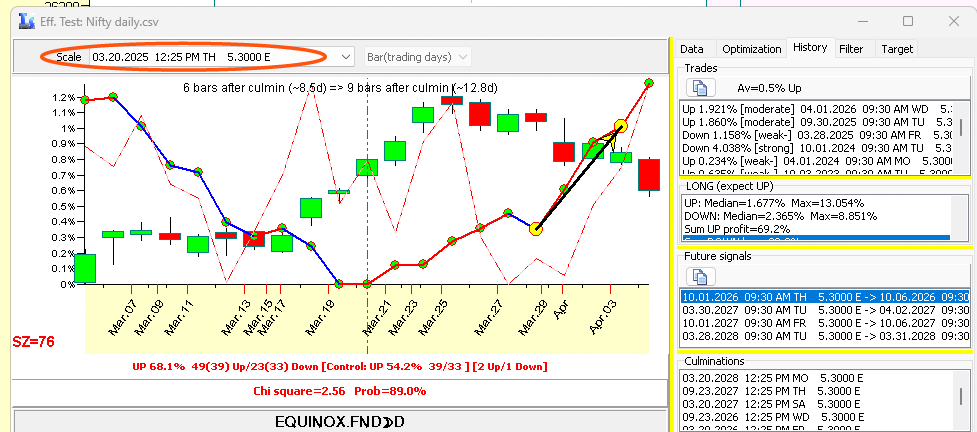
Hi Kesk, Actually see third last image, Top red underline it shows this predictable zone is active "6 bars after Culmination till 9 bars" & it has high probability, Zero line is culmination date, here i have used only equinox dates while creating fundamentals. When I saw articles around these events decided to test this in TS, I am trying to share the methodology how to do it in TS, (Or how I am trying to find some method which will help to find CIT's which is right at least 60-70% of time). Below are some more inputs on dates future & past how to check verify in TS. Also see some article aroud the event - hXXps://brameshtechanalysis.com/2024/06/23/ganns-celestial-trading-wisdom-equinoxes-and-solstices-in-financial-markets/ Check below image, Click on History to check how selected event (6bars after culmin. to 9 bars) is worked in past & percentages it has give in those dates, Also there are future dates of these probable image. I have marked bars with numbers how where predictable zone is shown in Image. If you select other lines from data tab you will get different predictable zones, I have chosen this because program showing high statistical probability of this event ie. almost 89%. Next see circled box that's where you can select history events to see how this has performed in past, Select the date here & you will see actual price action on these bars (in this case 6 to 9 bars after culmination. See when i selected date 20-march-2026, then 22- Sept 2025, 20 march 2025, Below are the results respectively, So i came across video claiming that this event has impact on market, decided to validate it in TS, found high probability event so shared method here to get if anyone has more input on it. Note. : Since event date is passed to recreate in TS delete 4-5 days data so that you get details for current event other wise you will get info on next events
-
MNQ with order flow and GEX is already a pretty deep place to start, so I’d probably focus more on consistency than adding more tools. From my experience with hfm, keeping track of which conditions setups actually work in can be more useful than constantly changing the strategy
-
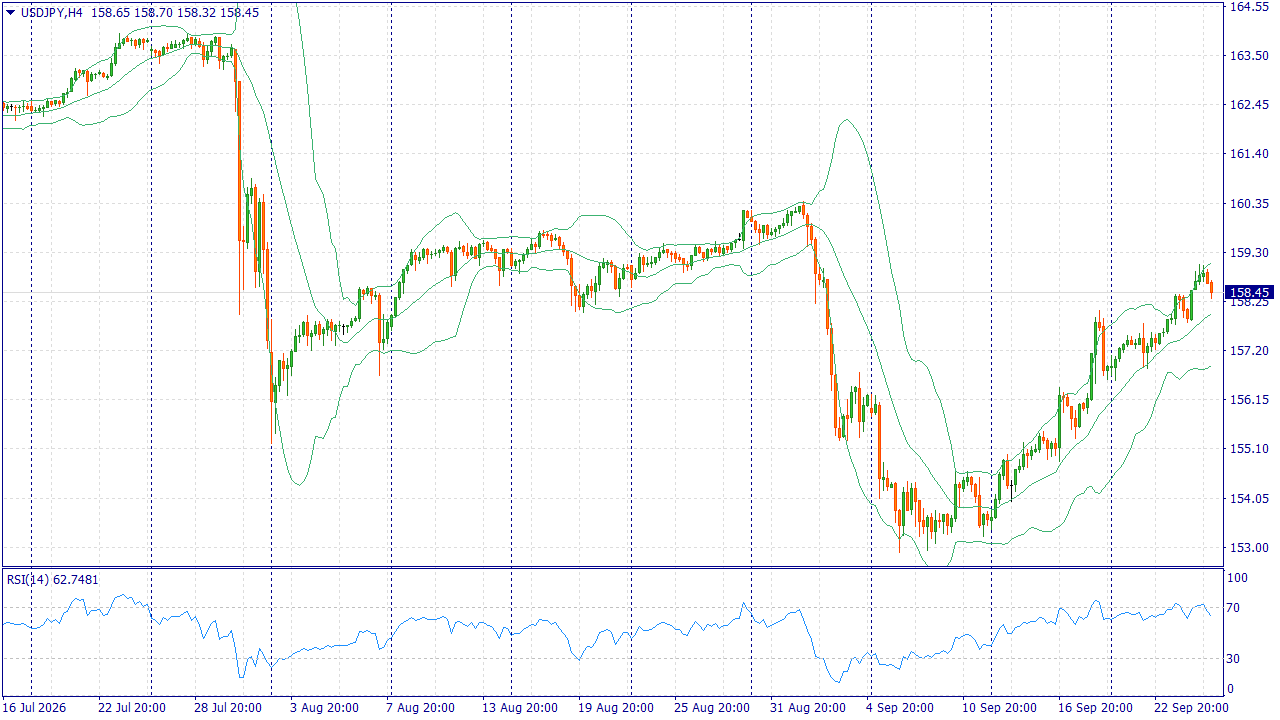
 Fundamental Market Analysis for September 25, 2026 USDJPY USDJPY: USD/JPY remains near elevated levels after several sessions of gains. The pair's main support comes from rising US Treasury yields: the yield on 10-year bonds has approached its highest levels since 2007, and the market has strengthened expectations for a new Fed rate hike. Such dynamics are particularly sensitive for the yen, as the yield differential is once again working in favor of the dollar. The Bank of Japan raised its interest rate to 1.25% last week, but the decision did not provide sustained strengthening of the yen. Investors focused on the absence of a clear signal regarding further rapid steps and on disagreements within the board. This limits the effect of policy tightening, especially against the backdrop of rising US yields and persistent demand for the US currency. A restraining factor remains the risk of action by Japanese authorities: following the Bank of Japan meeting, reports emerged about checks on exchange rates, and recent interventions make the market sensitive to yen weakness. Therefore, the upside potential for USD/JPY appears more limited than the dollar's momentum against the euro and pound. With no new confirmed actions from Tokyo yet, the base case still allows for cautious continuation of the pair's growth. Trading idea: BUY 158.70, SL 158.35, TP 159.40 Up to $20 for each lot in real money - get a guaranteed income by connecting Cashback promotion! You can find more analytical information on our website.
-

VIP Membership - FREE upgrade for OLD and ACTIVE Members
lyqhlee replied to MrAdmin's topic in Announcements
Thanks A Lot waiting For Your Response Sir. Thanks and Warm Regards. -
lyqhlee joined the community
- Yesterday
-
Welcome to Indo-Investasi.com. Please feel free to browse around and get to know the others. If you have any questions please don't hesitate to ask.
-
 mkkhalid05 joined the community
 -
roboforex Market Fundamental Analysis by RoboForex
RBFX Support replied to RBFX Support's topic in Fundamental Analysis
JP 225 under BoJ pressure: record-high rate weighs on Japanese equities as AI tries to support the market After rising, the JP 225 index is forming another downward wave under pressure from high interest rates. The current price stands at 65,453.0. JP 225 forecast: key takeaways Japanese equities are supported by AI and semiconductor stocks The Bank of Japan raised its key interest rate to 1.3% JP 225 forecast for 24 September 2026: 66,160.0 and 64,960.0 Fundamental analysis The JP 225 forecast for today, 24 September 2026, takes into account that the fundamental backdrop remains mixed: Japanese equities are supported by AI and semiconductor stocks, while rising JGB yields and tighter BoJ policy create opposing pressure. Following a strong rally in the US technology sector, Japanese manufacturers of AI components and equipment received fresh momentum. RoboForex Market Analysis & Forex Forecasts Attention! Forecasts presented in this section only reflect the author’s private opinion and should not be considered as guidance for trading. RoboForex bears no responsibility for trading results based on trading recommendations described in these analytical reviews. Sincerely, The RoboForex Team -
Bitcoin above $87,000: buyers are back! The cryptocurrency market is back in the spotlight. On September 21, Bitcoin (BTCUSD) rose above $87,000, continuing its strong recovery after recent fluctuations. The move was not isolated: at the same time, the Nasdaq (#NQ100) once again approached its all-time high, while investor interest in riskier assets increased noticeably. This makes Bitcoin’s current rise particularly interesting. The market is showing that BTC is now moving not only as an independent crypto asset but also as part of broader risk appetite, alongside the U.S. technology sector. Our swap-free month for major currency pairs is ending soon! Learn more Why Is Bitcoin Rising Alongside the Index? The market is buying risk again. After several volatile sessions, investors returned to technology stocks, while the Nasdaq moved back toward record levels. This creates a favorable environment for Bitcoin: when risk appetite increases, cryptocurrencies often attract additional capital inflows. Bond yields are falling. The yield on 10-year U.S. Treasury bonds fell below 5%. This reduces pressure on risk assets and makes instruments such as BTCUSD and #NQ100 more attractive to investors. Oil is no longer putting pressure on the market. Falling oil prices have eased concerns about inflation. The less the market fears another wave of price increases, the more comfortable investors become with growth stocks and cryptocurrencies. Strong momentum in technology is supporting crypto as well. Gains in artificial intelligence-related stocks have once again strengthened confidence in the technology sector. Against this backdrop, Bitcoin is increasingly trading in the same direction as #NQ100 rather than moving independently. At this point, not only the move above $87,000 matters, but also the nature of the move. While the cryptocurrency market often used to move independently, Bitcoin is now increasingly responding to the same drivers as the U.S. stock market: bond yields, inflation expectations, and overall investor sentiment. According to FreshForex analysts, as long as risk appetite remains strong, Bitcoin has room for further growth. The current correlation with #NQ100 is supporting buyers: a strong technology sector, falling bond yields, and easing inflation concerns are creating a more favorable environment for BTCUSD. If BTCUSD holds above $87,000, the next psychological target for buyers could be $90,000, while a breakout above this level could open the way toward the $92,000–93,000 area. Trade with our Cashback promotion and receive up to $20 for every lot in real funds! We also offer deposit promotions — learn more. Invest in cryptocurrency
-
Are prizes and awards from brokers real?
binaryowner replied to hafidfx's topic in Trading Contests & Bonuses
According to my experience with HFM, that’ll depend on the country and how the prize is classified. Cash and non-cash prizes can be treated differently for tax purposes, so I definitely wouldn’t assume the broker has already handled everything on the winner’s side -
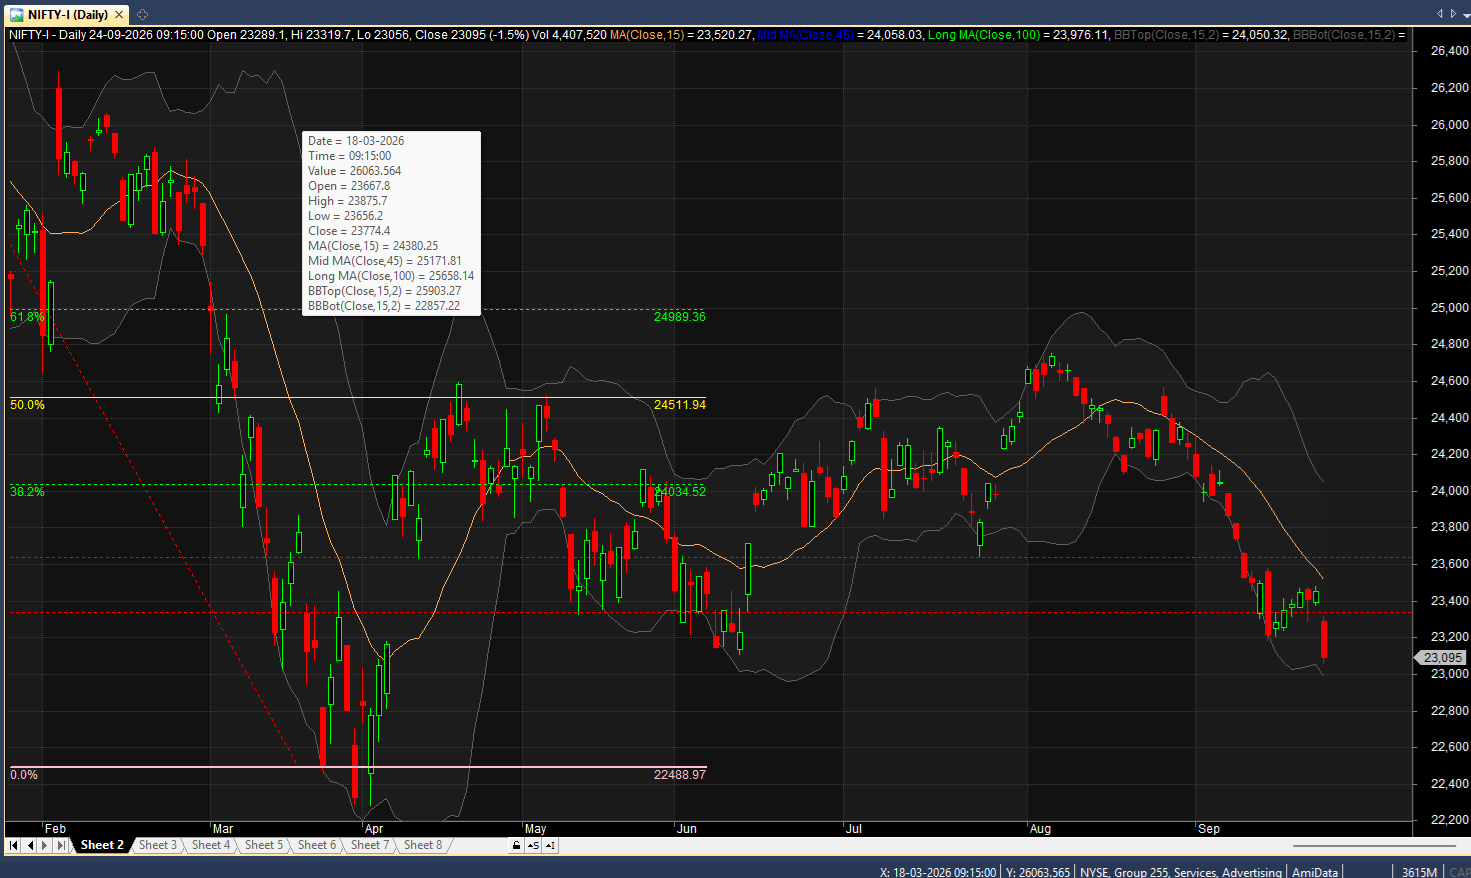
Santosh, Thanks for the tips. But before I could even try today on Nifty, it went by more than 1.5% down. You mentioned the trend will change direction. Already we were in a long trend down and for 1 week went up slightly but today's fall was very steep. What is considered changed here? From up to Down or the last weeks up from down? In this case, the prior happenings wont help. How to interpret? Can you pls indicate your analysis with the dates from the below picture. Once again thanks.
-
HFMarkets (hfm.com): Market analysis services.
AllForexnews replied to AllForexnews's topic in Fundamental Analysis
[B]Date: 24th September 2026.[/B] [B]The 5% Problem: Why One Bond Yield Is Running Every Market Today.[/B] If you want to understand markets today, forget tickers for a moment and look at one number: 5.11%. That's where the US 10-year Treasury yield closed Wednesday, the highest since July 2007, and it kept climbing overnight toward 5.13%. Nearly every other story today, from Tokyo currency desks to European boardrooms, is a reaction to it. The economy is running hot, and that's the problem The spark came from an unlikely place: good news. S&P Global's flash Composite PMI jumped to 58.4 in September from 56.0, its strongest reading since mid-2021. In a normal year that would be cause for celebration. This year it landed on a market already nervous about inflation. The details made it worse. Business input costs rose at their fastest pace in four years, pushed up by fuel and shipping, and supply-chain strain hit levels rarely seen outside the pandemic. Add Brent crude trading above $100 a barrel, and traders drew the obvious conclusion: price pressures aren't fading, so rates may have further to rise. For investors, the uncomfortable shift is that 5% no longer looks like a ceiling. Some strategists are openly discussing 6%, and the point at which higher yields start actively hurting stocks may be close. Wall Street: a slow leak, not a crash Wednesday's session ended in the red across the board: the Nasdaq Composite fell 1.13%, the S&P 500 lost 0.75%, and the Dow gave up 0.68%. Futures were barely lower overnight, but the selling picked up into the European morning. Nasdaq-100 contracts were down about 0.5%, S&P 500 futures about 0.4%, and Dow futures about 0.2% ahead of the open. Tech is taking the hardest hit, and that makes sense. Growth stocks are valued on profits far in the future, and higher yields make those future profits worth less today. Even a busy stretch of AI news hasn't been enough to offset that. Meta showed off new VR glasses and plans to monetize its Muse AI agent at its Connect event, and Alphabet signaled that Gemini 4 is close. Unity Software rose overnight on hopes it benefits from Meta's VR push. The summit in the background Today's biggest scheduled event is political. Chinese President Xi Jinping is in Washington for a three-day summit with President Trump, capped by a White House state dinner expected to include many of America's top tech and finance CEOs. Some of the tension was defused before the meeting started. Treasury Secretary Scott Bessent said the two countries have extended their trade truce by two months, to January 10. That leaves AI competition, the war in Iran, and critical minerals as the main topics. A positive surprise on any of these could briefly lift sentiment, but it's hard to see a handshake outweighing a 5% bond yield. Tokyo's line in the sand The strong dollar is putting pressure on Japan. The yen has slid for two weeks and sits near 157.85 per dollar, uncomfortably close to 160, a level that has triggered official action before. The Bank of Japan raised rates last week, but the governor's follow-up comments were less hawkish than traders hoped, so the yen kept weakening. The key question now is whether Washington would help again. The US joined Japan in buying yen this summer, and Bessent has repeatedly said he wants a stronger yen. If the currency tests 160, markets will find out whether he backs that up with action. Strategists are split on whether the threat alone will be enough. Europe: strong earnings, rising bills Europe presents a split picture. Analysts have been raising earnings estimates for months, the longest run of upgrades in over four years, and Stoxx 600 profits are expected to rise around 15% this year. Euro-area business activity just grew at its fastest pace in more than three years. The market isn't fully convinced, though. The Stoxx 600 has drifted lower since mid-August, and higher borrowing costs are starting to squeeze companies that need to refinance debt. The ECB has already hiked once this month, and markets expect more. Europe's economic data is solid, but rising interest costs could eat into those earnings. Bitcoin: the market's optimist One asset seems to be ignoring the gloom. Bitcoin trades around $84,000, up more than 30% since August. The next test comes Friday, when roughly $15 billion in Deribit options expire. Heavy call positions at $85,000, $90,000, and $100,000 mean dealer hedging could cap rallies until the contracts settle. After expiry, that cap could come off. What to watch before the bell Jobless claims : Another strong labor reading would add to the "rates higher for longer" story and push yields up further. The 10-year yield: If it holds above 5.1%, pressure on tech likely continues. A pullback would give stocks some relief. USD/JPY at 160: A move toward that level raises the odds of intervention, which could move the dollar sharply. Trump–Xi headlines: Mostly a sentiment story unless there's concrete progress on AI or critical minerals. The takeaway: Today isn't really about any single company or summit. It's about whether markets can live with a 5% risk-free rate while inflation signals keep heating up. Until yields ease, rallies are likely to be short-lived. [B]Always trade with strict risk management. Your capital is the single most important aspect of your trading business.[/B] [B]Please note that times displayed based on local time zone and are from time of writing this report.[/B] Click [URL='https://www.hfm.com/hf/en/trading-tools/economic-calendar.html'][B]HERE[/B][/URL] to access the full HFM Economic calendar. Want to learn to trade and analyse the markets? Join our webinars and get analysis and trading ideas combined with better understanding of how markets work. Click [URL='https://www.hfm.com/en/trading-tools/trading-webinars.html'][B]HERE[/B][/URL] to register for FREE! [URL='https://analysis.hfm.com/'][B]Click HERE to READ more Market news.[/B][/URL] [B]Andria Pichidi HFMarkets[/B] [B]Disclaimer:[/B] This material is provided as a general marketing communication for information purposes only and does not constitute an independent investment research. Nothing in this communication contains, or should be considered as containing, an investment advice or an investment recommendation or a solicitation for the purpose of buying or selling of any financial instrument. All information provided is gathered from reputable sources and any information containing an indication of past performance is not a guarantee or reliable indicator of future performance. Users acknowledge that any investment in Leveraged Products is characterized by a certain degree of uncertainty and that any investment of this nature involves a high level of risk for which the users are solely responsible and liable. We assume no liability for any loss arising from any investment made based on the information provided in this communication. This communication must not be reproduced or further distributed without our prior written permission. -
Market Technical Analysis by RoboForex
RBFX Support replied to RBFX Support's topic in Technical Analysis
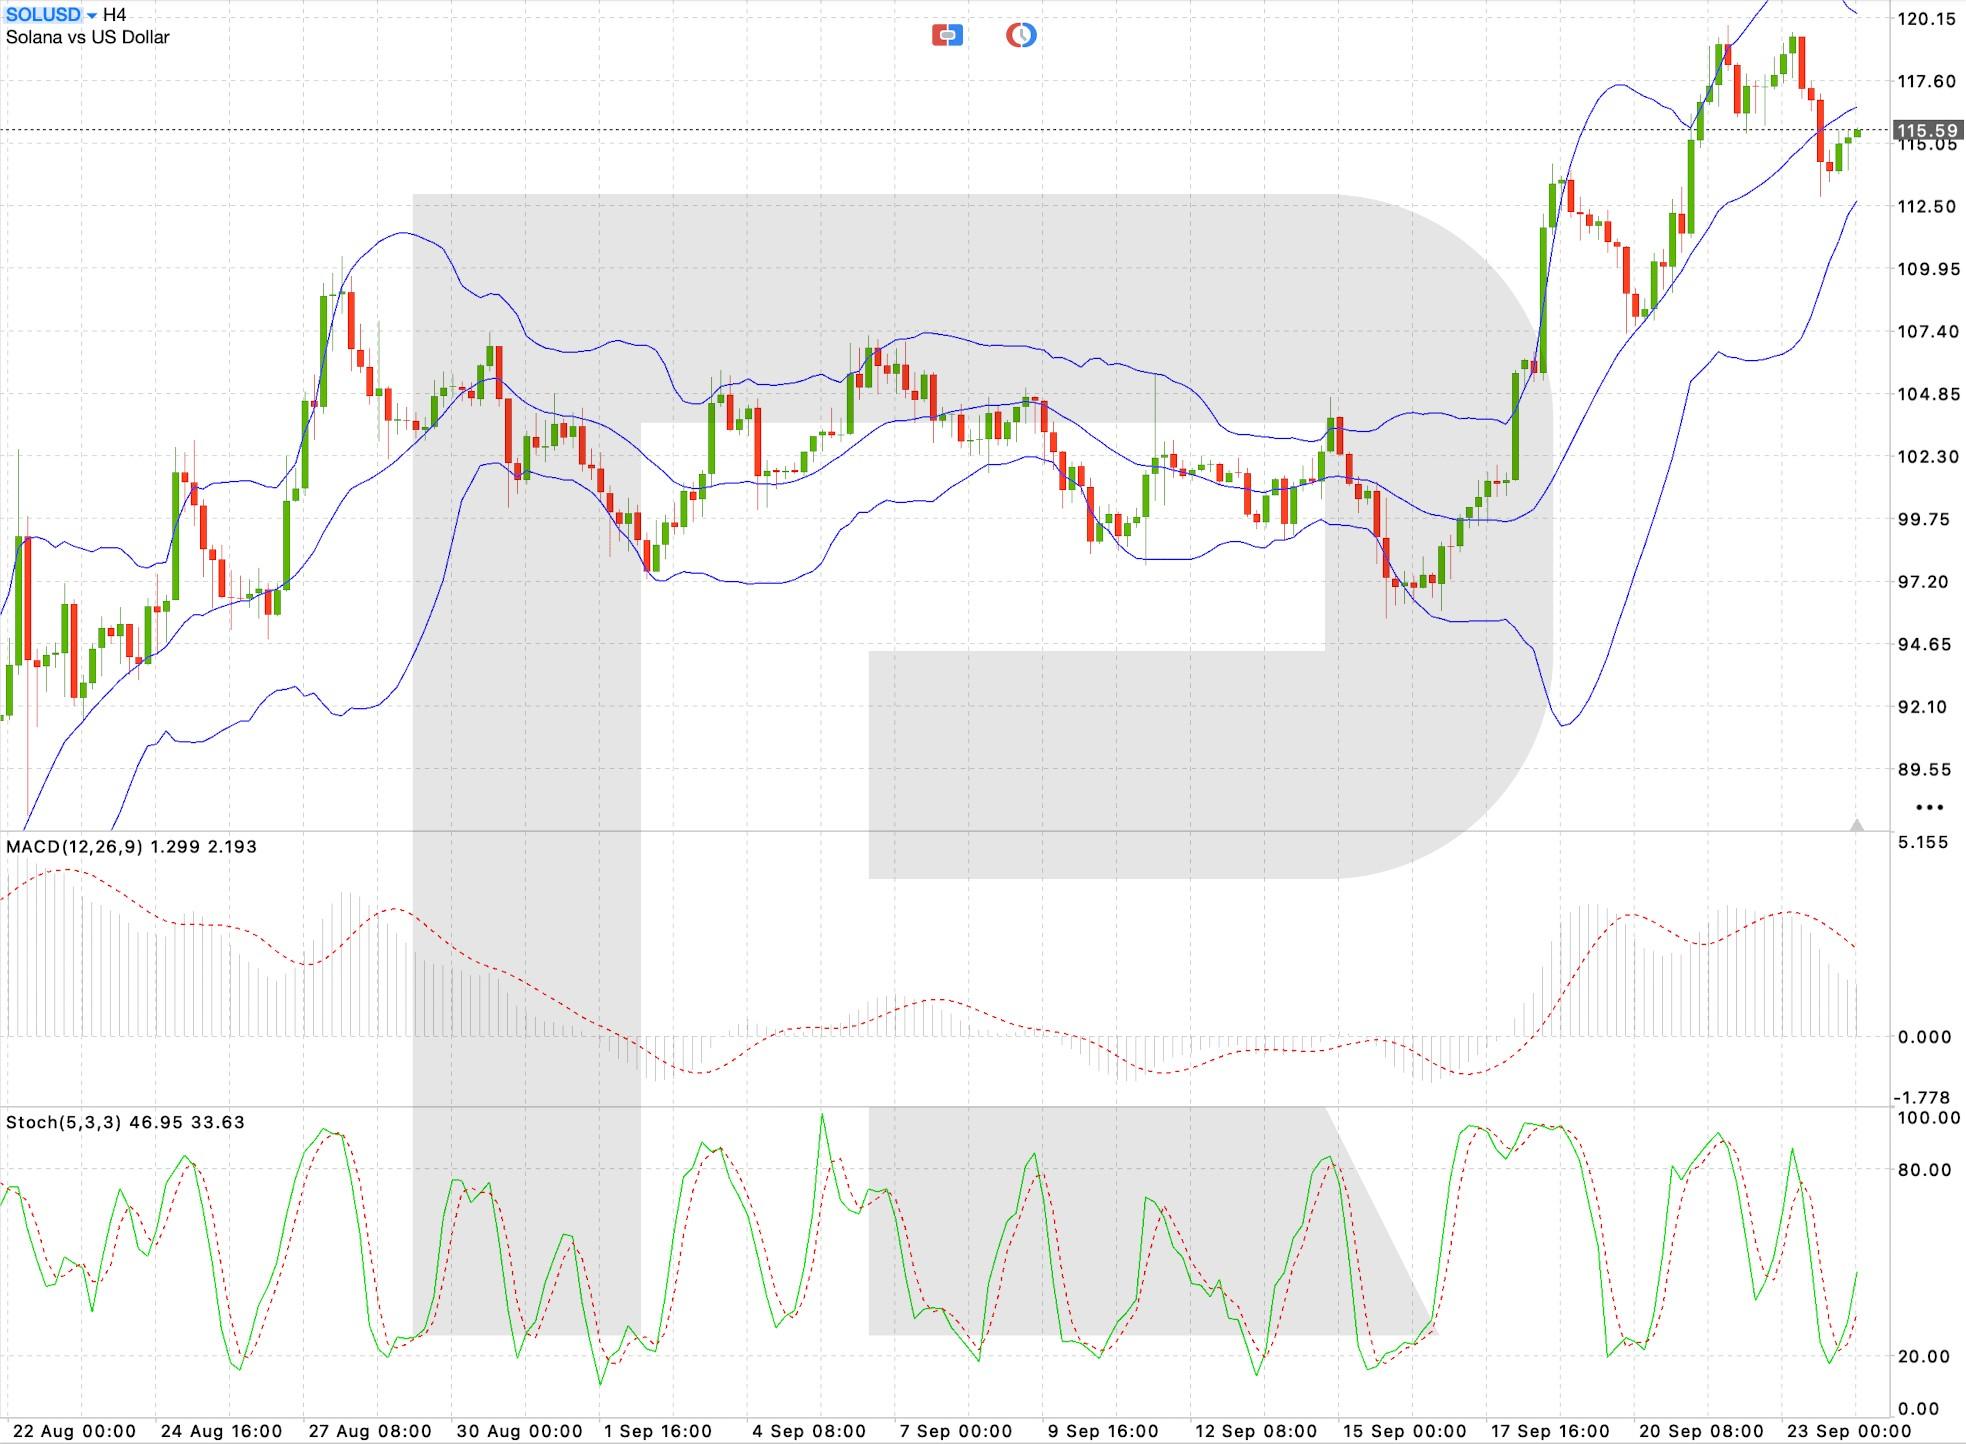
Tokenisation accelerates Solana: SOL prepares for another test of 120 USD SOLUSD is holding around 115.59 after a strong September rally, while the value of tokenised real-world assets on the Solana network has reached a new all-time high. Technical outlook On the H4 timeframe, SOLUSD maintains a bullish structure after a sharp rise from the 100 area. The price reached the 119–120 zone before correcting and is now consolidating around 115.59. SOLUSD is consolidating after a strong rally but remains broadly bullish. Read more - SOLUSD Forecast Attention! Forecasts presented in this section only reflect the author’s private opinion and should not be considered as guidance for trading. RoboForex bears no responsibility for trading results based on trading recommendations described in these analytical reviews. Sincerely, The RoboForex Team
-
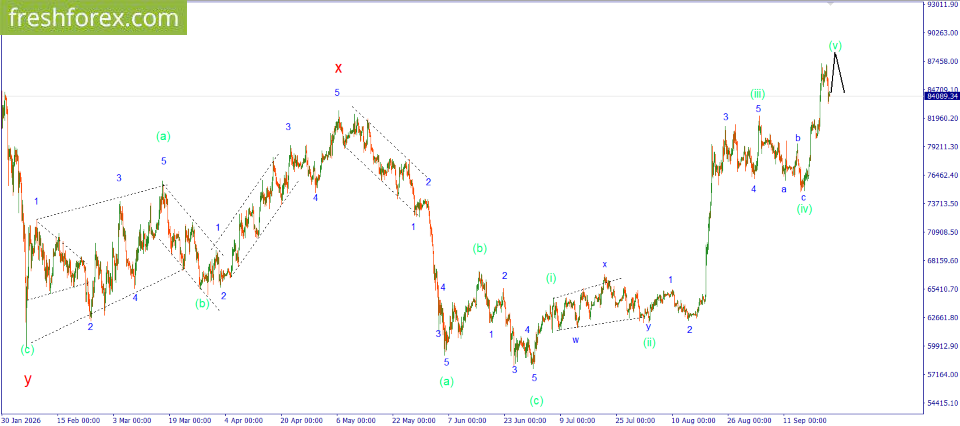
Elliott wave analysis of the market for September 24, 2026 BTCUSD BTCUSD: FLAT. No swaps on majors for a month! Learn more We did not see a continuation of the growth during the past trading day, although Bitcoin tried very hard. In the end, there was not enough strength for this final push and the price went in the opposite direction. At the same time, the opportunity for another update of the local maximum, along with it, for the full completion of the development of the impulse in wave (v), is still preserved, as there has been no intersection with the first wave yet. It is quite possible that buyers will attempt to make this move in the near future, so selling is not recommended for now. In the current situation, it is worth watching how events will develop and acting when a clear picture appears. Investment idea: FLAT. Get a 300% bonus on every deposit of $100 or more and increase your trading volume! You can find more analytical information on our website.
- Last week
-
Thank you. Interesting. I will test this.
-
Market Technical Analysis by RoboForex
RBFX Support replied to RBFX Support's topic in Technical Analysis
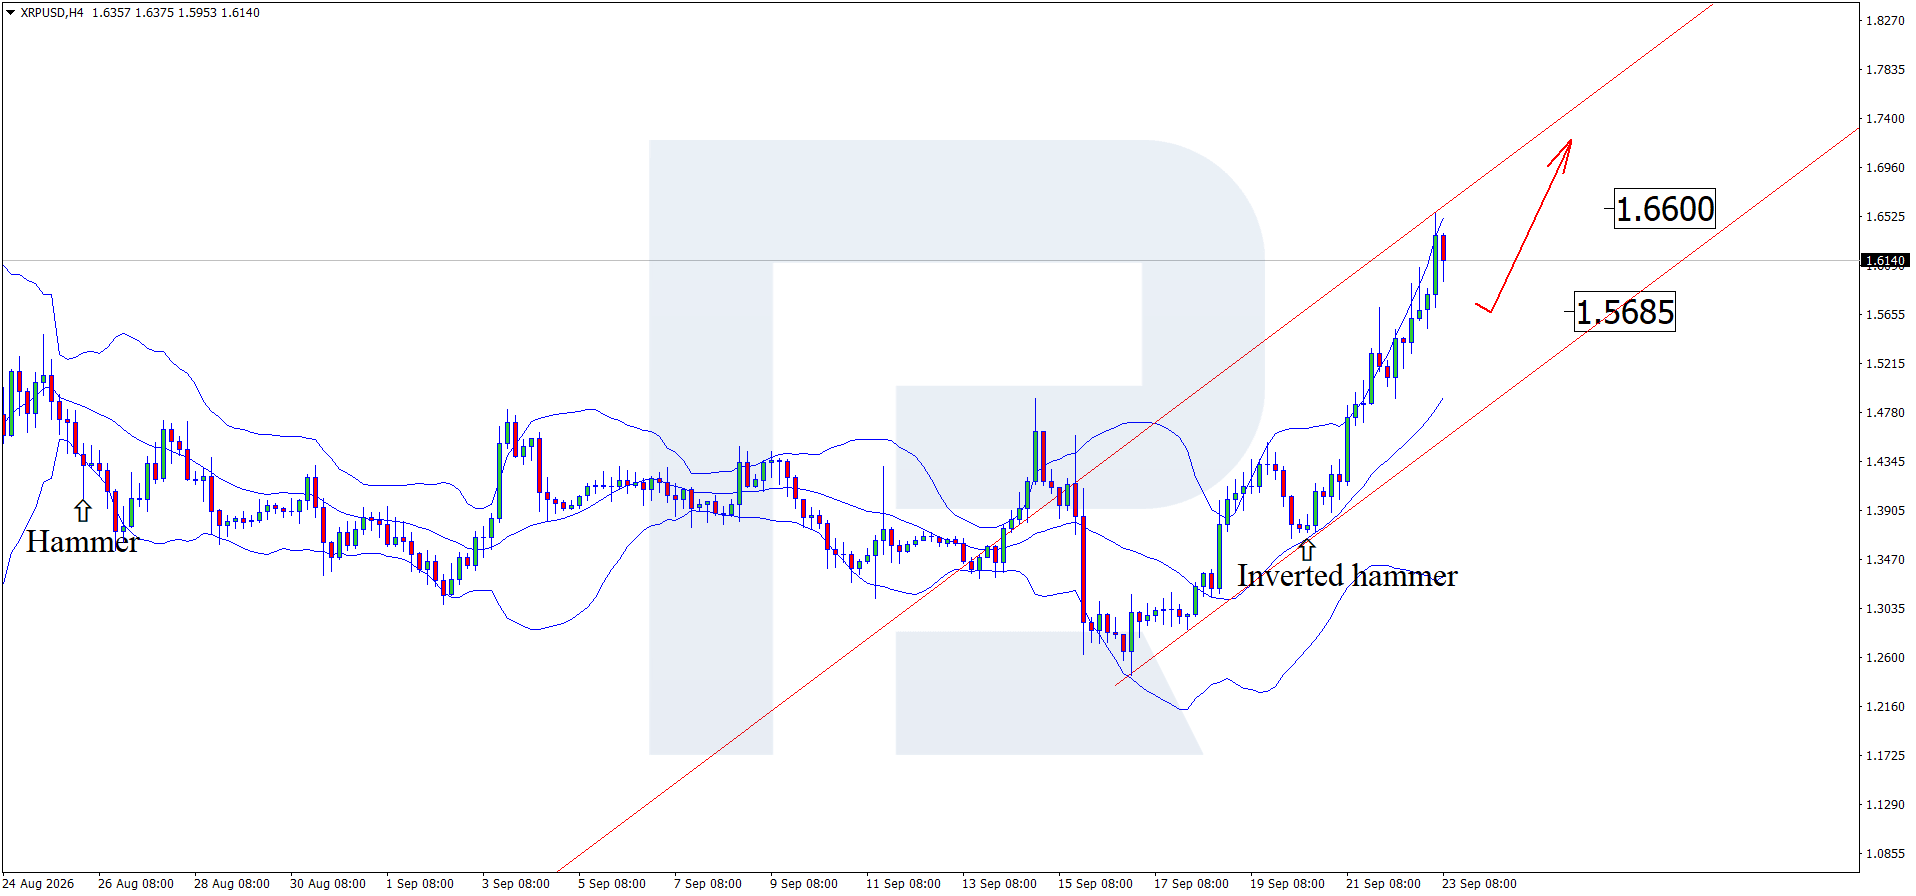
XRP under pressure again as ETF inflows slow and US crypto regulation stalls XRP is correcting after a sharp rally. The current price is 1.6140. Technical outlook On the H4 chart, XRPUSD formed an Inverted Hammer reversal pattern near the middle Bollinger Band. At this stage, the price could continue the upward wave as the pattern signal plays out, with resistance around 1.6600 serving as the upside target. XRPUSD is correcting today after a sharp rally. Read more - XRPUSD Forecast Attention! Forecasts presented in this section only reflect the author’s private opinion and should not be considered as guidance for trading. RoboForex bears no responsibility for trading results based on trading recommendations described in these analytical reviews. Sincerely, The RoboForex Team
-
roboforex Market Fundamental Analysis by RoboForex
RBFX Support replied to RBFX Support's topic in Fundamental Analysis
USDJPY rises as government bond yield differential supports the dollar The probability of another Federal Reserve rate hike as early as October is 55%. USDJPY forecast: key takeaways According to Reuters, the market estimates the probability of another rate hike at the October meeting at around 55% The Bank of Japan raised the interest rate to 1.25% USDJPY forecast for 23 September 2026: 158.90 Fundamental analysis The fundamental backdrop for USDJPY currently remains largely in favour of the dollar despite the Bank of Japan's tighter monetary policy. On 16 September, the Federal Reserve raised the interest rate by 25 basis points to a range of 3.75–4.00%. The Bank of Japan has also shifted towards tighter policy. On 18 September, the regulator raised the interest rate from 1.00% to 1.25%, the highest level in 31 years. RoboForex Market Analysis & Forex Forecasts Attention! Forecasts presented in this section only reflect the author’s private opinion and should not be considered as guidance for trading. RoboForex bears no responsibility for trading results based on trading recommendations described in these analytical reviews. Sincerely, The RoboForex Team -
HFMarkets (hfm.com): Market analysis services.
AllForexnews replied to AllForexnews's topic in Fundamental Analysis
Date: 23rd September 2026. Oil Slides as Bonds Rally: Iran Diplomacy Lifts Market Sentiment. Global financial markets are finding some relief as oil prices extend their decline, easing concerns that elevated energy costs could keep inflation and interest rates higher for longer. Government bonds and US Treasury futures strengthened on Wednesday as crude oil fell for a sixth consecutive session. At the same time, technology shares continued to benefit from renewed optimism surrounding artificial intelligence, helping Asian equities build on recent gains. However, the broader market environment remains far from settled. Investors continue to monitor diplomatic developments involving the United States and Iran, expectations for further Federal Reserve interest-rate hikes, and the upcoming US-China talks. Oil Prices Fall as Supply Concerns Ease Oil remains one of the most important drivers of global market sentiment. Brent crude fell below $99 per barrel during Wednesday’s Asian session, extending a decline that has significantly reduced prices from their recent Middle East conflict-driven highs. US crude also traded around the $90 level. Two developments have helped ease fears of an immediate supply shortage. First, Saudi Arabia has restarted operations at its East-West Pipeline following disruptions earlier in September. The pipeline allows Saudi crude to reach the Red Sea port of Yanbu, providing an alternative export route that reduces reliance on the Strait of Hormuz. Reuters reported that operations had resumed, although a full restoration of capacity could take several weeks. Second, markets are responding to renewed diplomatic efforts surrounding the conflict with Iran. US President Donald Trump said discussions with Iran had made progress and expressed expectations that an eventual settlement could be reached, although his comments have continued to include strong warnings towards Tehran. The possibility of greater oil flows through the region is particularly important. Iran has indicated that reopening the Strait of Hormuz could form part of a diplomatic process if US pressure is reduced. Any sustained improvement in shipping conditions could remove some of the geopolitical premium that pushed energy prices sharply higher earlier this year. Higher oil prices can feed directly into headline inflation through fuel, transportation, and production costs. When energy prices rise sharply, investors may expect central banks to keep interest rates elevated for longer, usually putting upward pressure on government bond yields. The opposite dynamic is now offering some relief. A sustained decline in oil could therefore become increasingly important for bonds. If lower energy prices eventually translate into softer inflation, investors may reduce expectations for additional monetary tightening. For now, however, that scenario is far from guaranteed. Federal Reserve Keeps the Dollar Supported Despite falling oil prices, the US Dollar remains close to its strongest level in around two months as traders continue to price in the possibility of further Federal Reserve rate increases. The Fed raised interest rates last week, and several policymakers have since indicated that inflation remains a concern. Richmond Fed President Tom Barkin said price pressures were not limited to energy and tariffs, pointing to strong consumer demand and broader economic momentum. Markets have consequently continued to debate whether the Fed could raise rates again at its October meeting. Futures pricing recently showed roughly even odds of another 25-basis-point increase. This expectation has helped the US Dollar Index remain around the 100 level, while the euro has traded close to multi-week lows. The Japanese yen has also remained under pressure near 157 per Dollar. Although the Bank of Japan recently raised its policy rate to 1.25%, two dissenting votes and limited guidance over future tightening left investors questioning how quickly Japanese interest rates could rise from here. AI Optimism Pushes Technology Stocks Higher While energy and bond markets focus heavily on geopolitics and inflation, equity investors have another major theme to consider: artificial intelligence. Renewed enthusiasm surrounding AI helped the NASDAQ reach a fresh intraday record this week. Technology and semiconductor stocks have regained momentum after concerns earlier in the year over AI investment costs and the speed at which companies could generate returns from their spending. That optimism has spread into Asian markets. MSCI’s broad Asia-Pacific index outside Japan rose around 0.7% on Wednesday and headed towards a sixth consecutive session of gains. South Korean equities advanced as semiconductor shares strengthened, while Taiwan’s market moved close to record territory. Lower oil prices are providing another tailwind. Cheaper energy can reduce inflation expectations, limit pressure on bond yields, and improve the outlook for corporate margins, particularly in energy-intensive industries. The combination of softer crude and renewed AI enthusiasm has therefore improved risk sentiment even while geopolitical uncertainty remains elevated. US-China Talks Become the Next Major Market Focus Attention is also shifting towards talks between President Trump and Chinese President Xi Jinping. Officials from both countries have recently described preparatory discussions covering trade, artificial intelligence, and investment in positive terms, although significant disagreements remain. For financial markets, the key issue is whether the talks can prevent another escalation in tariffs, technology restrictions, or critical-mineral controls. Even limited progress could reduce another source of uncertainty for global equities. Conversely, renewed tensions between the world’s two largest economies could quickly challenge the recent improvement in market sentiment. Gold Remains Pressured by Higher Rate Expectations Gold has struggled to benefit significantly from geopolitical uncertainty as rising interest-rate expectations and a stronger Dollar offset safe-haven demand. Spot gold traded around $4,345 per ounce early Wednesday. Higher interest rates tend to create a headwind for bullion because gold does not generate interest, while a stronger US Dollar increases its cost for buyers using other currencies. The metal may therefore remain caught between two opposing forces: geopolitical uncertainty supporting demand, and expectations of tighter monetary policy limiting upside momentum. What Markets Are Watching Next The immediate market outlook is increasingly tied to the direction of oil. Further progress towards diplomatic arrangements involving Iran, improved shipping through the Strait of Hormuz, or additional Saudi supply could extend the decline in crude. That would potentially reduce inflation fears, support government bonds, and provide a more favourable environment for equities. However, the geopolitical situation remains highly uncertain, meaning another escalation could quickly reverse the recent move. At the same time, Federal Reserve communication remains crucial. Falling oil alone may not be enough to prevent further rate hikes if US policymakers continue to see persistent inflation across services and consumer demand. For now, markets are benefiting from an unusual combination: oil prices are falling, bond-market pressure is easing and AI optimism is supporting equities. Whether that environment lasts will depend heavily on what comes next from the Middle East, the Federal Reserve and US-China negotiations. Always trade with strict risk management. Your capital is the single most important aspect of your trading business. Please note that times displayed based on local time zone and are from time of writing this report. Click HERE to access the full HFM Economic calendar. Want to learn to trade and analyse the markets? Join our webinars and get analysis and trading ideas combined with better understanding of how markets work. Click HERE to register for FREE! Click HERE to READ more Market news. Andria Pichidi HFMarkets Disclaimer: This material is provided as a general marketing communication for information purposes only and does not constitute an independent investment research. Nothing in this communication contains, or should be considered as containing, an investment advice or an investment recommendation or a solicitation for the purpose of buying or selling of any financial instrument. All information provided is gathered from reputable sources and any information containing an indication of past performance is not a guarantee or reliable indicator of future performance. Users acknowledge that any investment in Leveraged Products is characterized by a certain degree of uncertainty and that any investment of this nature involves a high level of risk for which the users are solely responsible and liable. We assume no liability for any loss arising from any investment made based on the information provided in this communication. This communication must not be reproduced or further distributed without our prior written permission. -
The useful distinction is really between pips and pip value. Pips describe the price movement, while the money gained or lost depends on position size and the pair; leverage itself doesn’t change the value of the underlying price move