All Activity
- Today
-
 darius00101 joined the community
 -
 Harrys reacted to a post in a topic:
Algobox required
Harrys reacted to a post in a topic:
Algobox required
-
 ⭐ RichardGere reacted to a post in a topic:
Elliott Wave International’s Educational Video Series
⭐ RichardGere reacted to a post in a topic:
Elliott Wave International’s Educational Video Series
-
owh5v reacted to a post in a topic:
Elliott Wave International’s Educational Video Series
-
No, didnt see any news on TV.🤪
-

Anyone can educate with Viper Trading Indicator?
Ninja_On_The_Roof replied to Tasfy's topic in Ninja Trader 8
What help are you requiring? -
My good friend, which method do you recommend? Have you also worked with the science of lunar numbers and achieved results?
-

Elliott Wave International’s Educational Video Series
⭐ Minion replied to fdd2k2's topic in Forex Clips & Movies
This is the magnet link magnet:?xt=urn:btih:2899210ec3555886147ca6b9c432d4d3d77a6589&dn=Elliott+Wave+Educational+Video+Series&tr=udp://tracker.openbittorrent.com:80&tr=udp://tracker.opentrackr.org:1337/announce but I don't know if it still works (it is 9 years old, and unfortunately lots of torrents don't last so long) -
⭐ nadjib reacted to a post in a topic:
Lunar Vibrations
-
I HAVE USE IT AND MANY TIME IT WORKING MOON
-
⭐ Aurel88 reacted to a post in a topic:
Algobox required
-
i was trading forex peru for a long time, advice with demo hours is rlly golden, start with demo, for example with 100 dollars, take REAL 100 dollars and put them away, if you lose demo dollars, you still have yours, if you win you get experience, after some time you can invest money that you saved and play real forex
-
 rozveild joined the community
 -
fxtrader99 reacted to a post in a topic:
Investors be aware: Copy Trading Investment Scam
-

HFMarkets (hfm.com): Market analysis services.
AllForexnews replied to AllForexnews's topic in Fundamental Analysis
[b]Date: 25th July 2025.[/b] [b]Euro Strength Persists Amid ECB’s Temporary Policy Pause.[/b] The best-performing currency of 2025 is the Euro and continues to gain after the European Central Bank’s rate decision. After the ECB’s rate decision and press conference, the currency rose in value against all currencies. This also includes the Australian Dollar, which has seen the strongest gains this week so far. Why is the Euro witnessing strong gains despite multiple rate cuts, and what has the ECB said about the Euro’s strength? The Euro's Gains In 2025 The best-performing currencies in 2025 have been the Euro and Swiss Franc, which have both seen multiple rate cuts. Traditionally, currencies witnessing a dovish monetary policy tend to experience a weakening currency. So what is different here? The main reasons for the bullish price movement fall into three categories: European Fiscal Policy Portfolio Flow and Euro Hedges US Dollar Weakness These three factors are overpowering the negative impact of the lower interest rates. The European Union in 2025 has changed its fiscal policy rules related to borrowing and stimulus programs related to defence spending. Most investors deem this as a turn towards a fiscal expansionary policy while not triggering budget deficit concerns. One of the stimulus fund programs which are in the spotlight is the $500 billion German Fund, which aims to boost infrastructure and defence. In addition to this, global investors are looking to spread the risk of overexposure to US equities. As a result, the natural alternatives are European stocks such as the DAX, Euro Stoxx 50 and CAC. As interest in these stocks grows, demand for the euro increases as well. Furthermore, companies still investing in US indices are now using the Euro to hedge against the risks of a weakening Dollar, which could result in gains from the original investment. Previously, due to Dollar's strength, this was not practised with US Equity Investments. European Equity demand and euro-hedge positions are also increasing the demand for the Euro, and this also ties in with a weaker US Dollar. The US Dollar is currently the weakest currency of 2025, declining more than 9.50%. The main concern for investors is the trade policy uncertainty and the worsening US fiscal deficit. Investors are turning to the Euro as an alternative. The Euro Central Bank’s Rate Decision and Press Conference As European inflation is under control, the European Central Bank is likely to continue cutting interest rates in 2025. The main reason for the pause is uncertainty before the trade negotiations deadline on August 1st. Due to this, the ECB opted to keep the Main Refinancing Rate at 2.15%. President Lagarde noted that although inflation expectations are ‘firmly anchored’ near 2%, there are risks in both directions. Investors also note that the ECB President voiced concern over the risk of the Euro becoming too expensive and its domino effect on the economy. Many experts believe this also indicates the ECB would like to cut by at least a further two occasions. EURNZD - Technical Analysis and Major Gains EURNZD 4-Hour Chart The Euro is witnessing its strongest gains against the New Zealand Dollar. The EURNZD fell to a key support level and also formed a double bottom. As a result, the Euro quickly gained bullish momentum and continued to rise on Friday. The price of the EURNZD is trading above the 75-bar EMA and in the ‘buy’ zone of most oscillators. In addition to this, the exchange has been forming higher highs and lows on smaller timeframes. Moreover, the exchange rate remains below the major resistance levels while maintaining momentum. Resistance levels can currently be seen at 1.95830 and 1.96475. Key Takeaway Points: The Euro is 2025's top-performing currency, gaining despite multiple ECB rate cuts. Strong European fiscal policy and stimulus programs are boosting investor confidence in the Euro. Investors are shifting to European equities and using the Euro to hedge against a weakening US Dollar. The ECB held rates at 2.15% but signalled more interest rate cuts in 2025. [b]Always trade with strict risk management. Your capital is the single most important aspect of your trading business.[/b] [b]Please note that times displayed based on local time zone and are from time of writing this report.[/b] Click [url=https://www.hfm.com/hf/en/trading-tools/economic-calendar.html][b]HERE[/b][/url] to access the full HFM Economic calendar. Want to learn to trade and analyse the markets? Join our webinars and get analysis and trading ideas combined with better understanding of how markets work. Click [url=https://www.hfm.com/en/trading-tools/trading-webinars.html][b]HERE[/b][/url] to register for FREE! [url=https://analysis.hfm.com/][b]Click HERE to READ more Market news.[/b][/url] [b]Michalis Efthymiou HFMarkets[/b] [b]Disclaimer:[/b] This material is provided as a general marketing communication for information purposes only and does not constitute an independent investment research. Nothing in this communication contains, or should be considered as containing, an investment advice or an investment recommendation or a solicitation for the purpose of buying or selling of any financial instrument. All information provided is gathered from reputable sources and any information containing an indication of past performance is not a guarantee or reliable indicator of future performance. Users acknowledge that any investment in Leveraged Products is characterized by a certain degree of uncertainty and that any investment of this nature involves a high level of risk for which the users are solely responsible and liable. We assume no liability for any loss arising from any investment made based on the information provided in this communication. This communication must not be reproduced or further distributed without our prior written permission. -
 Croota48 joined the community
 -

Forex Basics 4 Advanced&Beginner Traders
binaryowner replied to StefGrig's topic in General Forex Discussions
I’d say starting with trend following using moving averages or RSI is solid. My experience with HFM shows that combining a demo account with strict risk rules builds very good foundations quickly -
Hello Thanks, unfortunately I only work with MetaTrader 4. Can you code for MetaTrader 4? But regarding the moon method, I have also worked with 27 days, but these (Full Moon/Waxing Moon/New Moon/Waning Moon)did not work, It does not work in a month.These are just events that become more intense when you calculate a phenomenon close to these. . Even based on the combination of the moon angle with other planets, you may get about 40% of the answer. I have not tried the three methods because I do not know them. 1. Olga's method in the video above 2. The numerical method of the moon. I only know that this method uses the moon itself and not its combinations with other planets. 3. The method of the nakashtara.
-
 setare reacted to a post in a topic:
Lunar Vibrations
setare reacted to a post in a topic:
Lunar Vibrations
-

Market Technical Analysis by RoboForex
RBFX Support replied to RBFX Support's topic in Technical Analysis
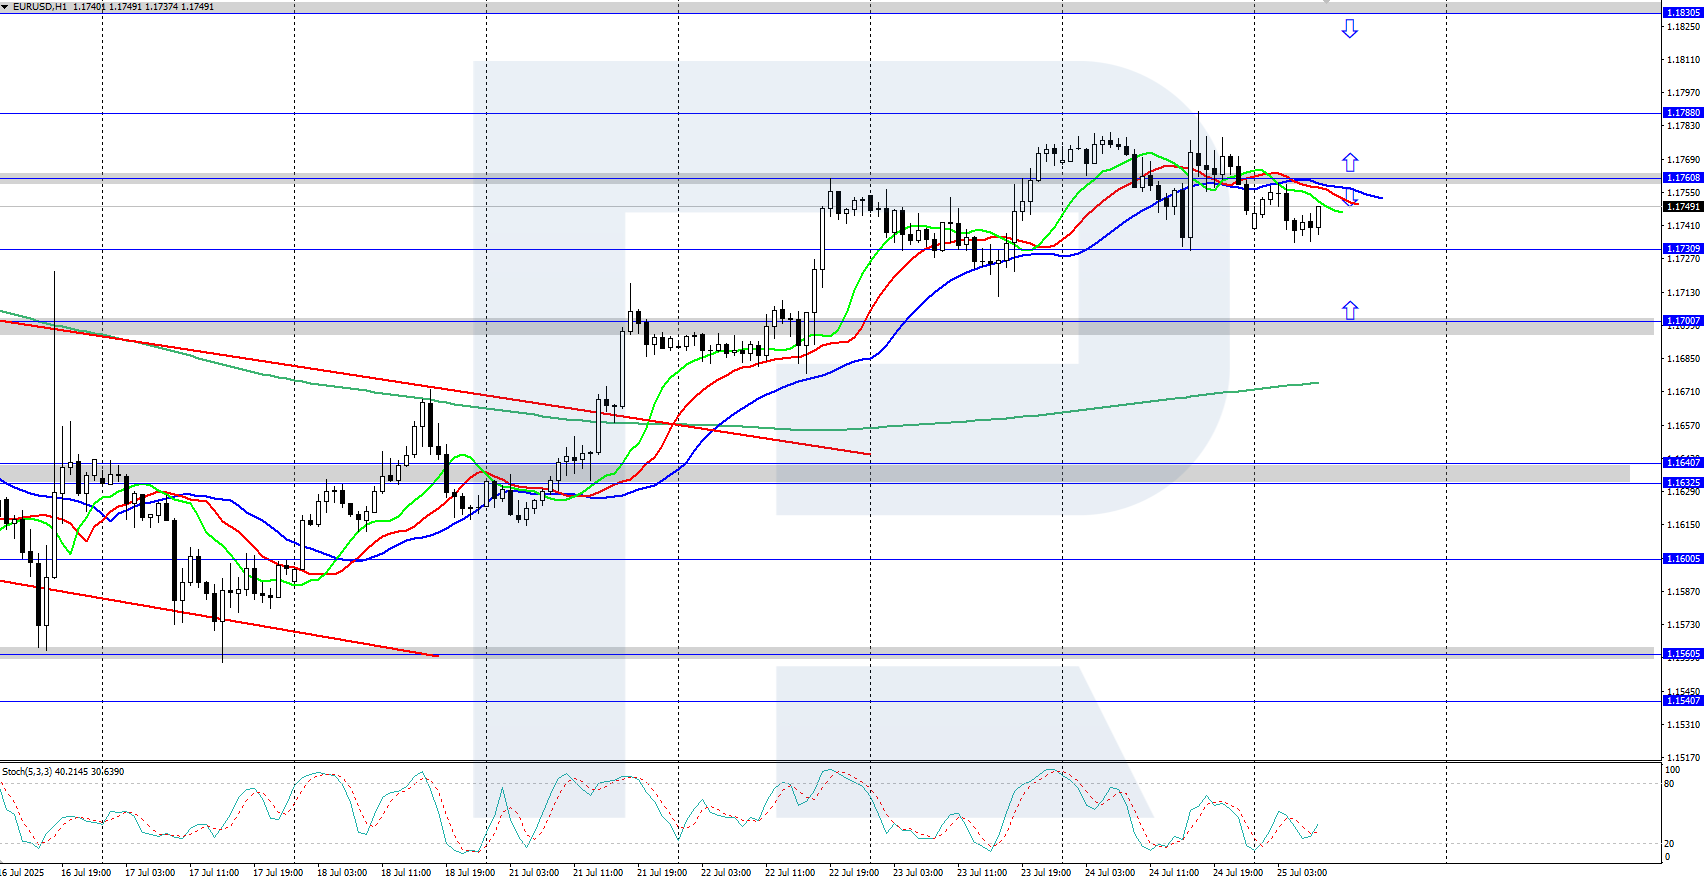
EURUSD declines after ECB decision The EURUSD rate corrected towards the 1.1730 area following the ECB's decision to keep interest rates unchanged. The market awaits the outcome of trade agreement negotiations between the US and the EU. Find out more in our analysis for 25 July 2025. EURUSD technical analysis On the H4 chart, EURUSD is undergoing a downward correction, falling this morning to the 1.1730 area, with further decline towards the 1.1700 support level possible. The daily trend for the pair remains upward, so after the correction ends, the rally may continue. The EURUSD pair corrected to the 1.1730 area following the ECB’s decision to leave rates unchanged. Read more - EURUSD Forecast Attention! Forecasts presented in this section only reflect the author’s private opinion and should not be considered as guidance for trading. RoboForex bears no responsibility for trading results based on trading recommendations described in these analytical reviews. Sincerely, The RoboForex Team
-
roboforex Market Fundamental Analysis by RoboForex
RBFX Support replied to RBFX Support's topic in Fundamental Analysis
The Fed exposed! Azoria Capital demands transparency – what is next for XAUUSD Amid a lawsuit against the Federal Reserve and deteriorating US economic indicators, XAUUSD may test the 3,420 USD level. Discover more in our analysis for 25 July 2025. XAUUSD forecast: key trading points Azoria Capital filed a lawsuit against the US Federal Reserve US durable goods orders: previously at 16.4%, projected at -10.4% XAUUSD forecast for 25 July 2025: 3,420 Fundamental analysis Today’s XAUUSD analysis shows that gold is trading around 3,358 USD per ounce, pulling back after reaching the 3,431 USD resistance level earlier this week. Azoria Capital, a financial management company, has filed a lawsuit against the Federal Reserve, including Chairman Jerome Powell and other central bank officials. The claim argues that the Fed violates the 1976 federal law by holding closed meetings on interest rate decisions. Azoria Capital demands that all such meetings be made public starting next week. RoboForex Market Analysis & Forex Forecasts Attention! Forecasts presented in this section only reflect the author’s private opinion and should not be considered as guidance for trading. RoboForex bears no responsibility for trading results based on trading recommendations described in these analytical reviews. Sincerely, The RoboForex Team -
Moon Cycles: If it can be useful to someone, I insert here the formulas: in Easylanguage (for Tradestation and Multicharts), for Amibroker and Metastock. ---------------------------------------------------------------------------- Lunar Cycles for Tradestation and Multicharts: for Full Moon Cycles, obviously changing the dates, you can insert also the New Moon Cycles. LUNARCYCLE: Plots a dot every 27 days, so if you type a full moon date as the input, it will continue to show you full moon days. Note: Date should be entered as YYMMDD. --------------------------------------------------------------------------- Function: LUNARCICLE [LegacyColorValue = true]; Input: MOON1(Numeric); LUNARCICLE = INTPORTION((DATETOJULIAN(DATE) - DATETOJULIAN(MOON1)) / 27) ----------------------------------------------------------------------------- Indicator: [LegacyColorValue = true]; INPUT:VALUE(960305); VALUE1 = LUNARCICLE(VALUE); IF VALUE1 > VALUE1[1] THEN PLOT1(H,"FULLMOON"); ---------------------------------------------------------------------------------- To be included in the: ShowMe: {Full_Moon} Vars:AstroJul(0),Phase(0); AstroJul =DateToJulian(Date)+ 2415019 ; Print("Date",Date); Phase = (AstroJul+4.867) / 29.53059 ; Phase = FracPortion(Phase); Print("Phase",Phase); If Phase >= 0.90 then print("Full Moon"); If Phase >= 0.5 and phase <= 0.90 then print("Waxing Moon"); If Phase >= 0.47 and phase <= 0.5 then print( "New Moon"); If Phase <= 0.5 and Phase >= 0.2 then print("Waning Moon"); If Phase >=0.90 then Plot1(High,"SHOWME"); ----------------------------------------------------------- {New_Moon} Vars:AstroJul(0),Phase(0); AstroJul =DateToJulian(Date)+ 2415019 ; Print("Date",Date); Phase = (AstroJul+4.867) / 29.53059 ; Phase = FracPortion(Phase); Print("Phase",Phase); If Phase >= 0.90 then print("Full Moon"); If Phase >= 0.5 and phase <= 0.90 then print("Waxing Moon"); If Phase >= 0.47 and phase <= 0.5 then print( "New Moon"); If Phase <= 0.5 and Phase >= 0.2 then print("Waning Moon"); If Phase >=0.45 and phase <= 0.52 then Plot1(High,"SHOWME"); ====================================================================================== Lunar Cycles for AmiBroker: _SECTION_BEGIN( "Price Chart" ); SetChartOptions( 0, chartShowArrows | chartShowDates ); //GraphXSpace = 5; Y = SelectedValue(Year()); M = SelectedValue(Month()); D = SelectedValue(Day()); Hr = SelectedValue(Hour()); Mn = SelectedValue(Minute()); // normalize values to range 0...1 function normalize( Val ) { Val = Val - floor( Val ); if (Val < 0) {Val = Val + 1;} return Val; } // Set Pi. PI = 3.1415926535897932385; // calculate the Julian Date at 12H UT YY = Y - floor( ( 12 - M ) / 10 ); MM = M + 9; if (MM >= 12) {MM = MM - 12;} K1 = floor( 365.25 * ( YY + 4712 ) ); K2 = floor( 30.6 * MM + 0.5 ); K3 = floor( floor( ( YY / 100 ) + 49 ) * 0.75 ) - 38; JD = K1 + K2 + D + 59; // for dates in Julian calendar if (JD > 2299160) {JD = JD - K3;} // for Gregorian calendar // calculate moon's age in days IP = normalize( ( JD - 2451550.1 ) / 29.530588853 ); AG = IP*29.53; Phase = "NEW"; if (AG < 27.68493) {Phase = "Waning crescent";S1=4;S2=8;} if (AG < 23.99361) {Phase = "Last quarter";S1=4;S2=12;} if (AG < 20.30228) {Phase = "Waning gibbous";S1=6;S2=14;} if (AG < 16.61096) {Phase = "FULL";S1=6;S2=15;} if (AG < 12.91963) {Phase = "Waxing gibbous";S1=6;S2=7;} if (AG < 9.22831) {Phase = "First quarter";S1=2;S2=3;} if (AG < 5.53699) {Phase = "Waxing crescent";S1=2;S2=1;} if (AG < 1.84566) {Phase = "NEW";S1=0;S2=0;} IP1 = IP; IP = IP*2*PI; // Convert phase to radians // calculate moon's distance DP = 2*PI*normalize( ( JD - 2451562.2 ) / 27.55454988 ); DI = 60.4 - 3.3*cos( DP ) - 0.6*cos( 2*IP - DP ) - 0.5*cos( 2*IP ); // calculate moon's ecliptic latitude NP = 2*PI*normalize( ( JD - 2451565.2 ) / 27.212220817 ); LA = 5.1*sin( NP ); // calculate moon's ecliptic longitude RP = normalize( ( JD - 2451555.8 ) / 27.321582241 ); LO = 360*RP + 6.3*sin( DP ) + 1.3*sin( 2*IP - DP ) + 0.7*sin( 2*IP ); Zodiac = "Pisces"; if (LO < 348.58) {Zodiac = "Aquarius";} if (LO < 311.72) {Zodiac = "Capricorn";} if (LO < 302.49) {Zodiac = "Sagittarius";} if (LO < 271.26) {Zodiac = "Scorpio";} if (LO < 242.57) {Zodiac = "Libra";} if (LO < 224.17) {Zodiac = "Virgo";} if (LO < 173.34) {Zodiac = "Leo";} if (LO < 135.30) {Zodiac = "Cancer";} if (LO < 119.48) {Zodiac = "Gemini";} if (LO < 93.44) {Zodiac = "Taurus";} if (LO < 51.16) {Zodiac = "Aries";} if (LO < 33.18) {Zodiac = "Pisces";} Plot( C, "Close", colorBrightGreen, styleNoTitle | ParamStyle( "Style" ) | GetPriceStyle() ); _N(Title = Name() + " - " + Date() + " Open " + C + " High " + H + " Low " + L + " Close " + C + "\n" + "Age: " + AG + " Phase: " + Phase + "\n" + "Distance: " + DI + " earth radii ecliptic\n" + "Latitude = " + LA + "°\n" + "Longitude = " + LO + "°\n" + "Constellation = " + Zodiac+ "\n" + "IP: " + IP1); _SECTION_END(); _SECTION_BEGIN("Lunar Cycle"); // Input your local time zone TZ=Param("Your local Time Zone? [-12 to +12hrs]",5.5, -12,12,1); // Lunar cycle LunarMonth=29.530589; Offset=7.254621; // Calendar } leap=frac(Year( )/4)==0 AND frac(Year()/ 100)!=0 OR frac(Year()/ 400)==0; y=Year()*365+ int(Year( )/4)-int( Year()/100) +int(Year( )/400); m= IIf(Month()==2,31-leap, IIf(Month()==3,59, IIf(Month()==4,90, IIf(Month()==5,120, IIf(Month()==6,151, IIf(Month()==7,181, IIf(Month()==8,212, IIf(Month()==9,243, IIf(Month()==10,273, IIf(Month()==11,304, IIf(Month()==12,334, -leap))))))) )))); CurrentDay=y+ m+Day()-TZ/ 24-Offset; // Full Moon } FM=frac(CurrentDay/ LunarMonth) ; FM=PeakBars( FM, 1, 1)==0; // New Moon } NM=frac((CurrentDay +LunarMonth/ 2)/LunarMonth) ; NM=PeakBars( NM, 1,1)==0; FullMoon=FM-NM==1; NewMoon=FM-NM==-1; //Plot Moon Phase on main chart MC = ParamToggle("Moon Cycle","Show|Hide",0); shape = IIf(FullMoon,shapeCircle+shapePositionAbove,IIf(NewMoon,shapeCircle+shapePositionAbove,Null)); if(MC==1) PlotShapes(shape,IIf(FullMoon,colorWhite,colorYellow),0,H); _SECTION_END(); ============================================================================================================== Lunar Cycles for Metastock: {Lunar cycles - by Jose Silva} {Full/New/Q1/Q3 Moon signals indicator Mk XV. Plots: +1 signal on Full Moon; -1 on New Moon; +0.5 on first Quarter; -0.5 on last Quarter. Accurate to within 2 hours every 19 years. Signals that fall on holidays or weekends are plotted on the next trading day. Use the signal advance input to view approaching signals. Adj lunar signals to market's local Time Zone (generally add 1hr for Daylight Saving Time): New Zealand: +12hrs Australia: +10 Japan: +9 SE Asia: +8 Thai/Indonesia: +7 India: +5.5 Dubai: +4 Moscow: +3 Europe: +1 UK & Portugal: 0 USA, NY: -5 Chicago: -6 http://www.travel.com.hk/region/timezone.htm Copyright © 2001-2009 Jose Silva. The grant of this license is for personal use only - no resale or repackaging allowed. All code remains the property of Jose Silva.} { User inputs } TZ:=Input("Market's local Time Zone? [-12hrs to +12hrs]",-12,12,-5); shift:=Input("Advance signal by x calendar days",-30,30,0); plot:=Input("Plot Q1 and Q3 (half) signals? [1]Yes, [0]No",0,1,0); { Lunar cycle length in days (synodic month) } LunarMonth:=29.53059; offset:=4.86; { Calendar engine } y:=Year()-(Month()<3); leap:=Int(y/4)-Int(y/100)+Int(y/400); mth:=Int((2+153*(Month()-3+12*(Month()<3)))/5); dayNr:=DayOfMonth()+mth+y*365+leap-657382 -offset-TZ/24+shift; { New/Q1/Full/Q3 Moon cycles } NM:=Frac((DayNr+LunarMonth/2)/LunarMonth); Q1:=Frac((DayNr+LunarMonth/4)/LunarMonth); FM:=Frac(DayNr/LunarMonth); Q3:=Frac((DayNr-LunarMonth/4)/LunarMonth); { Lunar cycle signals } cycle:=FM-NM; FM:=cycle<0 AND Alert(cycle>0,2); NM:=-(cycle>0 AND Alert(cycle<0,2)); cycle:=Q1-Q3; Q1:=(cycle<0 AND Alert(cycle>0,2))*.5; Q3:=(cycle>0 AND Alert(cycle<0,2))*-.5; signals:=If(plot=1,NM+Q1+FM+Q3,NM+FM); { Plot Lunar signals in own window } signals ------------------------------------------------------------------------------------
-
Hello Who knows this method or has worked with it? https://www.youtube.com/watch?v=v0BhlY6dPP0&t=18s Has anyone worked on the market by calculating the moon through numerology, although they did not get accurate results? The combination of the moon, such as the new moon and the full moon, or the combination of the angle of the moon with the sun, Saturn, Mercury, and astrology, I do not mean just the moon itself and numerology. I even think they trade with the houses of the moon nakshatras but I don't know how. Is there anyone who can send a book or source on this? (The moon has 28 houses of nakshatras but how should one trade by understanding these 28 houses?)
-

Olga Morales, Astrology For Gann Traders Advanced level
setare replied to poli's topic in Forex Clips & Movies
up -
Hello, I require Gary Dayton Deep Practice videos, 6 weeks to turn fear to profits course. If anyone has these kindly help. Thanks a lot.
-
Karmaloop reacted to a post in a topic:
H.FT_S.PECTRE_L.ITE_V2.1
-
fxzero.dark reacted to a post in a topic:
Interesting bots
-
Has anyone come across this one? Specifically looking for quantsniper and quantfalcon.
- Yesterday
-
jquiroz75 reacted to a post in a topic:
Interesting bots
-
 stephy365 joined the community
 -

Anyone can educate with Viper Trading Indicator?
roddizon1978 replied to Tasfy's topic in Ninja Trader 8
I need your help for this 2 scammers before I post more, 8 more videos to go Posted yesterday at 02:14 PM (edited) -
Anyone can educate with Viper Trading Indicator?
roddizon1978 replied to Tasfy's topic in Ninja Trader 8
My trade today -
bump
-
I had this happened on a bot I tested (and decided not to use for various reasons!) a while back. This happens when the strategy sync's the strategy position with the live position ignoring the time it was enabled (when actually the trade was well past the point of entry). So a trade based on past signal would be entered as a new trade when we enable the strategy which is bad and needs fixing! It should wait for a new signal to enter trade after enabling, and not enter a trade based on a past signal immediately upon enabling! Apparently it was a minor fix according to a developer in a chat back then...
-
can u share file please?