All Activity
- Past hour
-
Old but good alternative to Optuma. Other are Market Warrior and Timing Solutions
- Today
-
Just try this: random trades with 1:1 risk reward (eg 20 pips sl : 20 pips tp) on any low spread pair. You will be around zero on the long term whatever you do (minus the spread). meaning with proper risk management you already made sure you won't blow your account. Now can you do even a little bit better than complete random, blind trading? If yes, you make money. Even with a simple MA200 you can gain edge. The problem is, most traders are not satisfied with the kind of money they can safely make on the markets. They want to become millionaire overnight.
-
Dont waste your time with it
-
 ampf reacted to a post in a topic:
bestorderflow.com Joint Purchase
ampf reacted to a post in a topic:
bestorderflow.com Joint Purchase
-
Welcome to Indo-Investasi.com. Please feel free to browse around and get to know the others. If you have any questions please don't hesitate to ask.
-

Need a copy of Future Analytica L2Azimuth
shorttrader replied to roddizon1978's topic in Ninja Trader 8
Does L2Azimuth works? -
I've logged hundreds of demo hours with HFM before going live. Treating demo funds like real capital built the discipline that saved me from blowing up early on
-
Welcome to Indo-Investasi.com. Please feel free to browse around and get to know the others. If you have any questions please don't hesitate to ask.
-

HFMarkets (hfm.com): Market analysis services.
AllForexnews replied to AllForexnews's topic in Fundamental Analysis
[b]Date: 10th July 2025.[/b] [b]Will The Dow Jones Rebound Ahead Of Next Week’s Earnings?[/b] The second quarter's earnings season is likely to impact the Dow Jones most among US indexes during its first days. Earnings Season is due to start on July 15th, starting this the banking sector, which makes up almost 18% of the Dow Jones. Currently, the Dow Jones is trading significantly lower than other indices, only edging up 4.85% in 2025 so far. Investors are contemplating if this is likely to change in the upcoming week. Dow Jones And Earnings Season During the first week of earnings season, the Dow Jones will see quarterly reports from JP Morgan, Goldman Sachs and Johnson&Johnson. Investors are particularly focused on the quarterly earnings report from Goldman Sachs. Goldman Sachs is the most influential stock for the Dow Jones, holding a weight of 9.63%. Dow Jones 2-Hour Chart Goldman Sachs stocks have risen 21% in 2025 so far and have been one of the best-performing stocks for the Dow Jones. Zacks Investment Research, based on a survey of 7 analysts, forecasts a consensus earnings per share (EPS) of $9.37 for this quarter. The figure is up from the $8.62 EPS made public for the same quarter last year. The company has also beat its earnings expectations over the past 3 quarters. JP Morgan will be the first company to release its quarterly earnings report. JP Morgan stocks are currently up 18% in 2025 and have beaten its earnings expectations over the past 4 quarters. In addition to this, Johnson&Johnson will also release their quarterly report on Thursday, but only holds a weight of 2.19%. The performance of the Dow Jones will significantly depend on the performance of the 3 quarterly earnings reports. If all 3 companies confirm higher-than-expected earnings, the Dow Jones is likely to witness buy signals from both technical and fundamental analysis. FOMC And Trade Dampening Market Sentiment Even though earnings season and the upcoming reports from the banking sector may prompt a rebound, the Dow Jones is currently trading lower. This is largely due to trade tensions, which remain unchanged. More on this can be found in yesterday’s article. However, some positive developments could be seen from yesterday’s FOMC Meeting Minutes. According to the Meeting Minutes, the Federal Reserve is split between when they should cut and how frequently cuts should be in the second half of 2025. Some members of the committee believe refraining from cuts would be appropriate due to trade policy uncertainties. Their fear is that tariffs and supply disruptions will trigger higher prices and inflation. On the other hand, the number of members leaning towards a rate cut is increasing. Although it is also important for traders to note that the dovish members of the Federal Reserve are siding with rate cuts due to weaknesses within the employment sector. The meeting took place before last week’s US NFP data. Therefore, their fear may have cooled since the better-than-expected employment data, such as the unemployment rate declining to 4.1%. Nonetheless, the possibility of a September ‘pause’ has fallen from 35% to 28% according to the FedWatch Tool. This is positive for the Dow Jones and stocks in general. Dow Jones - Price Analysis Currently, the Dow Jones is trading lower during this morning’s Asia Session, but continues to remain higher than the 75-period moving average. The fact that the price is still above the moving average and the RSI is also forming higher lows will possibly indicate that buyers may still reenter the market. If the price increases above $44,398.45, buy signals may potentially materialise. Dow Jones 5-Minute Chart Key Takeaway Points: The Dow Jones’ rebound will heavily depend on strong Q2 earnings from major banks like JPMorgan and Goldman Sachs. Earnings to start on July 15th. Goldman Sachs, the Dow's most influential stock, has seen its shares rise 21% in 2025, and analysts project it will report strong Q2 earnings. The Federal Reserve is split on rate cuts, as inflation concerns weigh against arguments for cuts due to employment weakness. Despite current minor dips, the Dow's position above its moving average and positive RSI suggest potential buyer re-entry and a possible rally if it surpasses $44,398.45. [b]Please note that times displayed based on local time zone and are from time of writing this report.[/b] Click [url=https://www.hfm.com/hf/en/trading-tools/economic-calendar.html][b]HERE[/b][/url] to access the full HFM Economic calendar. Want to learn to trade and analyse the markets? Join our webinars and get analysis and trading ideas combined with better understanding of how markets work. Click [url=https://www.hfm.com/en/trading-tools/trading-webinars.html][b]HERE[/b][/url] to register for FREE! [url=https://analysis.hfm.com/][b]Click HERE to READ more Market news.[/b][/url] [b]Michalis Efthymiou HFMarkets[/b] [b]Disclaimer:[/b] This material is provided as a general marketing communication for information purposes only and does not constitute an independent investment research. Nothing in this communication contains, or should be considered as containing, an investment advice or an investment recommendation or a solicitation for the purpose of buying or selling of any financial instrument. All information provided is gathered from reputable sources and any information containing an indication of past performance is not a guarantee or reliable indicator of future performance. Users acknowledge that any investment in Leveraged Products is characterized by a certain degree of uncertainty and that any investment of this nature involves a high level of risk for which the users are solely responsible and liable. We assume no liability for any loss arising from any investment made based on the information provided in this communication. This communication must not be reproduced or further distributed without our prior written permission. -

Market Technical Analysis by RoboForex
RBFX Support replied to RBFX Support's topic in Technical Analysis
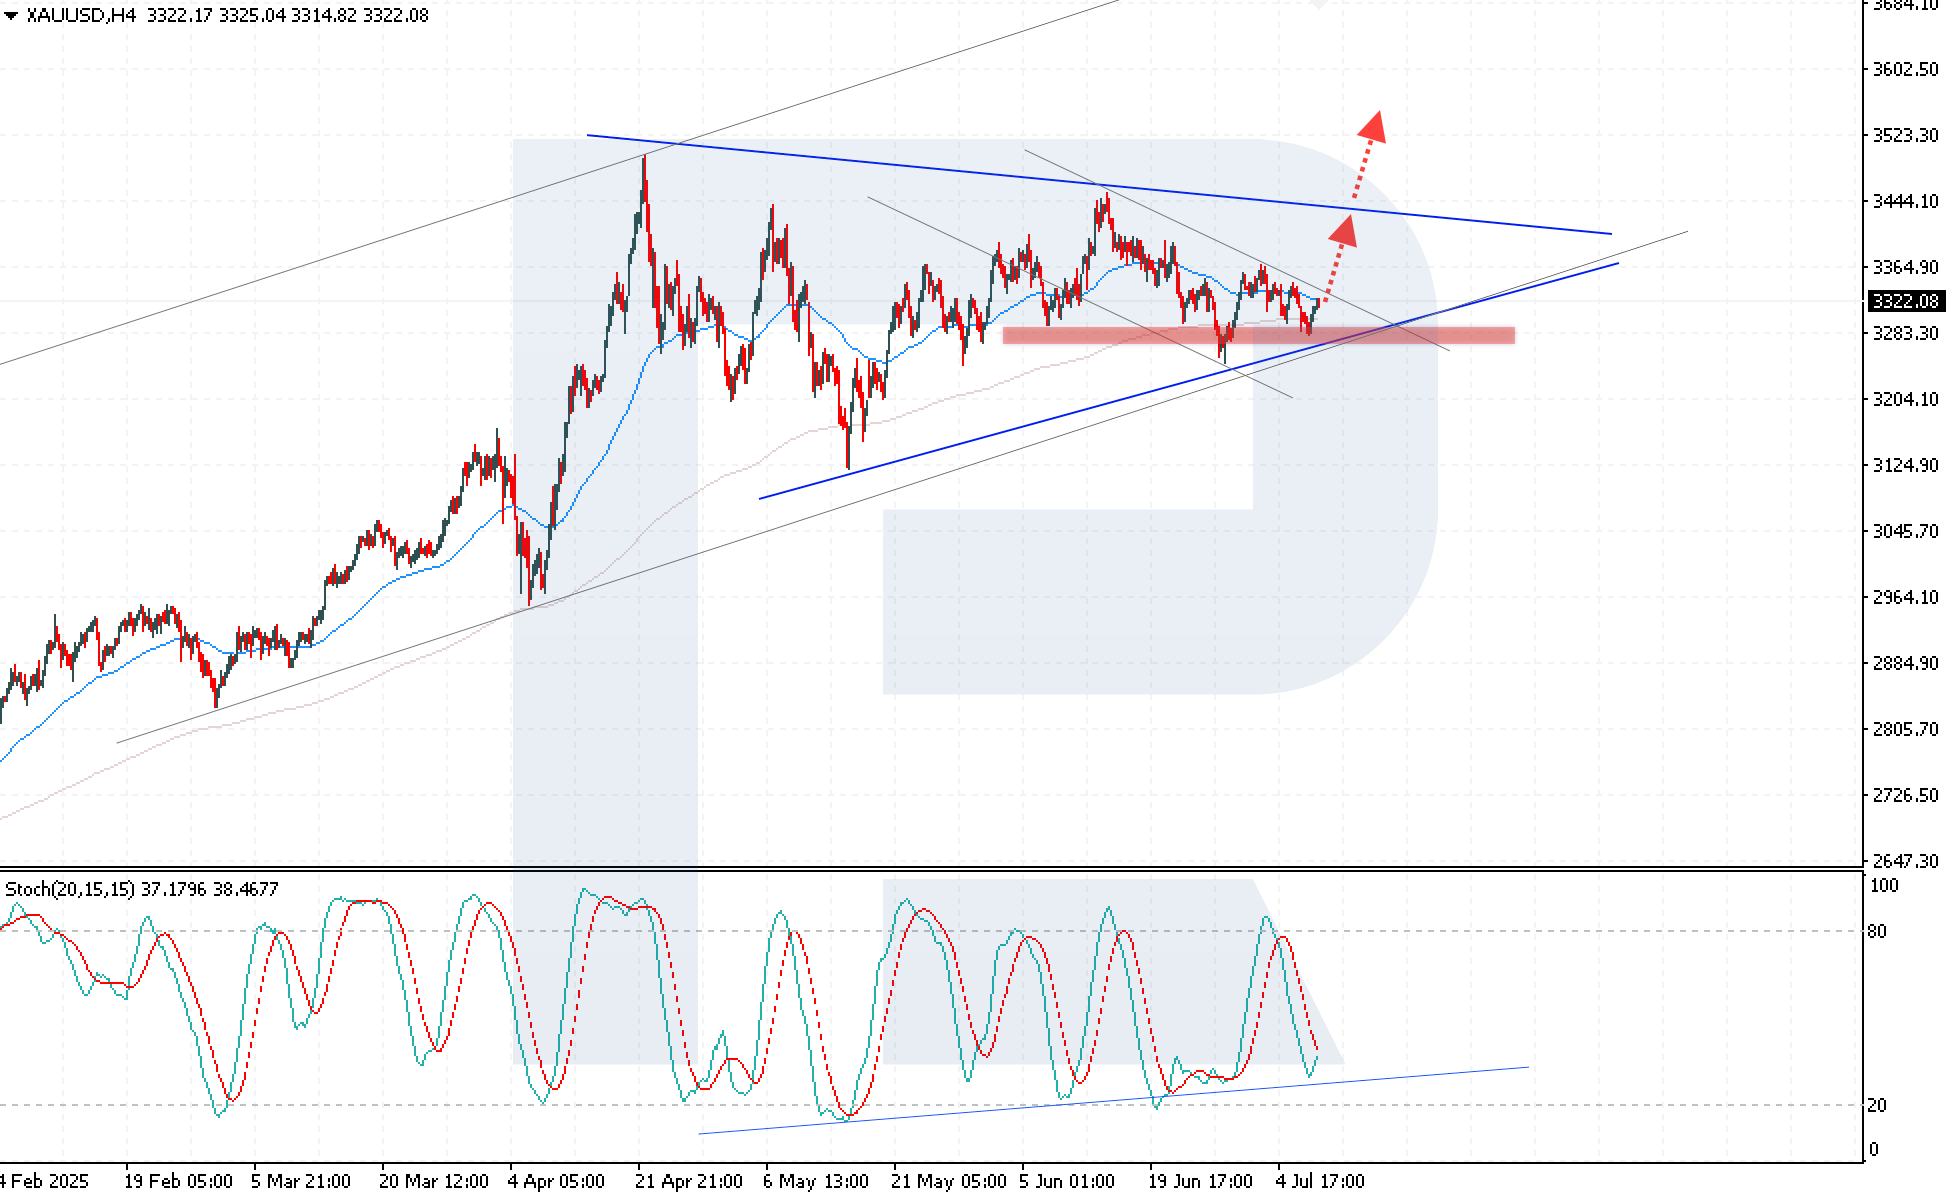
XAUUSD rises for the second day in a row – is a new upward wave starting? The XAUUSD price is forming a Triangle pattern, reflecting consolidation before a potential breakout. Current quote – 3,322 USD. Details – in our analysis for 10 July 2025. XAUUSD technical analysis XAUUSD quotes are strengthening after rebounding from the lower boundary of the Triangle pattern. Despite seller pressure in the first half of the week, the price is recovering, remaining above the key support level at 3,285. Weakness in the US dollar, expectations of rate cuts, and political pressure on the Fed create a favourable environment for further gold growth. Read more - Gold Forecast Attention! Forecasts presented in this section only reflect the author’s private opinion and should not be considered as guidance for trading. RoboForex bears no responsibility for trading results based on trading recommendations described in these analytical reviews. Sincerely, The RoboForex Team
-
roboforex Market Fundamental Analysis by RoboForex
RBFX Support replied to RBFX Support's topic in Fundamental Analysis
A surprise from the Fed and US: Brent heads towards 71.70 USD Brent oil quotes continue their upward trend and may test the 71.70 USD level. Details – in our analysis for 10 July 2025. Brent forecast: key trading points Brent oil price is forming a correction US initial jobless claims: previous value – 233,000, forecast – 236,000 Brent forecast for 10 July 2025: 71.70 Fundamental analysis The fundamental analysis for Brent today, 10 July 2025, takes into account that the Brent price, having updated June's highs, rose to 77.75 USD per barrel before forming a correction. At this stage, quotes remain around 69.70 USD. US initial jobless claims for 10 July are forecast to rise to 336,000. The increase compared to the previous period is not critical but higher unemployment negatively affects purchasing power and may impact energy demand. RoboForex Market Analysis & Forex Forecasts Attention! Forecasts presented in this section only reflect the author’s private opinion and should not be considered as guidance for trading. RoboForex bears no responsibility for trading results based on trading recommendations described in these analytical reviews. Sincerely, The RoboForex Team -
 hosamezzat joined the community
 -
 arunkb31 joined the community
 -

Introduction To Online Forex Trading
arabitech replied to StefGrig's topic in General Forex Discussions
Leverage can be a powerful tool so we need to learn how to use if effectively since it can also lead to losses when the market conditions are uncertain or we are opposite to the trade we took with high leverage. -
kkreg reacted to a post in a topic:
tradingorderflow.com
-
What are the main features of the best crypto exchange?
arabitech replied to Malenasanz's topic in Cryptocurrencies
Also they do no not list bad or low value projects to their exchange which later sweep investor's money after pumping and then dumping. -
I find these indicators interesting. Any progress with them? I found an older version but can't get it to work. https://workupload.com/file/uPY8EX23X6h
-
I totally agree , this seems like a valuable set of indicators that can help a lot. Brokey is a very good educator and he stands behind his products. I support this GB. Traderbeauty-Jane
- 1 reply
-
- 1
-
-
I have been talking with @Traderbeauty that supports this joint purchase and brokey is willing to make a discount price for bestorderflow pack 1+2+3 (no MBO). MBO is not available yet however brokey has told me that when he have it will provide it without extra cost. Indicators that currently is being sold for 90usd and wanted to know who here would be interested and what would be a fair price to present to brokey for each license. I think this is an opportunity to have some great indicators that one of the kind currently. We are talking indicators that look to the level 2 data and that lets us see where the big players are before the move happens.
-
Looking for EDU version of Arc-Ai Striker Trading System if anyone could kindly share? Thanks!
- Yesterday
-
I thought this was already educated.
-
we can exchange viper trading and ofl....I have ofl educated...i found the educated version of viper trading missing some script to run viper trading...
-
eddygarod reacted to a post in a topic:
HFT WarHammer Unlocked
-
Should be pretty straight forward, it loads as an indicator instead of a strategy. Use the HFT bars on a 30 setting and set your SL/TP to your accepted risk level. Here's a video of it running. https://www.youtube.com/watch?v=2yROeWQJPyU
-
HFMarkets (hfm.com): Market analysis services.
AllForexnews replied to AllForexnews's topic in Fundamental Analysis
[b]Date: 9th July 2025.[/b] [b]Symmetrical Triangle Support: Gold Rebound Imminent?[/b] Gold’s price comes under pressure for a fourth day, primarily due to positive US data and a stronger Dollar. The US employment data from the previous week is the main driver of a weaker price as rate cuts become less likely and sentiment rises. Though both technical and fundamental analysts are contemplating whether the trend will suddenly change. Gold Continues to Decline The bearish price movement came after surprisingly positive employment data on July 3rd. The latest employment report revealed robust growth, with the NFP change expanding by 147,000. This figure far surpassed the 111,000 forecast and even exceeded May's 144,000, largely attributed to significant hiring in the civil service (73,000) and healthcare (39,000). As a result, the Unemployment Rate edged down to 4.1%, though Average Hourly Earnings saw a marginal decrease. Gold has also come under pressure from the strengthening US Dollar and the Federal Reserve. The US Dollar Index has risen more than 1% over the past week, pressuring Gold due to its inverse correlation. The market also now expects a more hawkish Federal Reserve and this can be seen through indications available by stock exchanges. For example, the Chicago exchange previously stated a 6% possibility of an interest rate pause in September. That figure has now risen to 34%. Although traders should note that this may change depending on tonight's FOMC Meeting Minutes. Gold price movement will also depend on the current developments within the Oil market, geopolitics, earnings season and the US trade policy. What Could Trigger Gold to Rebound? While geopolitical tensions seem to be improving, other factors suggest potential for an upside. Crucially, ongoing geopolitical tensions, particularly concerning Iran's nuclear program, remain a significant wild card. Any escalation could swiftly push Gold prices higher, as seen in the first 2 weeks of June 2025. According to analysts, this remains an issue as experts believe Iran will continue to enrich uranium and no agreement has been made with the US so far. In addition to this, despite minor deadline extensions from July 9th, the Trump administration's ongoing pursuit of new 25% tariffs on imports from Japan and South Korea (effective August 1st). This continues to generate significant market volatility and uncertainty, which if continues, may support Gold’s rebound. These impending tariffs are particularly impactful given both nations' considerable trade deficits with the US. Another major issue is the EU, which is yet to make an agreement in principle with the US. The US has proposed a deal to the EU with a 10% baseline tariff on most goods, offering exemptions for sectors like aircraft, spirits, and cosmetics. However, the U.S. is currently unwilling to exempt sensitive industries like cars, steel, and aluminium, which the EU has strongly requested. If no agreement is made, the ‘risk-off’ sentiment can support another bullish trend for Gold. Commodity Futures Trading Commission and Technical Analysis Show Symmetrical Triangle There's a strong preference for buying in all types of contracts. Investors who use actual money hold significantly more ‘buy’ positions (167,386 thousand) than ‘sell’ positions (36,902 thousand). Last week, buyers increased their holdings by 4,217 thousand deals, while sellers increased theirs by 1,925 thousand, confirming a global trend towards investment. In terms of technical analysis, most indicators continue to signal downward price movement. However, on the daily chart, the price is forming a symmetrical triangle pattern and trading at the support level. Therefore, traders will monitor if the price reacts to this support level and if the US Dollar weakens throughout the day. XAUUSD Daily Chart Key Takeaway Points: Gold's price is falling, driven by strong US job data, a strengthening US Dollar and low rate cut expectations. Geopolitical risks and new US tariffs could trigger a Gold rally if this escalates to trigger a risk-off sentiment. Gold's technical charts show a symmetrical triangle pattern, and the price is trading close to its support level. However, trend indicators point towards bearish momentum. Despite Trump’s extensions for trade agreements, the market remains cautious as no agreement has yet been made with Korea, Japan and the EU. [b]Always trade with strict risk management. Your capital is the single most important aspect of your trading business.[/b] [b]Please note that times displayed based on local time zone and are from time of writing this report.[/b] Click [url=https://www.hfm.com/hf/en/trading-tools/economic-calendar.html][b]HERE[/b][/url] to access the full HFM Economic calendar. Want to learn to trade and analyse the markets? Join our webinars and get analysis and trading ideas combined with better understanding of how markets work. Click [url=https://www.hfm.com/en/trading-tools/trading-webinars.html][b]HERE[/b][/url] to register for FREE! [url=https://analysis.hfm.com/][b]Click HERE to READ more Market news.[/b][/url] [b]Michalis Efthymiou HFMarkets[/b] [b]Disclaimer:[/b] This material is provided as a general marketing communication for information purposes only and does not constitute an independent investment research. Nothing in this communication contains, or should be considered as containing, an investment advice or an investment recommendation or a solicitation for the purpose of buying or selling of any financial instrument. All information provided is gathered from reputable sources and any information containing an indication of past performance is not a guarantee or reliable indicator of future performance. Users acknowledge that any investment in Leveraged Products is characterized by a certain degree of uncertainty and that any investment of this nature involves a high level of risk for which the users are solely responsible and liable. We assume no liability for any loss arising from any investment made based on the information provided in this communication. This communication must not be reproduced or further distributed without our prior written permission. -

REQ : Jigs@w Institutional Training Course
⭐ navigator replied to Bill A's topic in Learning Resources
Yes, they have a partnership. The Institutional course is provided by AXIA. -
please any one having working Fibonacci_Galactic_Trader ?? please upload new link
-
TradingView also has regular free to join contests with cash prices. They even provide free live data during the contest.
-
Videos, webinars etc are usually better for high-frequency trading, scalping strategies. Also podcasts to learn on the go. But for longer term swing trading strategies or risk management, trading mindset studies, books are absolutely fine in my opinion.