⤴️-Paid Ad- Check advertising disclaimer here. Add your banner here.🔥
All Activity
- Today
-
 Trader809 joined the community
 -
please share again brother i need this course
-
 japne66 joined the community
 -
 nikunj joined the community
 -
 raj1301 reacted to a post in a topic:
ai.thealgotrader.live
raj1301 reacted to a post in a topic:
ai.thealgotrader.live
-
 Hi, does anyone has version 2125 or 2126 for sharing please? Thanks.
 -
Playr101 reacted to a post in a topic:
ai.thealgotrader.live
-

Market Technical Analysis by RoboForex
RBFX Support replied to RBFX Support's topic in Technical Analysis
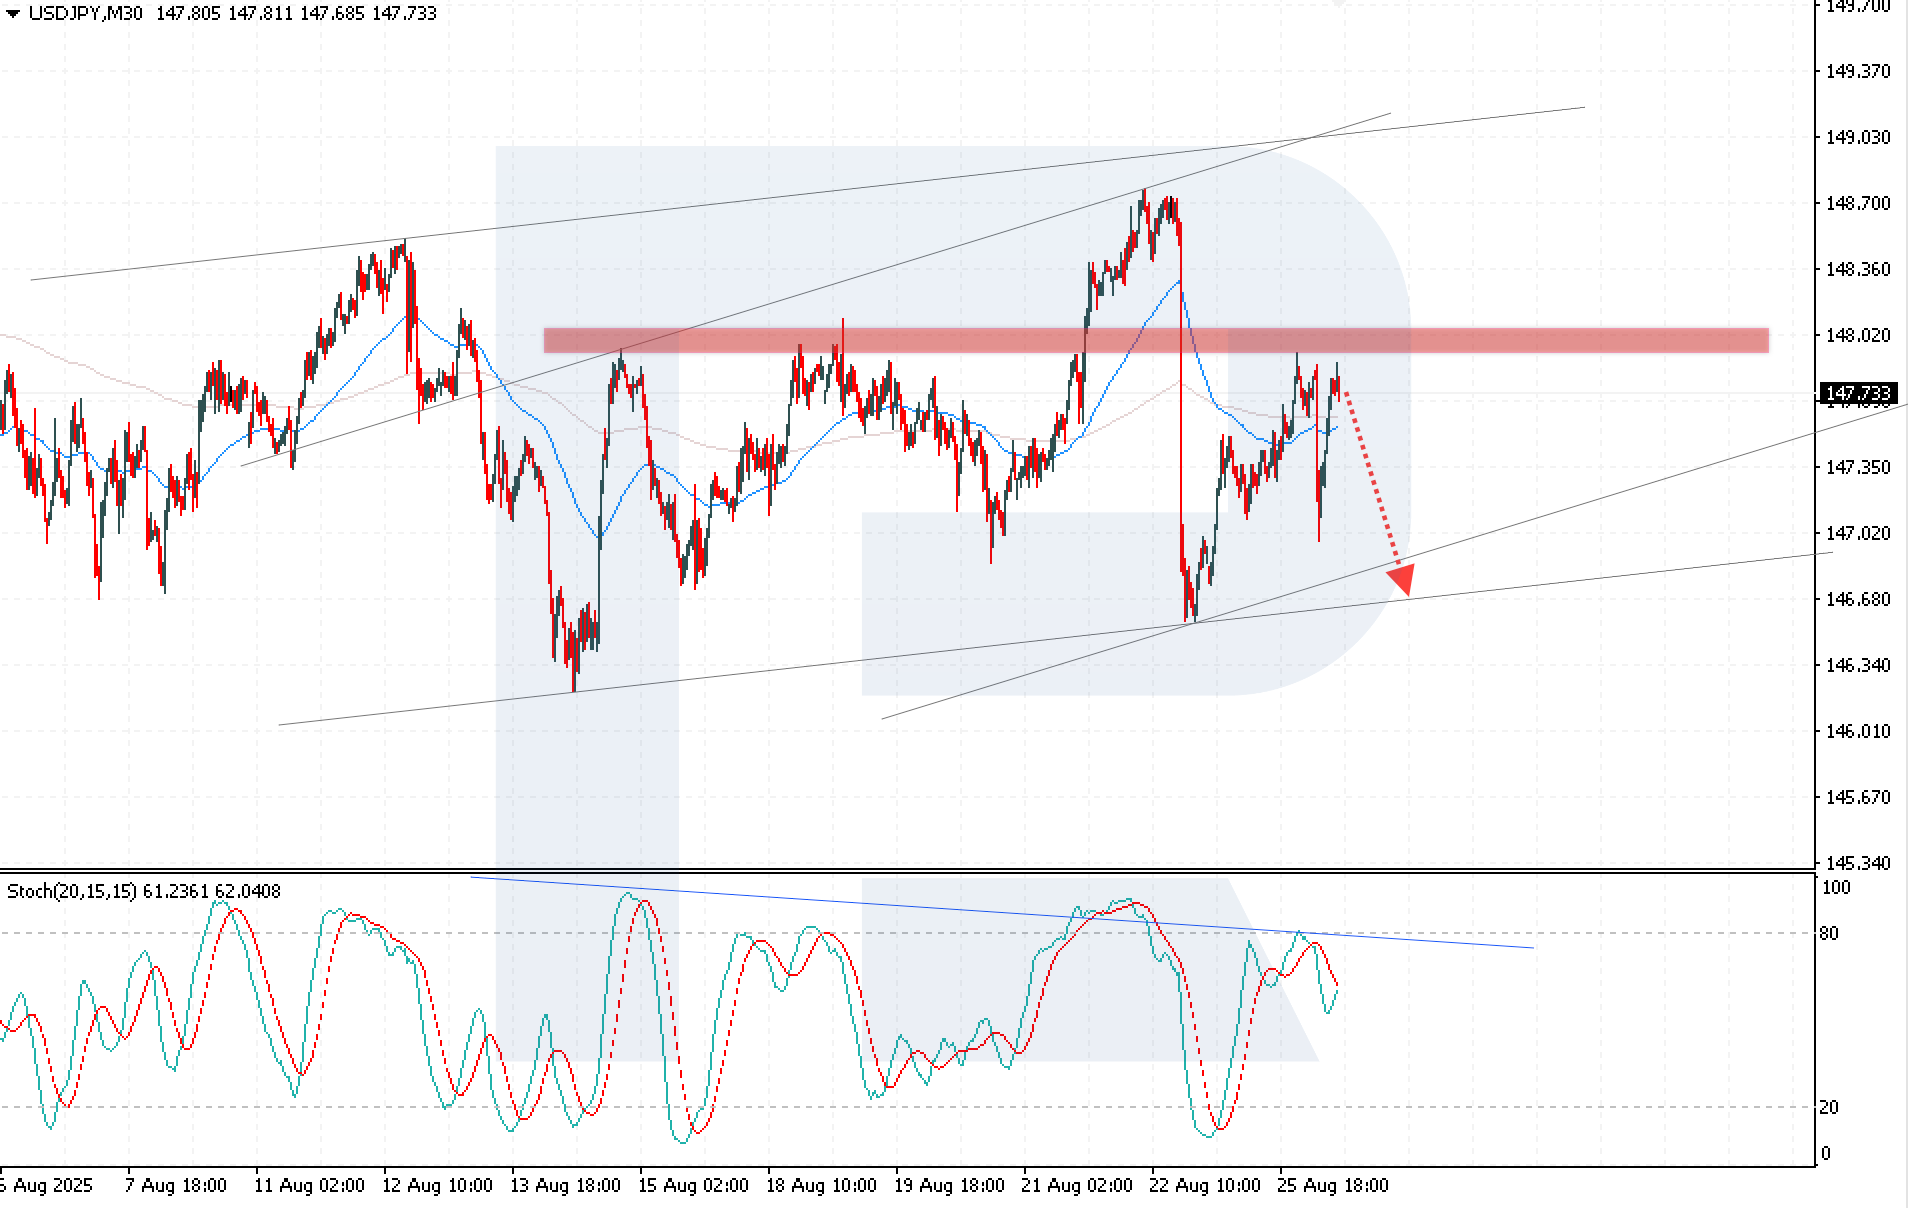
Double Top pattern increases downside risk for USDJPY The USDJPY rate shows moderate growth, but ongoing expectations of BoJ tightening may intensify pressure on the US dollar. The current quote is 147.73. Discover more in our analysis for 26 August 2025. USDJPY technical analysis The USDJPY rate is retreating from a strong resistance level at 148.00 while staying within the ascending channel. The current dynamics point to a high probability of a correction towards the channel’s lower boundary at 146.70. The current USDJPY fundamentals reflect continued pressure on the US dollar and short-term downside risks. Read more - USDJPY Forecast Attention! Forecasts presented in this section only reflect the author’s private opinion and should not be considered as guidance for trading. RoboForex bears no responsibility for trading results based on trading recommendations described in these analytical reviews. Sincerely, The RoboForex Team
-
roboforex Market Fundamental Analysis by RoboForex
RBFX Support replied to RBFX Support's topic in Fundamental Analysis
US 500 forecast: after rebounding from support, the index aims to hit its new all-time high The US 500 remains in an uptrend, with quotes poised to break above the resistance level. The US 500 forecast for today is positive. US 500 forecast: key trading points Recent data: US initial jobless claims came in at 235 thousand last week Market impact: this has a dual effect on the US stock market Fundamental analysis US initial jobless claims stood at 235 thousand last week, above the forecast of 226 thousand and the previous reading of 224 thousand. The rise in claims indicates some weakening of the labour market. Higher applications may signal a slowdown in economic activity. Signs of labour market cooling can ease pressure on the Federal Reserve to tighten monetary policy further, supporting expectations of stable or even lower interest rates. For the US 500, this data may trigger a mixed reaction in the short term. The technology and growth sectors may benefit, as they gain from prospects of looser monetary policy, while consumer-focused sectors may come under pressure due to expectations of weaker purchasing power. RoboForex Market Analysis & Forex Forecasts Attention! Forecasts presented in this section only reflect the author’s private opinion and should not be considered as guidance for trading. RoboForex bears no responsibility for trading results based on trading recommendations described in these analytical reviews. Sincerely, The RoboForex Team -
⭐ RichardGere reacted to a post in a topic:
ai.thealgotrader.live
-
⭐ RichardGere reacted to a post in a topic:
ai.thealgotrader.live
-

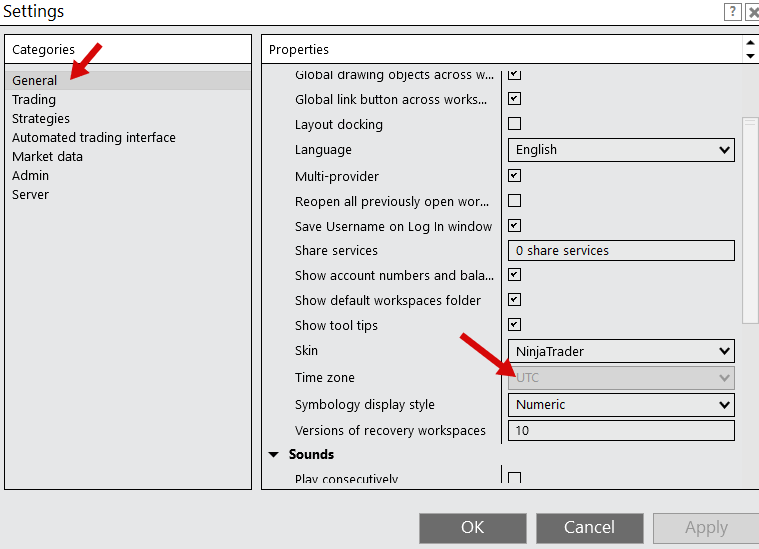
8.1.5.2 64-bit unable to change timezone it is grayed out
⭐ rcarlos1947 replied to ⭐ rcarlos1947's topic in Ninja Trader 8
@roddizon1978@fryguy1 Thank you both for responding. This is what it looks like in settings/tools: I looked in program files/ninjatrader and did not find any ini file. I'm surprised this is not a common problem cause it happened in 3 different computers. I may have to back out of 8.1.5.2 64-bit and fall back to 8.1.4.1-64 bit.
-
@apmoo can you check why the buttons are not working on this indicator https://indo-investasi.com/topic/94271-atr-tradeshield/ ? Thank you very much.
-
Most of the brokers usually pay in trading credit which can be fine since it pushes for trading more in order to get profits for withdrawals.
-

Should we join forces with TGF Community? [Answer please]
⭐ kratos194 replied to MrAdmin's topic in Announcements
If TopGold.forum is based in Europe or America, it will no longer be possible to share copyrighted books, courses, or resources, so indo-investment will disappear. To increase forum revenue, you can increase advertisements and sponsors, as all forums in the world do (some examples): https://www.elitetrader.com/et/ https://www.trade2win.com/ https://nexusfi.com/index.php?s=ff7144f4fae703f2adf3394944821933 -

HFMarkets (hfm.com): Market analysis services.
AllForexnews replied to AllForexnews's topic in Fundamental Analysis
Oil Prices Climb as Russia-Ukraine Talks Stall, But Bearish Momentum Returns Crude oil prices rise for four consecutive days, and no further progress is made between Russia, the US and Ukraine. As time progresses without a ceasefire or peace deal, the likelihood of one diminishes, triggering a spike in Oil prices. Oil prices on Monday rose to $65.78, the highest in 20 days, but the price retraced lower during this morning’s session. Why Are Oil Prices Rising? Oil prices extended their gains as investors grew discouraged by the lack of progress in resolving the Russia-Ukraine conflict. Russia is the third-largest oil exporter in the world behind Saudi Arabia and the US. Over a week has passed since the meeting between US President Donald Trump and Russian President Vladimir Putin, yet no details of an agreement have surfaced. Adding to supply concerns, the White House reiterated over the weekend that new sanctions on Russia’s energy sector will be imposed within two weeks if no diplomatic settlement is reached. Such measures could tighten crude supply and further support prices. President Trump told journalists that he believes Putin's dislike of Zelensky is delaying a meeting between the two. Such a move would also significantly escalate geopolitical tensions, as Russia currently relies on oil exports to fund a large part of the economy’s budget. However, the Vice President told journalists that during the Trump-Putin talks, the Russian President was willing to make concessions. Therefore, if momentum again gains speed, the price of Crude Oil can again come under pressure. US Economic Data The upcoming economic data is also likely to influence the pricing of the energy market. Today, investors will evaluate the release of the US Durable Goods Orders, CB Consumer Confidence and Richmond Manufacturing Index. However, the main releases of the week will be Thursday’s Gross Domestic Product and Friday’s Core PCE Price Index. The price of Crude oil is likely to come under pressure if the economic data is weaker than the current projections, while the Core PCE Price Index reads higher. This would indicate a weakening economy while pressuring the Fed not to cut interest rates. On the other hand, if the Core PCE Price Index falls and the Gross Domestic Product rises, Crude Oil products are likely to rise further. Currently, all energy products are trading lower on Tuesday. Heating Oil is 0.42% lower, Brent Oil -0.42%, and Gasoline is 0.44% lower. All global indices are also declining, indicating a ‘risk-off’ sentiment within the market. Crude Oil - Technical Analysis The price of Crude Oil is trading below the day’s VWAP, indicating that sellers are currently controlling the price movement. However, on a 2-hour chart, the price remains above most Moving Averages, meaning that most traders will focus on a retracement at first. When the price falls below the 75-bar EMA on the 2-hour chart, traders will switch their view to a potential full correction. Crude Oil 10-Minute Chart A retracement could see the price fall back down to $64.1,9, which would be a further 1.20% decline. The $64.19 would be key as it is in line with the 75-bar EMA and is the level where the resistance level potentially may flip to support. However, the price movement would depend on the progress between Russia and Ukraine as well as the upcoming US economic data. If the price remains below the $65.00 level, sell signals are likely to remain intact for the short-term. If the price rises above $65.25, sell signals will start to fade until bearish momentum is regained. Key Takeaways: Crude oil hit a 20-day high at $65.78 amid stalled US-Russia-Ukraine peace talks and sanction risks. Lack of progress and potential US sanctions on Russia’s energy sector could tighten supply and support prices. US economic data this week (GDP, Core PCE) will heavily influence oil demand outlook and Fed policy expectations. Technically, oil trades below VWAP with key support at $64.19; staying under $65 keeps short-term bearish pressure. [b]Always trade with strict risk management. Your capital is the single most important aspect of your trading business.[/b] [b]Please note that times displayed based on local time zone and are from time of writing this report.[/b] Click [url=https://www.hfm.com/hf/en/trading-tools/economic-calendar.html][b]HERE[/b][/url] to access the full HFM Economic calendar. Want to learn to trade and analyse the markets? Join our webinars and get analysis and trading ideas combined with better understanding of how markets work. Click [url=https://www.hfm.com/en/trading-tools/trading-webinars.html][b]HERE[/b][/url] to register for FREE! [url=https://analysis.hfm.com/][b]Click HERE to READ more Market news.[/b][/url] [b]Michalis Efthymiou HFMarkets[/b] [b]Disclaimer:[/b] This material is provided as a general marketing communication for information purposes only and does not constitute an independent investment research. Nothing in this communication contains, or should be considered as containing, an investment advice or an investment recommendation or a solicitation for the purpose of buying or selling of any financial instrument. All information provided is gathered from reputable sources and any information containing an indication of past performance is not a guarantee or reliable indicator of future performance. Users acknowledge that any investment in Leveraged Products is characterized by a certain degree of uncertainty and that any investment of this nature involves a high level of risk for which the users are solely responsible and liable. We assume no liability for any loss arising from any investment made based on the information provided in this communication. This communication must not be reproduced or further distributed without our prior written permission. -
In the HFM contests I’ve joined, I treat them as execution drills rather than edge validation—spreads/fills differ from live. So does HFM pay cash or credit with turnover rules?
-
 Hello, has anyone received the course yet?
 -

8.1.5.2 64-bit unable to change timezone it is grayed out
roddizon1978 replied to ⭐ rcarlos1947's topic in Ninja Trader 8
Check your trading hours at Tools , maybe you could change it there -

REQ : david weis catching trend reversal dvd
owh5v replied to owh5v's topic in Forex Clips & Movie Request
@RichardGerei saw one post about weis wave indicator in nt8 you should check it out. maybe someone uploaded there -
REQ : david weis catching trend reversal dvd
owh5v replied to owh5v's topic in Forex Clips & Movie Request
yes i can access it thank you !! you are such a big help~ oh sorry i just tried it it only works on nt7 sorry... but i found one trick to run similar in tv. appreciate man -
owh5v reacted to a post in a topic:
REQ : david weis catching trend reversal dvd
-
Traderbeauty reacted to a post in a topic:
ai.thealgotrader.live
-

8.1.5.2 64-bit unable to change timezone it is grayed out
⭐ fryguy1 replied to ⭐ rcarlos1947's topic in Ninja Trader 8
Wonder if the setting are in an .ini file or something in the NinjaTrader folder? Maybe can change it inside of a file. -
Welcome to Indo-Investasi.com. Please feel free to browse around and get to know the others. If you have any questions please don't hesitate to ask.
-
⭐ RichardGere reacted to a post in a topic:
ai.thealgotrader.live
-
techfo reacted to a post in a topic:
ai.thealgotrader.live
-
 bradnbutter joined the community
 -
Welcome to Indo-Investasi.com. Please feel free to browse around and get to know the others. If you have any questions please don't hesitate to ask.
-
Texasuav reacted to a post in a topic:
Is val1312q legit?
-
 iwhifftradez joined the community
 -
 Texasuav joined the community
 - Yesterday
-
fxzero.dark reacted to a post in a topic:
ai.thealgotrader.live
-
Find the reset in this post
-
rext4.rar Here is the reset for rithmic for the 8.0.28 version. Inside is an exe file. dont worry is no virus is the version from VAL
-
https://workupload.com/archive/8YHusFq3SW LMK Thanks
-

REQ : david weis catching trend reversal dvd
⭐ RichardGere replied to owh5v's topic in Forex Clips & Movie Request
Sorry I don't have anything for TV. I only have the MT4 Weis Wave with Alert. I did a TG search and saw a self written TV script by Von Kr. who incidentally is a member of this forum. I have attached this script. I also saw a David Weis video - David Weis - The Message of Wave Volume. Not sure if you have this. Here is the TG link. Not sure if you can access it because it says it is a non public link. Let me know if it works for you or not. https://t.me/VSABTC/15958 Can you upload your Weis Wave for NT8? Mine does not work for NT8 Thanks Pretty Weis Wave _ VonKr.txt