⤴️-Paid Ad- Check advertising disclaimer here. Add your banner here.🔥
All Activity
- Past hour
-
 ⭐ RichardGere reacted to a post in a topic:
TCAutoOptimizing
⭐ RichardGere reacted to a post in a topic:
TCAutoOptimizing
-
⭐ osijek1289 reacted to a post in a topic:
TCAutoOptimizing
-
⭐ osijek1289 reacted to a post in a topic:
xtrend algo footprint plus gold edition
-
Those are not simple fixes sorry
-
https://workupload.com/file/F6vHT8wKuWx Documents\NinjaTrader 8\bin\Custom Thanks
-
⭐ goldeneagle1 reacted to a post in a topic:
xtrend algo footprint plus gold edition
-
⭐ goldeneagle1 reacted to a post in a topic:
Ninza Pack
-
@apmoo please take a look on these https://indo-investasi.com/topic/96964-xtrend-algo-footprint-plus-gold-edition/ and https://indo-investasi.com/topic/96970-az-investeu-ultimate-renko-add-on/
-
⭐ goldeneagle1 reacted to a post in a topic:
quantvue.io
-
⭐ goldeneagle1 reacted to a post in a topic:
livewireindicators.com
-
⭐ goldeneagle1 reacted to a post in a topic:
livewireindicators.com
-
munurohit reacted to a post in a topic:
livewireindicators.com
-
https://workupload.com/file/94vydfXQqeq just hit enter or ok Thanks
- Today
-
This is something worth having https://limewire.com/d/lRsok#zQNr5crrUj https://tradingacademi.com/?page_id=1238 https://www.youtube.com/watch?v=v_EvEh7x_KE https://www.youtube.com/@AnzoTradingBot/videos
-
 miki99 joined the community
 -
munurohit reacted to a post in a topic:
livewireindicators.com
-
hey guys, do you have the chart template?
-
Updated LiveWire that can be used with Predator.... Pls edu. @apmoo@kimsam https://workupload.com/archive/aXYd5x3Rec
-
Did you share this indicator?
-
Here are the files uneducated. Any help is appreciated NinZaQuantumVolDelta_NT8.zip NinZaSonarlikeIcebergFinder_NT8.zip
-
Welcome to Indo-Investasi.com. Please feel free to browse around and get to know the others. If you have any questions please don't hesitate to ask.
-
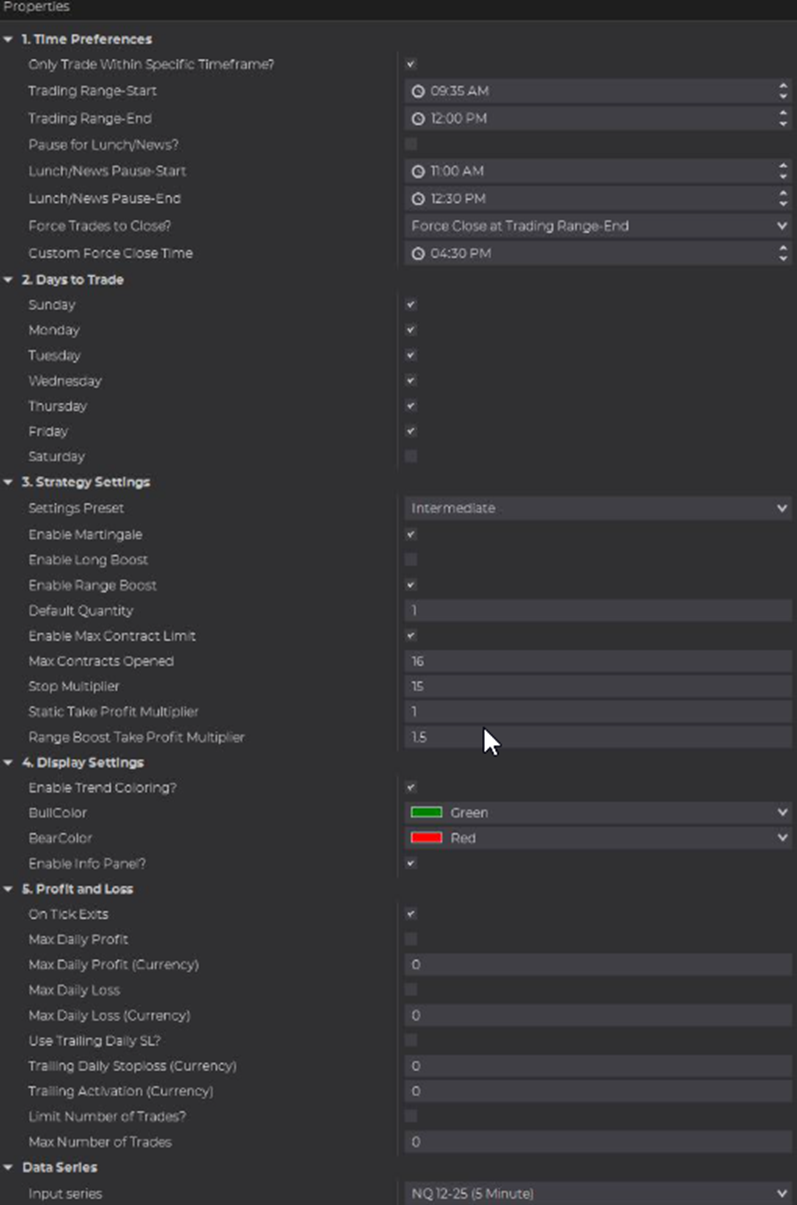
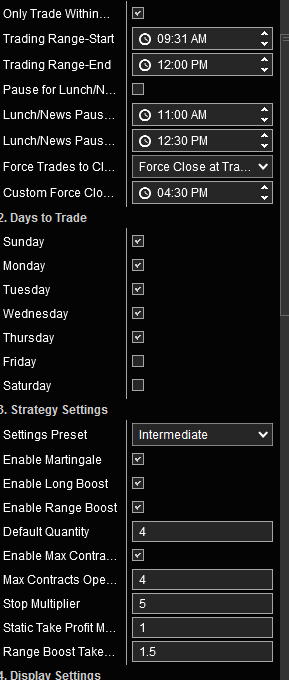
Plus if you add those settings which you think are good, enable it, right click on the chart, scroll down you will see, because you don't follow directions it has automatically removed long boost, so it must be working real good!
-
 playfreecas joined the community
 -
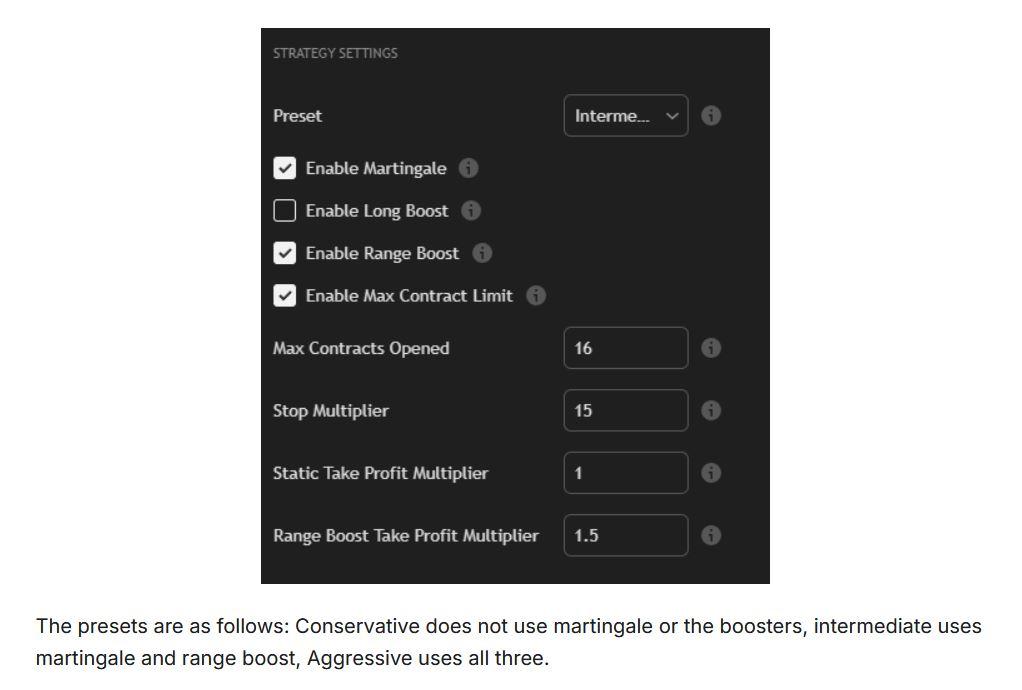
Well that is theirs, how too use the settings. Is that better! If someone is looking for the settings, don't just give them what you think is good. Let them follow the correct from the developer. They do extensive back testing!
-
Do you have the files?
-
I started with PAMM/copy at HFM as training wheels—it accelerates learning—but my consistency only came after I built my own position-sizing and stop rules. Whatever you choose, demand a verified, public Myfxbook with full history and no martingale tricks
-

Anybody can recommend a broker for News trading??
binaryowner replied to venturefx's topic in Forex Brokers
The job is to bound slippage raw ECN like from HFM + VPS near the matching engine, and stop-limit/IOC with a max-slippage cap. -
How's this coming along ?
-

Market Technical Analysis by RoboForex
RBFX Support replied to RBFX Support's topic in Technical Analysis
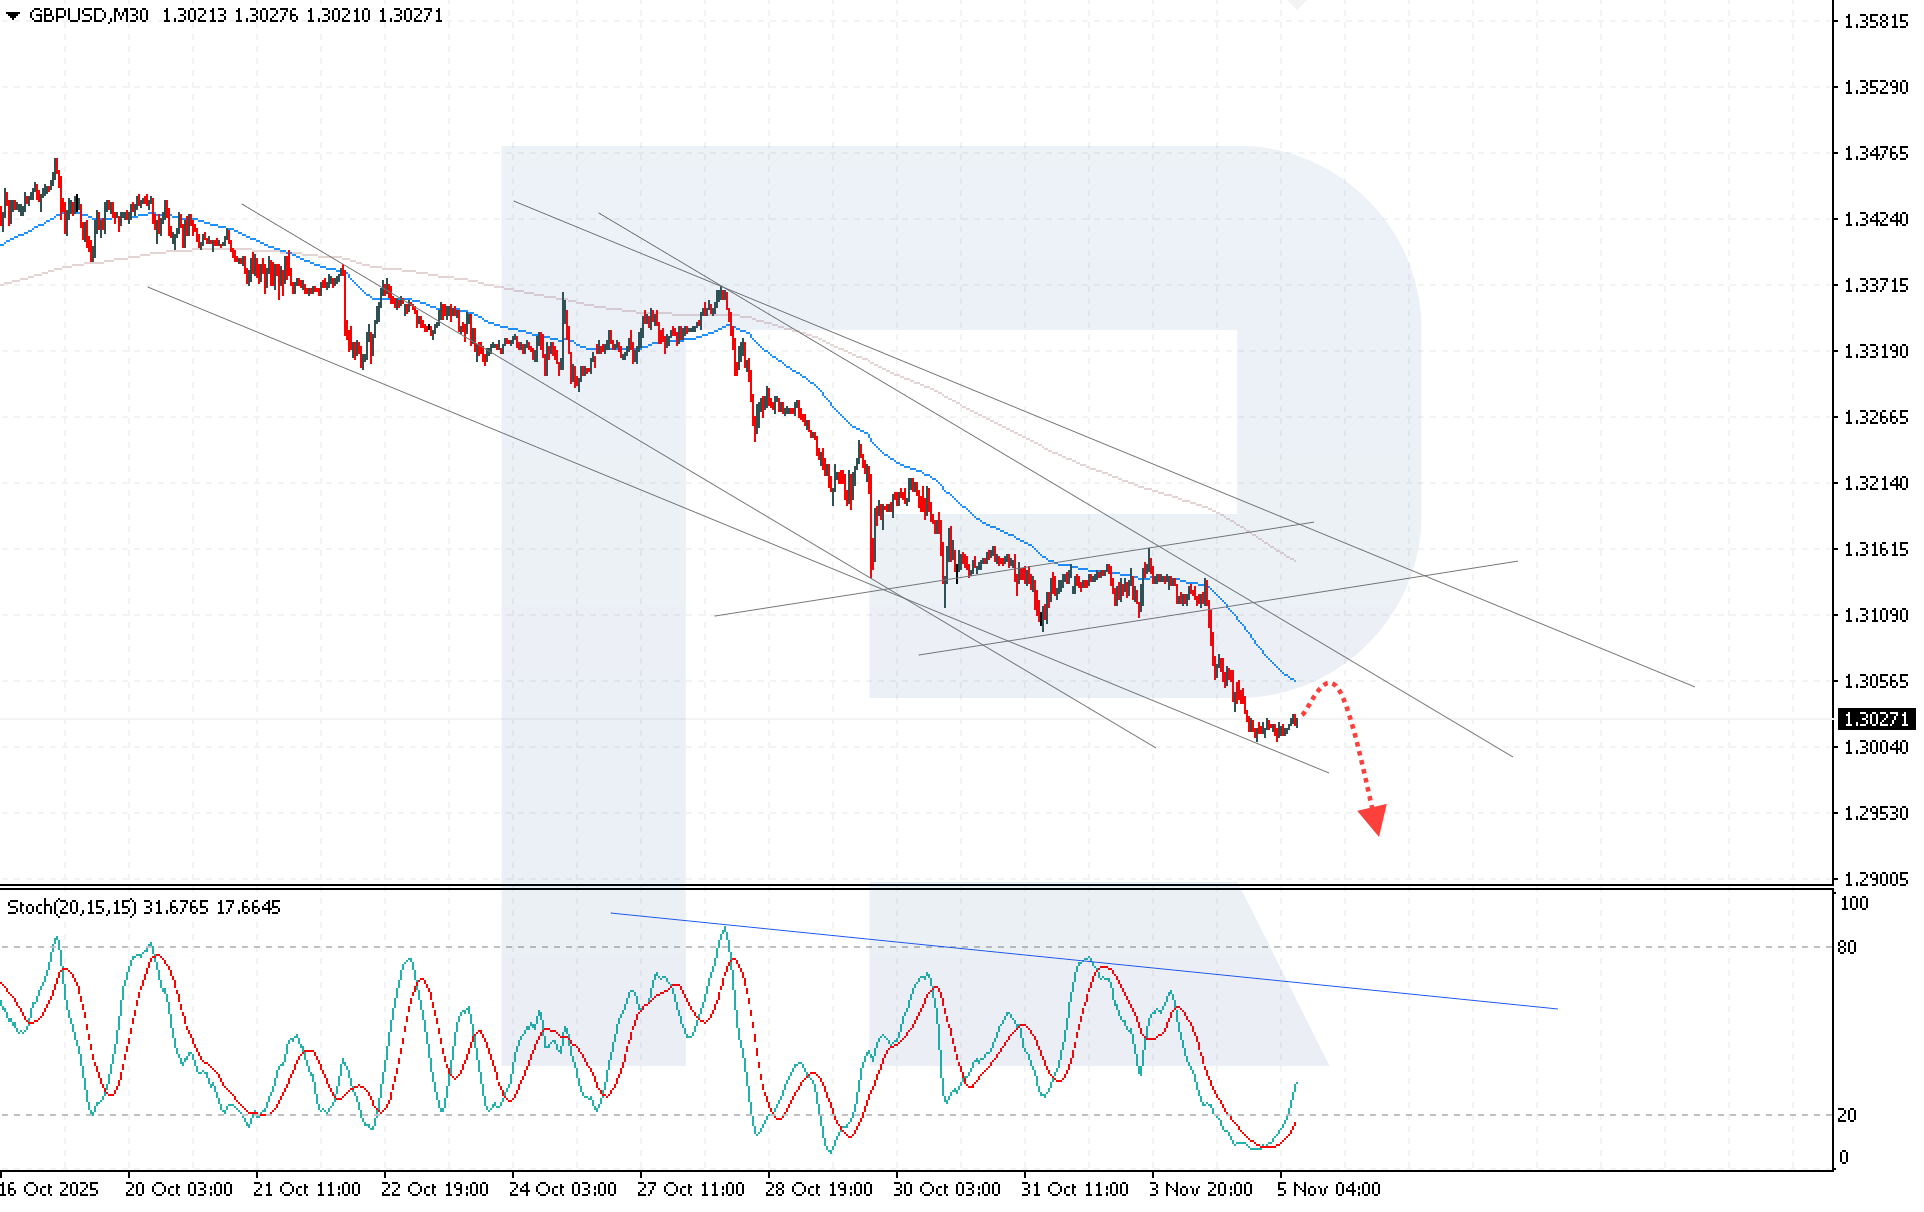
GBPUSD consolidates, but downside potential towards 1.2945 remains high The GBPUSD pair remains under pressure as markets expect the Federal Reserve to keep interest rates unchanged in December, with the rate currently at 1.3027. Find out more in our analysis for 5 November 2025. GBPUSD technical analysis The GBPUSD rate is in a correction phase, remaining within a downward channel. After an aggressive selloff, sellers retain control, while recovery attempts are capped near the 1.3055 resistance level. The current fundamental backdrop favours the US dollar. Read more - GBPUSD Forecast Attention! Forecasts presented in this section only reflect the author’s private opinion and should not be considered as guidance for trading. RoboForex bears no responsibility for trading results based on trading recommendations described in these analytical reviews. Sincerely, The RoboForex Team
-
roboforex Market Fundamental Analysis by RoboForex
RBFX Support replied to RBFX Support's topic in Fundamental Analysis
US 30 forecast: the index enters a correction, but the uptrend remains intact The uptrend in the US 30 index remains strong, suggesting the potential for another all-time high. The US 30 forecast for today is positive. US 30 forecast: key trading points Recent data: US ISM manufacturing prices for October came in at 58.0 Market impact: the data has a moderately positive effect on the equity market Fundamental analysis The ongoing US government shutdown has now become the longest in history after the Senate once again failed to pass a funding bill yesterday. Meanwhile, the ISM manufacturing prices index came in at 58.0, below the forecast of 62.4 and the previous reading of 61.9. This means that prices paid by manufacturers for raw materials and components are still rising (as the index remains above 50.0), but the pace of growth has slowed significantly and fallen short of expectations. This is effectively a disinflationary signal from the manufacturing sector. For the US 30 index, the data is moderately positive. Large industrial companies benefit from easing cost pressures and potentially lower discount rates. However, the short-term reaction will depend on whether investors interpret the data as primarily disinflationary or as a sign of weaker end demand. RoboForex Market Analysis & Forex Forecasts Attention! Forecasts presented in this section only reflect the author’s private opinion and should not be considered as guidance for trading. RoboForex bears no responsibility for trading results based on trading recommendations described in these analytical reviews. Sincerely, The RoboForex Team -
there are no wrong settings. there are no definitive settings, only settings that work for a particular user's preference
-
Wrong settings, just set the max contracts.
-
 Barhea joined the community
 -

HFMarkets (hfm.com): Market analysis services.
AllForexnews replied to AllForexnews's topic in Fundamental Analysis
Date: 5th November 2025. Tech Sell-off and Bitcoin Crash: Is Market Euphoria Finally Cooling? The global rally in stocks and cryptocurrencies is facing its first serious test in months. Sharp declines in major technology shares and a wave of Bitcoin liquidations have shaken investor confidence, prompting questions over whether markets are simply taking a breather, or signalling something deeper. Tech Stocks Lead the Market Pullback Asian and US markets turned lower this week as technology-heavy indices erased part of their 2025 gains. Seoul and Tokyo exchanges fell nearly 5% from Tuesday’s peaks, while the Nasdaq dropped 2%, with futures pointing to further weakness. The hardest-hit names were those that had led the artificial intelligence boom. Nvidia, once crowned the world’s most valuable company, slid 4%, extending its decline to 7% below last month’s record. Meanwhile, Palantir Technologies dropped 8% despite strong earnings, highlighting just how stretched valuations have become. Fund managers suggest the downturn reflects profit-taking rather than panic, a typical pattern as investors lock in gains ahead of year-end. As Angus McGeoch from Barrenjoey noted, ‘Managers don’t want to give up too much, but if the market rebounds, they’ll be quick to re-enter.’ Even after the decline, the Nasdaq remains over 50% higher since April, suggesting that the broader uptrend is still intact. AI Stocks: Reset or Reality Check? The correction has reignited the debate over whether the AI-driven stock rally has overheated. Wall Street executives, including those from Goldman Sachs and Morgan Stanley, have warned of potential pullbacks after a year of rapid gains. Adding to the caution, South Korea’s regulator issued a standard warning on SK Hynix, which has tripled in a year but has now lost 6% in two days. Saxo Bank’s Charu Chanana called the move ‘healthy,’ adding that a short-term reset is preferable to a larger market unwind later. Bitcoin Mirrors the Market’s Mood The cryptocurrency market has followed a similar pattern. Bitcoin (BTC) dropped over 20% from its October record above $126,000, briefly dipping below the $100,000 mark for the first time since June. Long-term holders have liquidated an estimated $41.6 billion in BTC, marking one of the largest sell-offs in recent memory. This wave of selling has been accompanied by mounting pressure on miners, whose profitability has hit its lowest point in months due to rising energy costs and falling rewards. Over $1.3 billion in crypto positions were liquidated in just 24 hours, underscoring the severity of the correction. However, some contrarian investors have stepped in to buy the dip, showing that long-term confidence in Bitcoin remains resilient. Macro Developments: Trade Relief Meets Policy Uncertainty Interestingly, the Bitcoin sell-off coincides with a positive geopolitical development. China’s decision to suspend additional tariffs on US goods for one year has eased trade tensions, removing a major source of market anxiety. However, optimism is tempered by domestic political instability in the US, including a prolonged government shutdown and ongoing uncertainty around future digital asset regulations. These factors have combined to create a highly volatile environment for both equities and cryptocurrencies. Bitcoin and Stock Market Technical Outlook On the charts, Bitcoin’s 50-week simple moving average (SMA) around $102,900 remains a key support level. Historically, this line has acted as a springboard for previous recoveries. A decisive break below $100,000 could open the door towards $94,000 or even $85,000, according to InvestingHaven and Sevens Report analysts. For equities, investors are watching whether the tech sector can stabilise and reassert leadership. If so, the pullback could quickly prove to be a buying opportunity rather than the start of a bear trend. The Bottom Line: A Healthy Pause in an Overheated Market Both the stock and crypto markets are experiencing their first meaningful correction after months of relentless gains. For now, analysts view this as a healthy reset, not a crisis. While uncertainty around regulation, earnings, and policy remains, easing trade tensions and robust long-term trends in AI and blockchain continue to support the broader bullish narrative. In other words, this may not be the end of the rally, just the market catching its breath. Always trade with strict risk management. Your capital is the single most important aspect of your trading business. Please note that times displayed based on local time zone and are from time of writing this report. Click HERE to access the full HFM Economic calendar. Want to learn to trade and analyse the markets? Join our webinars and get analysis and trading ideas combined with better understanding of how markets work. Click HERE to register for FREE! Click HERE to READ more Market news. Andria Pichidi HFMarkets Disclaimer: This material is provided as a general marketing communication for information purposes only and does not constitute an independent investment research. Nothing in this communication contains, or should be considered as containing, an investment advice or an investment recommendation or a solicitation for the purpose of buying or selling of any financial instrument. All information provided is gathered from reputable sources and any information containing an indication of past performance is not a guarantee or reliable indicator of future performance. Users acknowledge that any investment in Leveraged Products is characterized by a certain degree of uncertainty and that any investment of this nature involves a high level of risk for which the users are solely responsible and liable. We assume no liability for any loss arising from any investment made based on the information provided in this communication. This communication must not be reproduced or further distributed without our prior written permission.