

⤴️-Paid Ad- Check advertising disclaimer here. Add your banner here.🔥
All Activity
- Past hour
- Today
-
 Gig333 joined the community
 -

roboforex Market Fundamental Analysis by RoboForex
RBFX Support replied to RBFX Support's topic in Fundamental Analysis
XRP poised for a surge as network upgrade changes the game The fundamental backdrop for XRP remains moderately positive, with the price continuing to rise and potentially testing the 1.1185 level. XRPUSD forecast: key takeaways The XRP network is undergoing an upgrade Assets held in XRP ETFs remain at a high level Having secured European licences, Ripple continues to strengthen its position Fundamental analysis The XRPUSD price is forming an upward wave today after a decline and is currently testing the 1.0850 level. The XRP network is being upgraded to version v3.2.0 (fixCleanup3.2.0). The upgrade is intended to make the network more stable, improve validator performance, and resolve several technical issues. Before launch, the developers fixed the identified errors and stabilised the network. RoboForex Market Analysis & Forex Forecasts Attention! Forecasts presented in this section only reflect the author’s private opinion and should not be considered as guidance for trading. RoboForex bears no responsibility for trading results based on trading recommendations described in these analytical reviews. Sincerely, The RoboForex Team -
Market Technical Analysis by RoboForex
RBFX Support replied to RBFX Support's topic in Technical Analysis
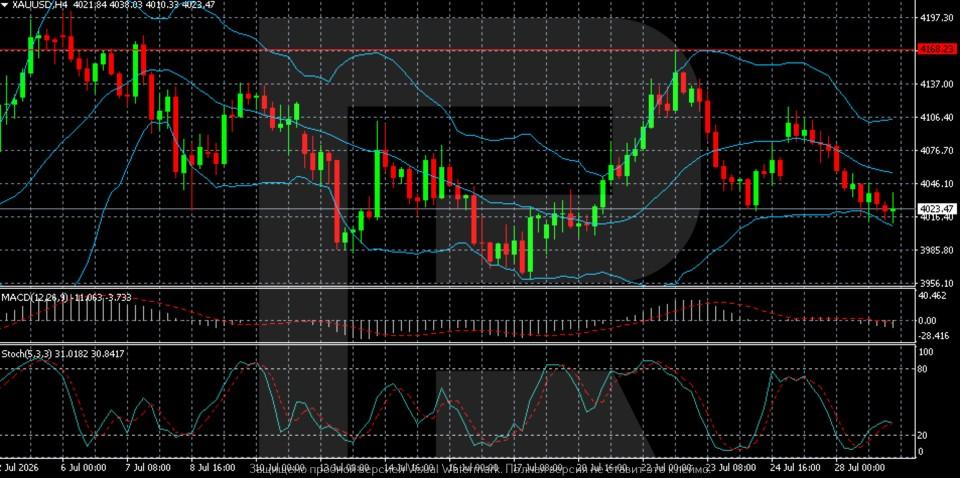
Gold (XAUUSD) forced to retreat as the outlook turns bearish Gold (XAUUSD) prices have fallen to 4,020 USD. The market is once again focused on oil and the Federal Reserve’s interest rate outlook. Technical outlook On the H4 chart, XAUUSD maintains a downward trajectory near 4,023, with prices hovering below the middle Bollinger Band and close to the indicator’s lower boundary, confirming that sellers have the upper hand. Gold prices are declining due to rising oil prices and expectations surrounding the Federal Reserve. Read more - Gold Forecast Attention! Forecasts presented in this section only reflect the author’s private opinion and should not be considered as guidance for trading. RoboForex bears no responsibility for trading results based on trading recommendations described in these analytical reviews. Sincerely, The RoboForex Team
-

Become organized and disciplined in beginning.
binaryowner replied to a topic in General Forex Discussions
That’s the thing: discipline is hard to maintain when the trading rules are vague. In my trading with hfm, a simple checklist, fixed risk process and journal make it much easier to separate a valid setup from an emotional trade -

HFMarkets (hfm.com): Market analysis services.
AllForexnews replied to AllForexnews's topic in Fundamental Analysis
[B]Date: 29th July 2026.[/B] [B]Fed Decision, Oil Surge, and Big Tech Earnings: Markets Brace for Volatility.[/B] The Federal Reserve is set to announce its interest rate decision this evening, keeping markets on edge. Economists still expect the committee to vote for a pause, but there continues to be a growing sense of uncertainty. Many institutions now believe the Federal Open Market Committee may hike under the influence of the new Fed chairman. Over the past three days, there has been less pressure on the Federal Reserve to act fast as oil prices fell. This was due to a pause in hostilities in the Middle East. However, this came to an end early this morning, with Iran firing missiles from its territory, as well as from Iranian-backed groups in Iraq. For this reason, Crude Oil prices rose 4.00% on Wednesday morning. Crude Oil Spike To Pressure The Federal Reserve To Hike? Crude oil’s bearish trend comes to a halt, with the price opening on a bullish price gap and trading 4.00% higher this morning. The US has told journalists that they intercepted missiles overnight at multiple bases in the Middle East. Jordan also said that 5 missiles had been fired towards its territory by Iran. According to reports, the United States and Saudi Arabia are conducting a joint operation targeting Iranian-backed militant groups in Iraq following Iran's recent attack. Although prices declined earlier in the week, the commodity market remains under pressure. Despite the pause in hostilities, key shipping routes in the Middle East remain closed. This includes the Straits of Hormuz and Strait of Bab Al-Mandab. The price is forming a bullish flag pattern, which is understandable, taking into consideration the bullish volatility this morning. The bullish volatility has sent the price above most moving averages on the lower timeframes, and, due to the loss of volatility, has fallen to the neutral level on oscillators. However, if the price remains above $81.40, bullish signals can still arise. HFM - Crude Oil 15-Minute Chart Higher oil prices throughout today’s session are likely to put pressure on the Federal Reserve to increase interest rates. In addition to this, the number of initial applications for unemployment benefits decreased by 22,000 last week to 187,000. This is the lowest level since September 1969, giving the Fed more room to hike. However, the consensus still points to a pause for now, with a rate hike expected in September. Gold Rises on China Demand, but for How Long? Gold prices are rising this morning after finding support as the US Dollar retraces. Reports also continue that China is taking advantage of the lower price and positive exchange rate to boost its Gold portfolios and reserves. China continues to buy large amounts of physical gold. In June, the country imported around 173 tonnes, the highest monthly total in two years, as lower gold prices and new import rules allowed banks to purchase more. Gold imports reached 163 tonnes in May, while imports during the first five months of 2026 climbed to 692 tonnes. This is 76% higher compared to the same period last year. At the same time, Chinese investors pulled money out of gold-backed exchange-traded funds (ETFs) at a record pace in June. According to the World Gold Council, gold ETF holdings fell by 15 billion yuan, with total assets dropping 16% to 243 billion yuan (around $36 billion), the lowest level since December 2025. Investors taking profits after gold’s strong rally drove prices lower, as did a stronger US Dollar. Nonetheless, economists continue to advise that the longer-term price movement will depend on the Federal Reserve decision and the US Dollar. While the US Dollar Index remains firmly above 100.00, Gold may struggle to gain bullish momentum. If the price of Gold falls below $4,029.00, buy signals in the short term will quickly fade. HFM - Gold 15-Minute Chart NASDAQ - Bubble and Credit Fears Remain The price of the NASDAQ is experiencing impulse waves in both directions during this morning’s Asian session. However, the price remains weak and at risk of further downside. The price action over the next 48 hours will depend on the Fed’s rate decision, forward guidance, and major earnings reports. In the US, the second-quarter earnings season continues this week, with major retail and technology companies reporting results. After the market close, Microsoft and Meta are both expected to post higher revenue and earnings, supported by AI-driven growth. However, economists advise that in order for the stocks to find support, companies need to ‘significantly’ beat expectations and not shock traders with extreme company borrowing to fund AI projects. A key support level for the NASDAQ can be seen at $27,498.00, while the resistance level is visible at $28,039.55. Key Takeaways: Markets are focused on the Federal Reserve, with a pause expected, but uncertainty continuing to grow. Many institutions now believe the Fed may opt for an early hike. Crude oil rose 4% after renewed Middle East tensions increased concerns over inflation and global supply disruptions. Gold found support from strong physical demand in China, despite record outflows from Chinese gold ETFs. The Federal Reserve’s decision and the US Dollar are expected to determine Gold's next major price move. The NASDAQ remains under pressure as investors await the Fed decision and earnings from Microsoft and Meta. [B]Always trade with strict risk management. Your capital is the single most important aspect of your trading business.[/B] [B]Please note that times displayed based on local time zone and are from time of writing this report.[/B] Click [URL='https://www.hfm.com/hf/en/trading-tools/economic-calendar.html'][B]HERE[/B][/URL] to access the full HFM Economic calendar. Want to learn to trade and analyse the markets? Join our webinars and get analysis and trading ideas combined with better understanding of how markets work. Click [URL='https://www.hfm.com/en/trading-tools/trading-webinars.html'][B]HERE[/B][/URL] to register for FREE! [URL='https://analysis.hfm.com/'][B]Click HERE to READ more Market news.[/B][/URL] [B]Michalis Efthymiou HFMarkets[/B] [B]Disclaimer:[/B] This material is provided as a general marketing communication for information purposes only and does not constitute an independent investment research. Nothing in this communication contains, or should be considered as containing, an investment advice or an investment recommendation or a solicitation for the purpose of buying or selling of any financial instrument. All information provided is gathered from reputable sources and any information containing an indication of past performance is not a guarantee or reliable indicator of future performance. Users acknowledge that any investment in Leveraged Products is characterized by a certain degree of uncertainty and that any investment of this nature involves a high level of risk for which the users are solely responsible and liable. We assume no liability for any loss arising from any investment made based on the information provided in this communication. This communication must not be reproduced or further distributed without our prior written permission. -
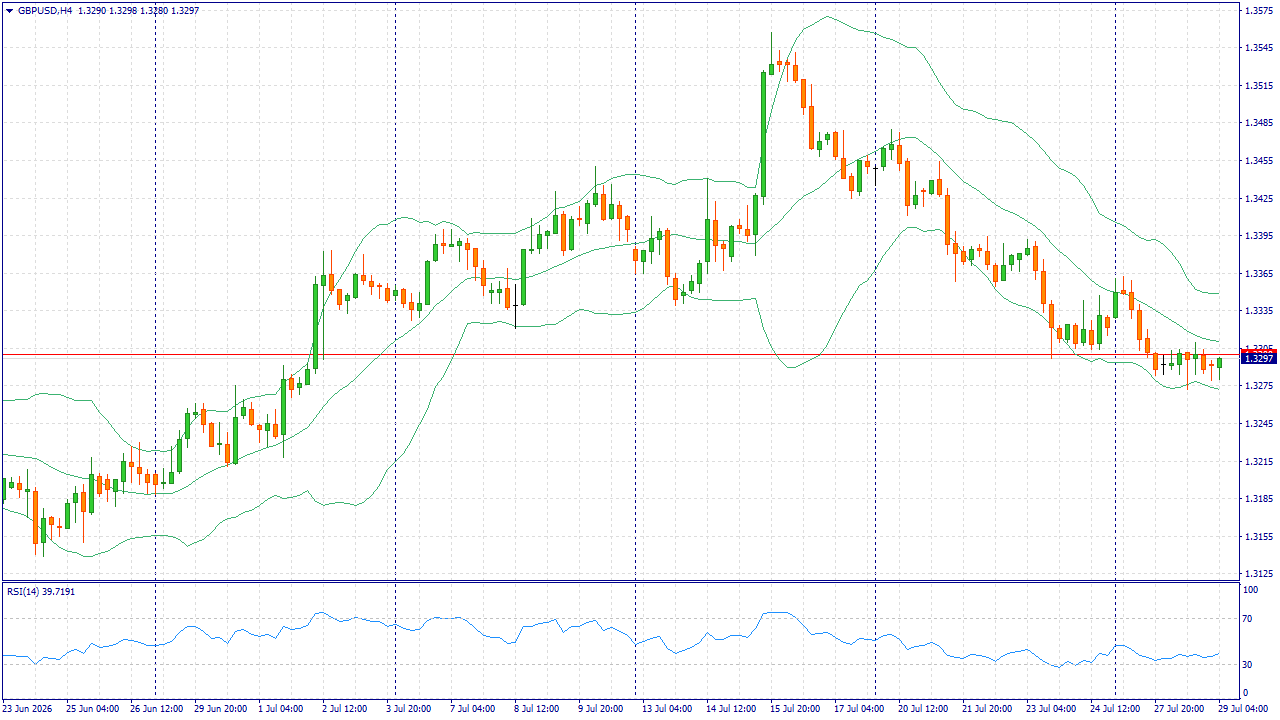
 Market Fundamental Analysis for July 29, 2026 GBPUSD Event to watch today: 21:00 EET. USD - FOMC Rate Decision GBPUSD: GBPUSD is trading near 1.3295, close to its lowest levels since early July. The pound is being restrained by weaker signals from the UK labor market and caution ahead of the Bank of England’s decision on Thursday. The market largely expects the policy rate to remain at 3.75%, meaning the British currency would need a more convincing indication that the central bank is prepared to continue tightening monetary policy. Only for our readers: mention the one-time promo code MR20 in the support chat and get +20% on your next deposit of any amount. The maximum bonus amount is $500. Only one promo code can be applied to a deposit at a time. The domestic backdrop in the United Kingdom remains mixed. Inflation is still above the Bank of England’s target, but weaker demand for workers reduces the risk of a sustained acceleration in wage growth. At the same time, uncertainty surrounding future government spending and how it will be financed is limiting demand for the pound, particularly as investors favor the dollar ahead of the Federal Reserve’s important decision. The US currency retains an advantage due to elevated yields and expectations of a firmer Federal Reserve stance. The selling scenario would come under pressure if the central bank left rates unchanged and gave the market grounds to reduce expectations of a September increase. Until that happens, the pound’s domestic drivers appear insufficient to outweigh the broader dollar impulse, leaving the downside scenario for GBPUSD as the priority. Trading idea: SELL 1.3295, SL 1.3330, TP 1.3225
-
Candyman, Only TSA is a full version, Terra is an add-on installer which gets released every now and then. Without TSA, you cannot run Terra setup. I checked the TSA in #1 is still up and the latest Terra installer/update is also available.
- Yesterday
-
does anyone have access to the latest installer full version and not update? all links are dead. Thanks
-
Once the crypto leaves your wallet, it is very hard to get it back. You should accept the loss and learn from this mistake.
-

Become organized and disciplined in beginning.
hhduy replied to a topic in General Forex Discussions
Finding your trading edge is very important. You should focus on only one simple strategy in the beginning. Do not change your rules every day when you lose a trade. Consistency is the key to success. -
HFMarkets (hfm.com): Market analysis services.
AllForexnews replied to AllForexnews's topic in Fundamental Analysis
Date: 28th July 2026. NASDAQ Sell-off Deepens: Why Stocks Are Falling and What Happens Next. The NASDAQ is declining for the fifth consecutive day as the global stock sell-off gains momentum. All global indices are trading in the red on Tuesday, with some stock exchanges even temporarily halting sell orders. The KOSPI (Korean Stock Index) stopped trading on two occasions during the Asian session and has so far fallen 10%. Even though all global indices are trading lower, US and Asian indices are witnessing the strongest declines. The NASDAQ is particularly in the spotlight as it falls to its lowest point since 5 May just before the Federal Reserve rate decision and major tech earnings. Why Are Indices Declining? The NASDAQ and global indices are declining due to investor fear of over AI spending, high stock prices, and widening credit spreads. Widening credit spreads are known to be negative for stocks, as investors deem the company to be higher risk. So far, investors have ignored the widening spreads due to higher earnings and the AI-trend. However, as stock prices rise to considerably high levels, investors are becoming cautious and are partially taking profits. Most company earnings so far, including Alphabet, have beaten expectations, but at the same time have confirmed higher borrowing and investments in AI. Analysts now advise that companies need to beat expectations by a larger percentage in order to gain interest from investors. This is due to the widening credit spreads. Credit spreads for Alphabet and Oracle are at the widest on record. For Amazon, they are at their widest since 2018, and for Apple, the widest since 2011. Nonetheless, the stocks that drove the NASDAQ lower were NVIDIA, Space Exploration Technology, and Advanced Micro Devices. NVIDIA stock fell 4.99% on Monday and continues to decline during this morning’s session. Upcoming quarterly earnings reports from influential companies on Wednesday and Thursday will continue to strongly influence the index. Tomorrow evening, Microsoft and Meta will make their reports public, while Apple and Amazon will release theirs on Thursday evening. The four companies make up 30% of the NASDAQ. Analysts advise that the companies will need to strongly beat expectations and not show significantly higher borrowing in order to prompt higher demand for their stocks. Lastly, the Federal Reserve will make its interest rate decision public tomorrow evening at 18:00 GMT+3. Federal Reserve Surprise Hike? Markets were split on whether the Federal Reserve would raise the Federal Funds Rate tomorrow evening. Nevertheless, the consensus among economists up to now was that the Fed would pause in July before hiking in September. This is now changing, with some fund managers contemplating whether the Fed chairman, Kevin Warsh, will opt for a surprise hike. Citadel Securities believes the Federal Reserve could surprise markets with a 25-basis-point interest rate hike at this week’s meeting. Yesterday, the firm argued that such a move would reinforce Fed Chair Kevin Warsh’s commitment to restoring price stability and demonstrate that policymakers are serious about keeping inflation under control. Citadel also believes a rate hike now would provide greater flexibility to lower rates later if economic conditions weaken. This is something that can also be seen among US bond yields, which have been trading at a recent high. The FedWatch Tool also indicates that the possibility of a rate hike tomorrow has risen from 26% to 38%. If the Federal Reserve does indeed hike or seems particularly hawkish, the stock market could potentially remain under pressure. Is it Time to Buy the Dip? Currently, the price of the NASDAQ is showing a clear retracement pattern. The previous retracement, seen in December to March, measured 13.50%. The NASDAQ is currently trading 10% lower, meaning, based on previous patterns, the price may potentially fall further. At the same time, risks do remain, as most economists believe the Federal Reserve will adjust interest rates in the upcoming months. For this reason, a bullish rebound cannot be confirmed, particularly before tomorrow’s Federal Reserve rate decision and the vital upcoming earnings reports. These will be key price drivers, which may either drive the price lower or trigger a rebound. By the end of the week, investors will have a broader set of economic data and corporate earnings to make more informed decisions. NASDAQ - Technical Analysis and Forecasts HFM - NASDAQ Daily Chart The 15-minute chart continues to show short-term weakness, with the index making lower highs and lower lows. Price remains below the short-term moving averages, while momentum indicators suggest sellers remain in control. However, the daily chart suggests the NASDAQ remains in a broader long-term uptrend, but the recent pullback has weakened momentum considerably. If the stock market is to witness a crash and major sell-off, investors will be focusing on two possible areas. The resistance being flipped into a support level can be seen at $26,252.00, which is a 14.80% decline from the recent high. The second is based on previous stock market crashes, which, on average, are around 25%. This would take the price to $23,135.00. If the price is to rebound, the first level traders will focus on is the resistance level at $30,769.00. FAQs What Are Credit Spreads? Credit spreads measure the difference between the interest rate a company pays to borrow and the yield on a risk-free government bond. Wider credit spreads indicate investors perceive higher credit risk, while narrower spreads suggest stronger confidence in the company’s financial health. Always trade with strict risk management. Your capital is the single most important aspect of your trading business. Please note that times displayed based on local time zone and are from time of writing this report. Click HERE to access the full HFM Economic calendar. Want to learn to trade and analyse the markets? Join our webinars and get analysis and trading ideas combined with better understanding of how markets work. Click HERE to register for FREE! Click HERE to READ more Market news. Michalis Efthymiou HFMarkets Disclaimer: This material is provided as a general marketing communication for information purposes only and does not constitute an independent investment research. Nothing in this communication contains, or should be considered as containing, an investment advice or an investment recommendation or a solicitation for the purpose of buying or selling of any financial instrument. All information provided is gathered from reputable sources and any information containing an indication of past performance is not a guarantee or reliable indicator of future performance. Users acknowledge that any investment in Leveraged Products is characterized by a certain degree of uncertainty and that any investment of this nature involves a high level of risk for which the users are solely responsible and liable. We assume no liability for any loss arising from any investment made based on the information provided in this communication. This communication must not be reproduced or further distributed without our prior written permission. -
Market Technical Analysis by RoboForex
RBFX Support replied to RBFX Support's topic in Technical Analysis
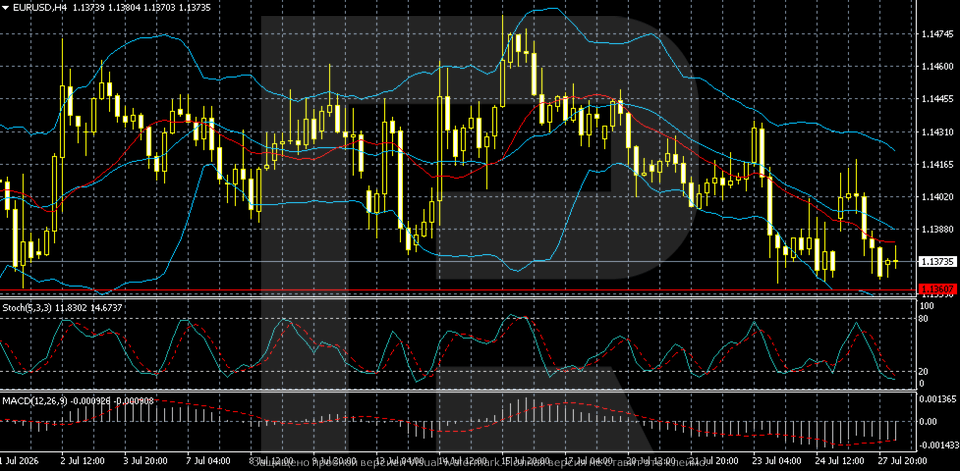
EURUSD slips lower as the US dollar remains strong The EURUSD pair has fallen to 1.1373, with markets awaiting the Federal Reserve’s decision Technical outlook On the H4 chart, the EURUSD rate remains in a downtrend, trading near 1.1374. The price is below the middle Bollinger Band and has moved close to the indicator’s lower boundary, confirming that sellers retain the advantage. The EURUSD pair is declining amid expectations surrounding the Federal Reserve’s decision. Read more - EURUSD Forecast Attention! Forecasts presented in this section only reflect the author’s private opinion and should not be considered as guidance for trading. RoboForex bears no responsibility for trading results based on trading recommendations described in these analytical reviews. Sincerely, The RoboForex Team
-
roboforex Market Fundamental Analysis by RoboForex
RBFX Support replied to RBFX Support's topic in Fundamental Analysis
Ethereum is becoming scarce: what is happening to the ETHUSD price After once again reaching its summer highs, ETHUSD is undergoing a correction as the market awaits the outcome of work on US digital asset legislation. The price currently stands at 1,885.00. ETHUSD forecast: key takeaways Demand for ETH-related products is growing Work on legislation regulating digital assets continues in the US ETHUSD forecast for 28 July 2026: 1,965.00 and 1,850.00 Fundamental analysis Today’s Ethereum price forecast takes into account that the price is trading near 1,885.00 USD, pulling back from local highs following its recent rise. Ethereum continues to attract the attention of major investors. Demand for ETH-related products is growing, while companies are increasingly adding ether to their reserves. This indicates that institutional investors see Ethereum as more than just a cryptocurrency, but the foundation for future digital financial systems. RoboForex Market Analysis & Forex Forecasts Attention! Forecasts presented in this section only reflect the author’s private opinion and should not be considered as guidance for trading. RoboForex bears no responsibility for trading results based on trading recommendations described in these analytical reviews. Sincerely, The RoboForex Team -
 Analysis of margin levels for July 28, 2026 XAUUSD XAUUSD: SELL 4073.95–4124.95, TP1–4023.05, TP2–3864.95. • Long-term trend: temporary uncertainty. The highest volume concentration for the current contract lies within the 4055.00–4105.00 price range. Currently, XAUUSD trading activity is taking place below this range, indicating seller strength. Only for our readers: mention the one-time promo code GIFT20 in the support chat and get +20% on your next deposit of any amount. The maximum bonus amount is $500. Only one promo code can be applied to a deposit at a time. • Medium-term trend: bearish (short). The highest volume concentration for the medium-term trend lies within the 4040.00–4055.00 price range. Currently, XAUUSD trading activity is occurring within this range, indicating temporary uncertainty. • The zone for favorable selling prices (based on margin requirements) is located between the 1/4 and 1/2 zones, calculated from the low of July 24, 2026. • Lower boundary of the 1/4 zone: 4073.95. • Lower boundary of the 1/2 zone: 4124.95. • Intraday targets: breaking the low of July 24, 2026 (4023.05). • Medium-term goals: test of the lower limit of GWCZ-3864.95. • Trading recommendations: sell from the favorable price range upon the formation of a reversal pattern. • Sell: 4073.95–4124.95, Take Profit 1–4023.05, Take Profit 2–3864.95.
 -
 Usman joined the community
 -
Welcome to Indo-Investasi.com. Please feel free to browse around and get to know the others. If you have any questions please don't hesitate to ask.
-
 test123123123123 joined the community
 - Last week
-
Weekly Overview: XAUUSD, #SP500, #BRENT | 31 July 2026 XAUUSD: BUY 4100.00, SL 4065.00, TP 4187.50 Gold begins the week on a stronger footing following a pause in hostilities between the United States and Iran. Lower oil prices have eased inflation concerns, supported bonds, and put pressure on the US dollar. For XAUUSD, this reduces the risk of a further rise in real yields, although the easing of geopolitical tensions limits defensive demand. The Federal Reserve’s decision will be the main event of the week. The market expects the policy rate to remain unchanged but will closely assess the central bank’s willingness to tighten policy further. If oil remains below its recent highs and Treasury yields do not resume their advance, the fundamental backdrop will continue to favor a recovery in gold. Trading idea: BUY 4100.00, SL 4065.00, TP 4187.50 #SP500: BUY 7490, SL 7440, TP 7615 The US equity market enters the week supported by lower oil prices and easing inflation risks. This reduces pressure on Treasury yields and borrowing costs while improving the environment for companies sensitive to consumer spending. However, elevated equity valuations leave #SP500 highly dependent on corporate earnings. The Federal Reserve’s decision and earnings releases from major technology companies will test current profit expectations. Strong results and controlled spending on artificial intelligence could restore demand for the sector, while restrictive signals from the central bank may limit the upside. The decline in the energy risk premium supports the buying scenario. Trading idea: BUY 7490, SL 7440, TP 7615 #BRENT: SELL 91.80, SL 94.30, TP 86.80 Brent begins the week lower following a pause in US and Iranian strikes and renewed diplomatic efforts. The reduction in the immediate threat to supply is eroding the geopolitical premium after last week’s strong advance. However, traffic through the Strait of Hormuz remains restricted, which may keep volatility elevated. A sustained recovery in oil prices would require fresh evidence of supply disruptions or a breakdown in negotiations. As long as regional exports continue and the risk of a more restrictive Federal Reserve policy weighs on demand expectations, the base-case weekly scenario allows for a further decline in #BRENT. Trading idea: SELL 91.80, SL 94.30, TP 86.80 Only for our readers: mention the one-time promo code MR20 in the support chat and get +20% on your next deposit of any amount. The maximum bonus amount is $500. Only one promo code can be applied to a deposit at a time.
-
 papaking joined the community
 -
 DD123 joined the community
 -
Market Technical Analysis by RoboForex
RBFX Support replied to RBFX Support's topic in Technical Analysis
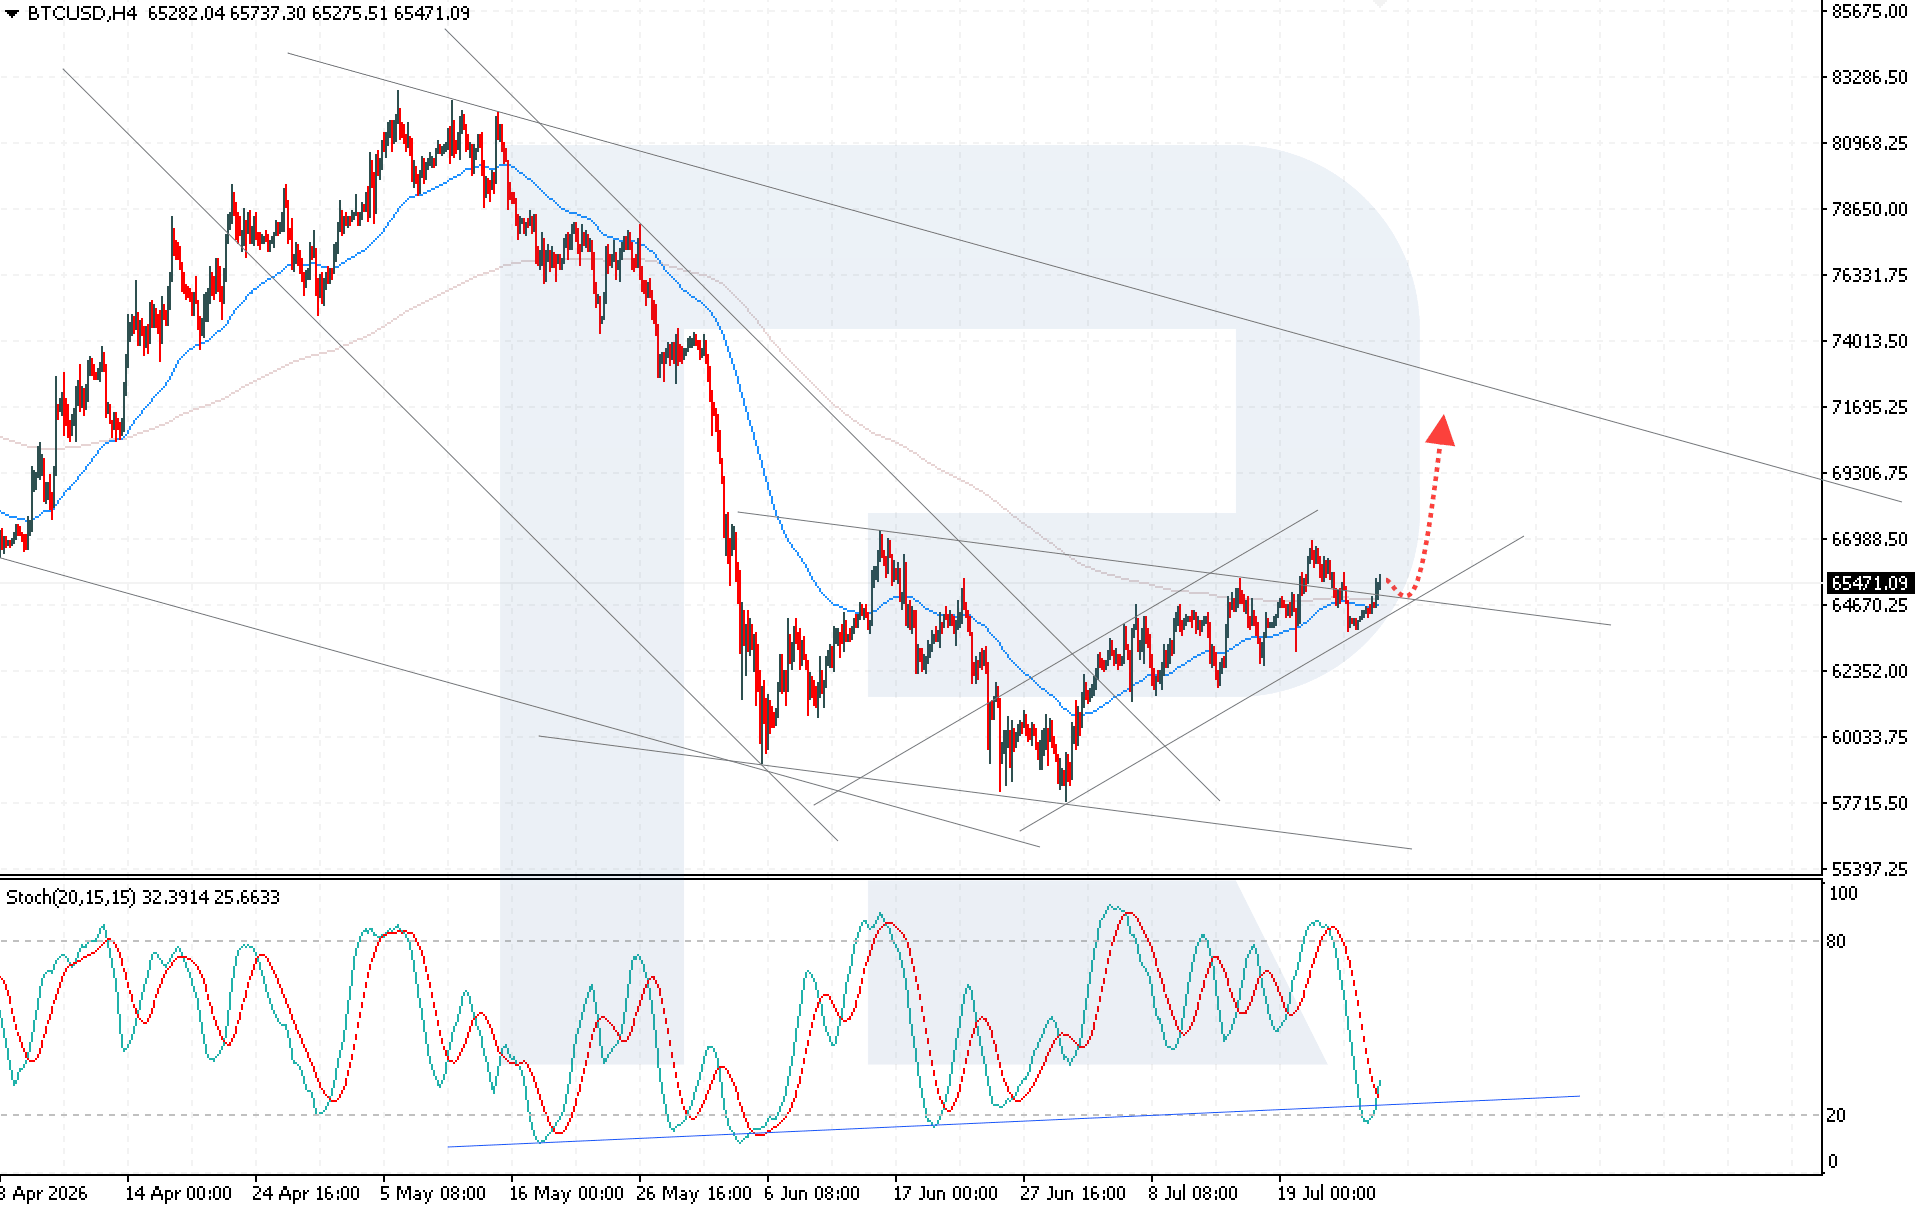
Bitcoin (BTCUSD) retains upside potential as geopolitical risks ease Bitcoin (BTCUSD) continues to recover as global market sentiment improves, with the price currently at 65,471. Technical outlook BTCUSD has consolidated firmly above the upper boundary of the descending channel, indicating increased buying pressure. Today’s BTCUSD forecast suggests the upward momentum may continue towards 71,695 USD. Today’s BTCUSD analysis indicates that buyers have the advantage. Read more - BTCUSD Forecast Attention! Forecasts presented in this section only reflect the author’s private opinion and should not be considered as guidance for trading. RoboForex bears no responsibility for trading results based on trading recommendations described in these analytical reviews. Sincerely, The RoboForex Team
-
roboforex Market Fundamental Analysis by RoboForex
RBFX Support replied to RBFX Support's topic in Fundamental Analysis
XAUUSD rebounds as the Fed prepares to change the rules of the game Gold is strengthening ahead of the Federal Reserve meeting, with prices currently at 4,085 USD. XAUUSD forecast: key takeaways The main event of the week is the Federal Reserve meeting Global central banks continue to diversify their international reserves in favour of gold XAUUSD forecast for 27 July 2026: 4,155 or 4,040 Fundamental analysis The XAUUSD price forecast for today, 27 July 2026, shows that gold, after failing to break below the 4,000 USD support level, is forming an upward wave and testing the 4,100 USD level. Oil prices declined following reports of a temporary pause in the confrontation between the US and Iran, reducing concerns about a new wave of inflation in the US and lowering the likelihood of a Federal Reserve rate hike. Against this backdrop, gold received support despite some decline in demand for traditional safe-haven assets. RoboForex Market Analysis & Forex Forecasts Attention! Forecasts presented in this section only reflect the author’s private opinion and should not be considered as guidance for trading. RoboForex bears no responsibility for trading results based on trading recommendations described in these analytical reviews. Sincerely, The RoboForex Team -
HFMarkets (hfm.com): Market analysis services.
AllForexnews replied to AllForexnews's topic in Fundamental Analysis
Date: 27th July 2026. Fed Decision in Focus as Oil Falls, Gold Holds Above $4,000 and US Dollar Weakens. Investors are bracing for a central bank decision from the US, UK, and Japan. The best-performing currencies at the weekly open so far are the Swiss Franc, Euro, and the Australian Dollar. The worst-performing currency is the US Dollar, which is trading 0.30% lower. The price movement is partially due to the upcoming central bank decisions and economic data. However, this was also influenced by the pause in hostilities between the US and Iran after 13 consecutive nights of attacks. This has caused lower oil prices, higher stocks, and a weaker US Dollar. US Dollar The price of the US Dollar over the past month has been trading within the range of 100.00 to 101.60. This is the region that is pricing in further rate hikes, but not necessarily an ultra- restrictive policy. The price is also witnessing a clear correlation between the currency and the conflict in the Middle East. As tensions rise and the conflict escalates, the US Dollar clearly trades higher due to its safe-haven status. Traders are opting for the USD as their safe-haven trade due to high interest rates and Gold’s uncompetitive pricing. The absence of new US strikes on Iran overnight marked another step towards de-escalation after nearly two weeks of sustained military exchanges. As Washington and Tehran refrained from launching further attacks, investors interpreted the pause as a sign that diplomatic efforts were gaining traction. For this reason, the US Dollar Index fell during this morning with a bearish gap measuring 0.24%. Though, investors should note that the geopolitical situation within the region particularly amongst Iran, Israel, US, Saudi Arabia, and Israel remains uneasy. In addition to this, the upcoming Federal Reserve rate decision is also largely influencing the US Dollar. Crude Oil Drops Over Renewed Hopes in Middle East Conflict The price of Crude oil saw a significant decline on Monday due to de-escalation within the region. The price closed on Friday evening at $90.85 and opened this morning at $84.60, measuring a 6.85% decline. This decline is vital as the Federal Reserve will soon make its rate decision. The Iranian Army Chief told the country’s national TV channel that it is no longer taking retaliatory action in order for Iran and Omani officials to meet and resolve shipping through the strait. The US is also doing the same, which gives investors the sense of lower tensions and lower risk. For this reason, oil prices are significantly lower and still declining. If the Strait of Hormuz does reopen and oil supply continues to increase, the price of oil could potentially fall back down to $70 per barrel. Most momentum-based indicators are also pointing towards a similar price movement. However, this will depend on whether ships can indeed pass through the strait. HFM - Crude Oil 30-Minute Chart If oil prices continue to fall, this could add further pressure on the US Dollar while slightly supporting Gold prices. Gold Rebounds As The Dollar Falls The price of Gold is trading above $4,000 after finding support from the weaker US Dollar. Some countries have also confirmed that they are taking advantage of the lower Gold prices in order to prop up their portfolios. In particular, China was seen active in the Gold market due to lower Gold prices and a strong Yuan. Chinese gold imports rose to a two-year high in June, to about 173 tonnes, according to the latest customs data. If the US Dollar continues to decline, Gold prices could retain momentum. However, this will largely depend on whether the US Dollar Index falls below 100.00 and on the Federal Reserve. Currently, markets expect the Federal Reserve to pause and then hike in September. If the Fed hikes earlier or indicates consecutive hikes, Gold could quickly retrace back below $4,000. HFM - Gold 30-Minutes Key Takeaways: The US Dollar weakens as easing Middle East tensions reduce safe-haven demand ahead of key central bank decisions. Crude oil dropped nearly 7% after signs of de-escalation between the US and Iran ease supply disruption concerns. Gold remains above $4,000, supported by a weaker US Dollar and strong physical demand, particularly from China. The Federal Reserve decision takes centre stage, with investors watching for clues on the timing of future interest rate hikes. Always trade with strict risk management. Your capital is the single most important aspect of your trading business. Please note that times displayed based on local time zone and are from time of writing this report. Click HERE to access the full HFM Economic calendar. Want to learn to trade and analyse the markets? Join our webinars and get analysis and trading ideas combined with better understanding of how markets work. Click HERE to register for FREE! Click HERE to READ more Market news. Michalis Efthymiou HFMarkets Disclaimer: This material is provided as a general marketing communication for information purposes only and does not constitute an independent investment research. Nothing in this communication contains, or should be considered as containing, an investment advice or an investment recommendation or a solicitation for the purpose of buying or selling of any financial instrument. All information provided is gathered from reputable sources and any information containing an indication of past performance is not a guarantee or reliable indicator of future performance. Users acknowledge that any investment in Leveraged Products is characterized by a certain degree of uncertainty and that any investment of this nature involves a high level of risk for which the users are solely responsible and liable. We assume no liability for any loss arising from any investment made based on the information provided in this communication. This communication must not be reproduced or further distributed without our prior written permission. -
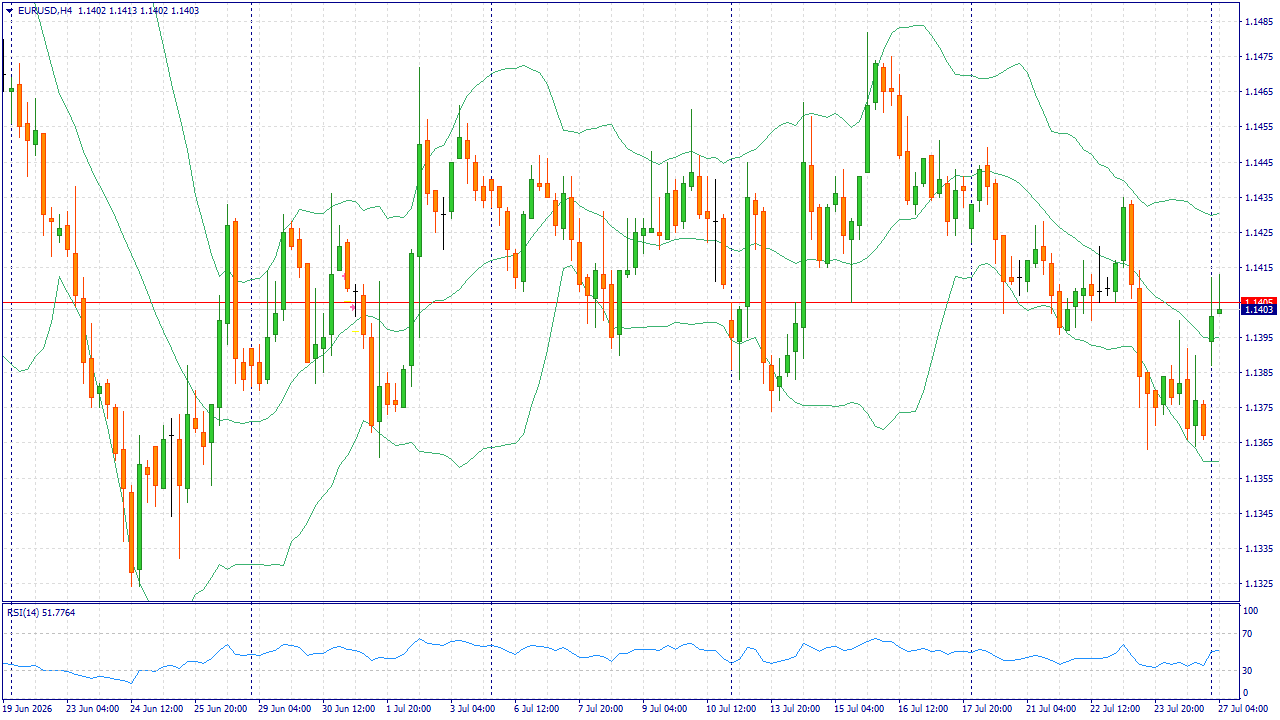
Market Fundamental Analysis for July 27, 2026 EURUSD EURUSD: EUR/USD begins the session recovering from last week’s decline. The pause in US strikes against Iran and the drop in oil prices have eased concerns about renewed acceleration in US inflation. The yield on the 10-year US Treasury note has fallen, while the probability of an immediate Federal Reserve rate increase has declined slightly. As a result, the dollar has lost some of the demand generated by geopolitical tensions. Only for our readers: mention the one-time promo code MR20 in the support chat and get +20% on your next deposit of any amount. The maximum bonus amount is $500. Only one promo code can be applied to a deposit at a time. For the euro, the outcome of the ECB’s latest meeting remains important. The central bank kept interest rates unchanged and confirmed that it would continue assessing incoming data without committing to a predetermined policy path. Uncertainty surrounding the energy shock is limiting a stronger recovery in the single currency, although today’s decline in oil prices reduces the risk of additional pressure on the eurozone economy and supports demand for the euro. The main driver of the current session is the dollar’s correction ahead of the Federal Reserve meeting, which begins on Tuesday. The market still expects the US central bank to deliver restrictive signals, limiting the upside potential for EUR/USD. Nevertheless, the latest momentum reflects lower Treasury yields and weaker defensive demand for the dollar, making a moderate continuation of the pair’s recovery the base-case scenario. Trading idea: BUY 1.1405, SL 1.1375, TP 1.1465
-
Welcome to Indo-Investasi.com. Please feel free to browse around and get to know the others. If you have any questions please don't hesitate to ask.
-

Thanks 🙏
-
-
wolftrader joined the community
-
Welcome to Indo-Investasi.com. Please feel free to browse around and get to know the others. If you have any questions please don't hesitate to ask.