⤴️-Paid Ad- Check advertising disclaimer here. Add your banner here.🔥
All Activity
- Past hour
-
the file i am using is DTBTradersIndicator_Strategy_BarsPack_21_Apr_2026_DTBTT00.zip from your post or this one. I think they are the same.
-
This is the one I'm using with ninjatrader 8.1.6.3 and level 2 data. BuySideGlobal_LiquidityZones (3).zip
- Today
-

HFMarkets (hfm.com): Market analysis services.
AllForexnews replied to AllForexnews's topic in Fundamental Analysis
Date: 29th April 2026. UAE Exits OPEC: Oil Falls, Markets Brace for the Federal Reserve. Introduction: A Market at a Crossroads Global financial markets are navigating a complex mix of geopolitical tension, shifting energy dynamics, and critical macroeconomic events. Oil prices have come under pressure following the United Arab Emirates’ decision to leave OPEC, while Asian equities have shown resilience despite weakness on Wall Street. At the same time, investors are closely watching the upcoming decision from the Federal Reserve and a wave of earnings from major technology companies. This combination of factors is creating a fragile but opportunity-rich environment for traders. Oil Prices Slide Despite Ongoing Geopolitical Risks At first glance, falling oil prices may seem counterintuitive given the ongoing geopolitical tensions in the Middle East. However, markets are currently balancing two opposing forces. On one hand, the UAE’s exit from OPEC signals a potential increase in global oil supply. The country has long expressed frustration with production quotas and is expected to expand output once it leaves the group. This weakens OPEC’s ability to control supply and stabilise prices. On the other hand, geopolitical risks remain elevated. The continued disruption in the Strait of Hormuz, a critical chokepoint for global oil flows, alongside stalled US-Iran negotiations, continues to support oil prices. As a result, oil markets are not trending in a clear direction. Instead, traders are seeing increased volatility, driven by headlines rather than fundamentals alone. Asian Stocks Show Strength While Wall Street Pulls Back Equity markets are telling a slightly different story. In the United States, major indices retreated from recent highs. The S&P 500 and the Nasdaq Composite both declined, led by weakness in technology stocks such as Nvidia and Broadcom. Meanwhile, Asian markets moved higher, with gains in the Hang Seng Index, Shanghai Composite Index, and KOSPI. This divergence highlights a key theme in current markets: regional momentum and positioning differences. Asian equities are benefiting from strong inflows and optimism around artificial intelligence, while US markets are experiencing profit-taking after a strong rally. China and Copper: A Quiet but Important Signal While oil and equities are dominating headlines, developments in China and the copper market are offering an additional layer of insight into global economic expectations. Copper prices have recently moved higher, supported by renewed buying interest from Chinese manufacturers ahead of the Labor Day holiday. As the world’s largest consumer of industrial metals, China plays a critical role in shaping demand dynamics for copper. Often referred to as “Dr. Copper” for its ability to diagnose the health of the global economy, the metal is widely used in construction, infrastructure, and manufacturing. As such, price movements can act as a leading indicator of economic activity. The latest uptick suggests short-term demand resilience, particularly as buyers take advantage of recent price declines to replenish inventories. However, the broader picture remains mixed. Concerns about global growth persist, while regulatory tightening in China’s commodity markets could limit trading activity and slow inventory drawdowns. For traders, this creates an important contrast. While oil is being driven primarily by geopolitical developments and equities by artificial intelligence optimism, copper reflects underlying industrial demand, particularly from China. This divergence highlights a key takeaway: markets are currently being influenced by multiple, and sometimes conflicting, narratives. When signals across asset classes are not aligned, it often points to an environment where volatility can increase and trends become less predictable. Big Tech Earnings: A Key Catalyst for Market Direction Technology stocks remain central to the broader market narrative. Investors are closely watching earnings from major players, including Microsoft, Amazon, Alphabet, and Meta Platforms. The sector is expected to deliver strong growth, driven largely by continued investment in artificial intelligence. Estimates suggest that capital expenditure among these companies could exceed $500 billion in 2026, with earnings growth significantly outpacing other sectors. For traders, this means that market direction in the near term may depend heavily on whether these companies meet or exceed expectations. Strong results could support the ongoing rally, while disappointments may trigger a broader pullback. Federal Reserve Decision: The Macro Wildcard Alongside earnings, the upcoming decision from the Federal Reserve represents a major risk event. The central bank faces a challenging environment. Elevated oil prices have the potential to push inflation higher, complicating the outlook for interest rate cuts. At the same time, economic uncertainty remains, particularly given geopolitical tensions. Markets will be paying close attention not only to the rate decision itself but also to forward guidance. Any shift in tone regarding inflation or monetary policy could have a significant impact across asset classes. Safe Havens and Alternative Assets Reflect Caution While equities remain relatively resilient, other asset classes suggest a more cautious tone. Gold extended its decline yesterday following a technical breakdown from its recent consolidation range. The primary headwind for precious metals continues to be the increasingly hawkish stance from central banks, driven by renewed inflation concerns. This backdrop is unlikely to shift in the near term. US President Donald Trump has rejected Iran’s proposal to reopen the Strait of Hormuz before engaging in nuclear negotiations, keeping geopolitical tensions elevated. At the same time, with US equity markets trading at record highs, there appears to be limited immediate political or market pressure for compromise. However, this dynamic raises the risk of a more significant market correction ahead. If the Strait of Hormuz remains closed for an extended period and oil prices stay elevated, inflationary pressures could intensify. In such a scenario, the Federal Reserve may be forced to maintain a tighter policy stance for longer, or even consider additional rate hikes in the coming months. US Treasury yields have held steady, suggesting that markets are not yet pricing in a major shift in macro conditions, but this could change quickly depending on upcoming developments. What Traders Should Watch Next With multiple catalysts in play, the coming days could be pivotal for market direction. Key areas to monitor include: Developments in the Middle East, particularly around the Strait of Hormuz The impact of the UAE’s exit from OPEC on oil supply Earnings results from major technology companies Guidance from the Federal Reserve Conclusion: A Market Driven by Three Core Forces Markets are currently being shaped by three dominant themes: energy, technology, and monetary policy. Oil is reacting to both structural changes in supply and ongoing geopolitical risks. Equities are being driven by expectations around AI and corporate earnings. Meanwhile, central bank policy remains a key uncertainty. For traders, this is not a market defined by a single trend, but by the interaction of multiple forces. Staying flexible and responsive to new information will be essential in navigating the current environment. Always trade with strict risk management. Your capital is the single most important aspect of your trading business. Please note that times displayed based on local time zone and are from time of writing this report. Click HERE to access the full HFM Economic calendar. Want to learn to trade and analyse the markets? Join our webinars and get analysis and trading ideas combined with better understanding of how markets work. Click HERE to register for FREE! Click HERE to READ more Market news. Andria Pichidi HFMarkets Disclaimer: This material is provided as a general marketing communication for information purposes only and does not constitute an independent investment research. Nothing in this communication contains, or should be considered as containing, an investment advice or an investment recommendation or a solicitation for the purpose of buying or selling of any financial instrument. All information provided is gathered from reputable sources and any information containing an indication of past performance is not a guarantee or reliable indicator of future performance. Users acknowledge that any investment in Leveraged Products is characterized by a certain degree of uncertainty and that any investment of this nature involves a high level of risk for which the users are solely responsible and liable. We assume no liability for any loss arising from any investment made based on the information provided in this communication. This communication must not be reproduced or further distributed without our prior written permission. -

roboforex Market Fundamental Analysis by RoboForex
RBFX Support replied to RBFX Support's topic in Fundamental Analysis
Gold (XAUUSD) does not believe in a miracle: prices are falling due to the Middle East and its consequences Gold (XAUUSD) is declining to 4,598 USD as inflation risks are exerting too much pressure. Discover more in our analysis for 29 April 2026. XAUUSD forecast: key takeaways Gold (XAUUSD) quotes are moving downwards as inflation risks are increasing significantly Global central banks will be forced either to keep rates unchanged or to raise them XAUUSD forecast for 29 April 2026: 4,580 or 4,500 Fundamental analysis Gold (XAUUSD) is holding below 4,600 USD per ounce on Wednesday after falling by almost 2% the previous day. The current levels are the lowest in a month. Pressure is linked to the lack of progress in US-Iran negotiations and the blockade of the Strait of Hormuz. According to Donald Trump, Iran is demanding that the naval blockade be lifted while negotiations continue. At the same time, disruptions have already reduced energy supplies from the Middle East. The closure of the strait restricts about 20% of global oil flows, which the IEA describes as the largest supply shock. This is increasing inflationary pressure. RoboForex Market Analysis & Forex Forecasts Attention! Forecasts presented in this section only reflect the author’s private opinion and should not be considered as guidance for trading. RoboForex bears no responsibility for trading results based on trading recommendations described in these analytical reviews. Sincerely, The RoboForex Team -
Market Technical Analysis by RoboForex
RBFX Support replied to RBFX Support's topic in Technical Analysis
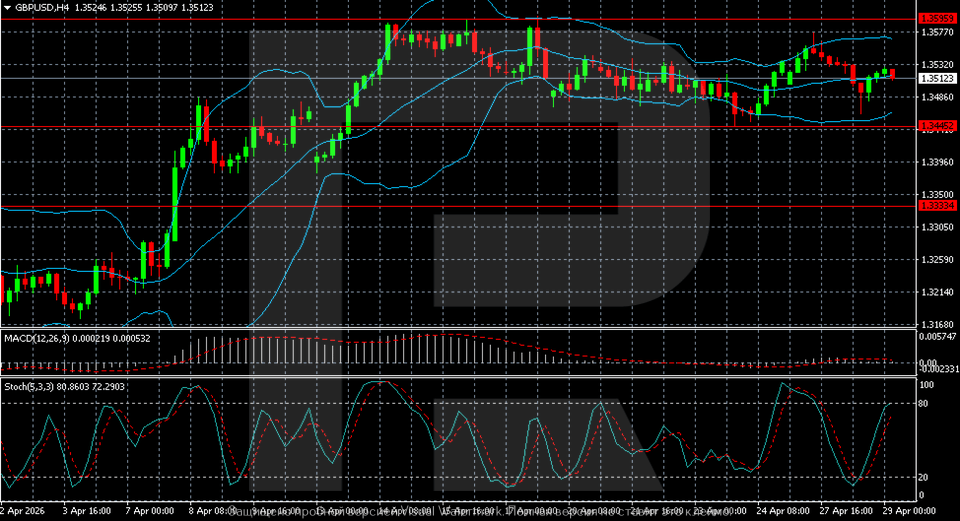
GBPUSD under pressure: what will the Bank of England decide? The GBPUSD pair is pulling back to 1.3512 midweek, with investors conserving energy ahead of the BoE meeting. Find more details in our analysis for 29 April 2026. Technical outlook The GBPUSD H4 chart shows that after a strong upward momentum from below 1.3400, the pair moved into the 1.3500–1.3600 zone, where the move slowed noticeably. Local resistance formed near 1.3590, and the market has rebounded downwards from this level several times. The GBPUSD pair is retreating slightly, but it will conserve energy until the Bank of England’s decision on Thursday. Read more - GBPUSD Forecast Attention! Forecasts presented in this section only reflect the author’s private opinion and should not be considered as guidance for trading. RoboForex bears no responsibility for trading results based on trading recommendations described in these analytical reviews. Sincerely, The RoboForex Team
-
For anyone on interactive brokers, I ported @kimsams work to IB Gateway. Short of it is that it sucks. API rate limits, slow responses, symbol confusion. May well be user error but its probably easier to open a Scwab account and put a little bit of cash into it.
-
 ⭐ RichardGere reacted to a post in a topic:
Timingsolution & Nifty Updates - 3
⭐ RichardGere reacted to a post in a topic:
Timingsolution & Nifty Updates - 3
-
The BSG liquidity zone indicator used to work but it's not working anymore. Whenever I apply it on my chart, it disappears. anyone has the same issue? Not able to fix it. I am using non edu ninja latest version
-
Dimdium reacted to a post in a topic:
Entropy Voltex by renkokings
-
Few videos, includes the Settings. https://workupload.com/archive/JXS7gjkPyF
-
Love it when you mentioned the RR ratio. One could win 90% of the time but with terrible risk management and losses that can wipe out that 90%, is definitely a disaster. Thank you.
-
Ninja_On_The_Roof reacted to a post in a topic:
Entropy Voltex by renkokings
-
https://www.tradeguider.com/resource_center1.asp https://www.tradeguider.com/customer/pdf/VSA47_ninjatrader8.pdf
-
Sorry. I will look for another file I have somewhere.
-
Sorry, that is it. BWT and MWT are the best. Looks like they improved the MWT recently...so i don't which version you have. But this is most of it. Which file did you load?
-
⭐ option trader reacted to a post in a topic:
All the cycles knwes for Amibroker 7.00.1 64 bit.
-
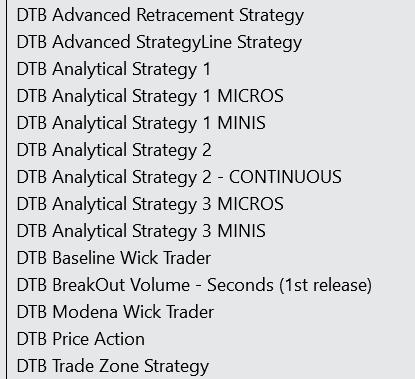
by DWT, did you mean BWT? (Baseline Wick Trader)? This is the list of bots I can see:
-
 Oana SSS reacted to a post in a topic:
https://www.dtbtraders.com/
Oana SSS reacted to a post in a topic:
https://www.dtbtraders.com/
-
nefre821 reacted to a post in a topic:
Timingsolution & Nifty Updates - 3
-
You posted it in a separate thread but people like to create duplicates. So, MWT and DWT are the bots to use? They have many templates. Do you know which ones to recommend using?
-
chauchau1208 reacted to a post in a topic:
Timingsolution & Nifty Updates - 3
-
fxtrader99 reacted to a post in a topic:
https://www.dtbtraders.com/
-
I shared the most recent files a couple of days ago but i don't see my link anywhere
-
Tried this before. MWT strategy in there does not look right and the DWT strategy there is missing. Those are their main strategies
-

NQ Ultra - Futures Trading Bot // https://tradegreater.com/
Boka replied to luludulu's topic in Ninja Trader 8
forward test or market replay -

NQ Ultra - Futures Trading Bot // https://tradegreater.com/
sa5f replied to luludulu's topic in Ninja Trader 8
So, how do you backtest? -
⭐ sapperindi reacted to a post in a topic:
Timingsolution & Nifty Updates - 3
-
NQ Ultra - Futures Trading Bot // https://tradegreater.com/
Boka replied to luludulu's topic in Ninja Trader 8
HA Candles backtest results are absolutely 100% incorrect. -
NQ Ultra - Futures Trading Bot // https://tradegreater.com/
sa5f replied to luludulu's topic in Ninja Trader 8
My Heiken Ashi Backtest -
NQ Ultra - Futures Trading Bot // https://tradegreater.com/
Boka replied to luludulu's topic in Ninja Trader 8
Which candles are you using to run this algo? If you are using Renko candles, then the backtest results are absolutely 100% incorrect. -
hxxps://workupload.com/file/739h9rzK6xw 🍦
-
NQ Ultra - Futures Trading Bot // https://tradegreater.com/
sa5f replied to luludulu's topic in Ninja Trader 8
Have you noticed a discrepancy? The results from backtesting and live trading are completely different—the disparity is massive. Is there any way to make the backtesting results more closely align with live performance? - Yesterday
-
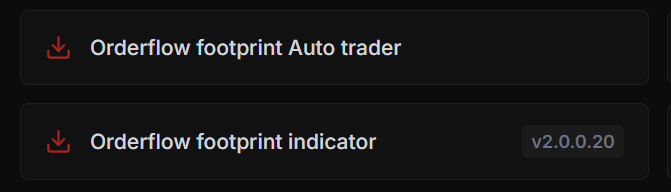
 which v26 are you referring to? I only see 2.0.0.20 on their website. Tnis is wnat it looks like without tick replay: https://ibb.co/vpRdTpC
-
I 100% agree. NinzaCo's marketing (and many others like it) is all about visual impact and instant gratification. A video can never, and I mean never, be the basis for judging a trading system. Videos are, by definition, 'cherry-picked', meaning they only show the specific market segments where the indicator worked perfectly! To consider a trading system truly reliable and profitable, you need much more than a few catchy clips. Here is what actually matters: Rigorous Statistical Backtesting: 10 trades are not enough. You need a sample size of hundreds, if not thousands, of trades across different market cycles (trends, sideways markets, high and low volatility). Max Drawdown Analysis: The real question isn’t 'how much does it make when it wins,' but rather 'how much do you lose and how long do you stay in the red' when the system inevitably goes through a losing streak. Profit Factor and Risk/Reward: A system that wins 90% of the time but has a terrible risk/reward ratio (where one single loss wipes out ten wins) is destined to fail. Forward Testing (Live or Demo): You have to see how the system reacts in real-time, accounting for spread, slippage, and actual volatility. Robustness and Overfitting: Many of these indicators are over-optimized for past data. They worked great yesterday, but they will stop working tomorrow because they cannot adapt to changing market conditions.