⤴️-Paid Ad- Check advertising disclaimer here. Add your banner here.🔥
All Activity
- Past hour
-
 ampf reacted to a post in a topic:
TWST Analyzer Templates
ampf reacted to a post in a topic:
TWST Analyzer Templates
-
Thank you @kimsam
-
Not stable yet .. got many updates ..
-
kimsam reacted to a post in a topic:
KimSam NT8 GEX Calc
-
Who here has TWST Analyzer which can shre their experience with it? Also could be useful if someone could share their templates here. Thank you all
-
 That's why doing some of your own research is recommended to find out the broker's processes and ease of use in my opinion.
 - Today
-
Just trying to keep CPU under 70%. Share your instance/RAM ratios if using VPS services for MT4 or MT5.
-
@kimsam Few ideas to consider in your next updates 1. Calculate gamma intensity based on expiry distribution. Determines what % of total gamma expires in the next 7 days. Higher % = more sticky levels (scalp only) Lower % = more flexible levels (can hold longer). if > 65 ==> EXTREME > 50 HIGH > 35 MODERATE > 15 LOW 2. Stability score as a weighted mix of gamma concentration and distance from the gamma flip level. Compute gamma concentration: concentration=std(TotalGamma) / max(TotalGamma)−min(TotalGamma)concentration (or 0 if the range is 0). Compute normalized distance from flip flip_stability=min(100, ((spot_price − gamma_flip) *1000)/spot_price) Combine them into one score: stability=40*concentration+60*flip_stability Then label the regime based on that numeric stability value: If stability < 30 → "UNSTABLE". If 30 ≤ stability < 60 → "MODERATE". If stability ≥ 60 → "STABLE". 3. Pin force : Directional pin pull strength (index-style 0–100+ score). Positive = pin above spot (upward pull), negative = pin below spot. Steps could be : a) Get gamma at pin (or nearest strike) b) Normalize by total absolute gamma (how concentrated this pin is) c) Penalize by distance in % terms d) Add direction and calculate Pin force. 4. Flow divergence : YES if volume and OI point opposite directions divergence = abs(call_vol_pct - call_oi_pct) > 0.15
-
Both are NT8 drawing tools.
-
TRADER reacted to a post in a topic:
Thank you for your warm welcome
-
Hello everyone, I sincerely appreciate your welcoming into the community. I enjoy learning and I am looking forward to grow alongside everyone here. I desire to participate in the community, contribute and "gratis" share my acquired knowledge. Thank you very much.
-
- 1
-
-
juanfer reacted to a post in a topic:
AnchoredVP、AnchoredVWAP
-
Hello, are these indicators or drawing tools?
-
⭐ ajeet reacted to a post in a topic:
KimSam NT8 GEX Calc
-
⭐ ajeet reacted to a post in a topic:
Fixed ... QPilotPro_1_0_1_0
-
⭐ ajeet reacted to a post in a topic:
Andean Oscillator Indicator
-

roboforex Market Fundamental Analysis by RoboForex
RBFX Support replied to RBFX Support's topic in Fundamental Analysis
Brent oil prices back at 100 USD: what is hidden behind Iran’s threats and geopolitics After falling sharply, Brent prices are recovering and testing the 100.00 USD mark. Find out more in our analysis for 26 March 2026. Brent forecast: key takeaways Iraq and its neighbours are being forced to cut oil production Oil continues to trade on the news Brent forecast for 26 March 2026: 105.50 Fundamental analysis The Brent fundamental analysis for today, 26 March 2026, takes into account that Brent crude is playing a dangerous pricing game, recovering the previous session’s losses amid contradictory signals about negotiations between the US and Iran. In the morning, oil prices again moved above the 100 USD per barrel mark. The main narrative of today is the market’s understanding that the key artery of global oil trade remains paralysed despite a temporary easing in rhetoric. Iran officially notified the International Maritime Organization that it would allow passage through the strait only to vessels from friendly countries, subject to coordination and payment of fees. RoboForex Market Analysis & Forex Forecasts Attention! Forecasts presented in this section only reflect the author’s private opinion and should not be considered as guidance for trading. RoboForex bears no responsibility for trading results based on trading recommendations described in these analytical reviews. Sincerely, The RoboForex Team -
Market Technical Analysis by RoboForex
RBFX Support replied to RBFX Support's topic in Technical Analysis
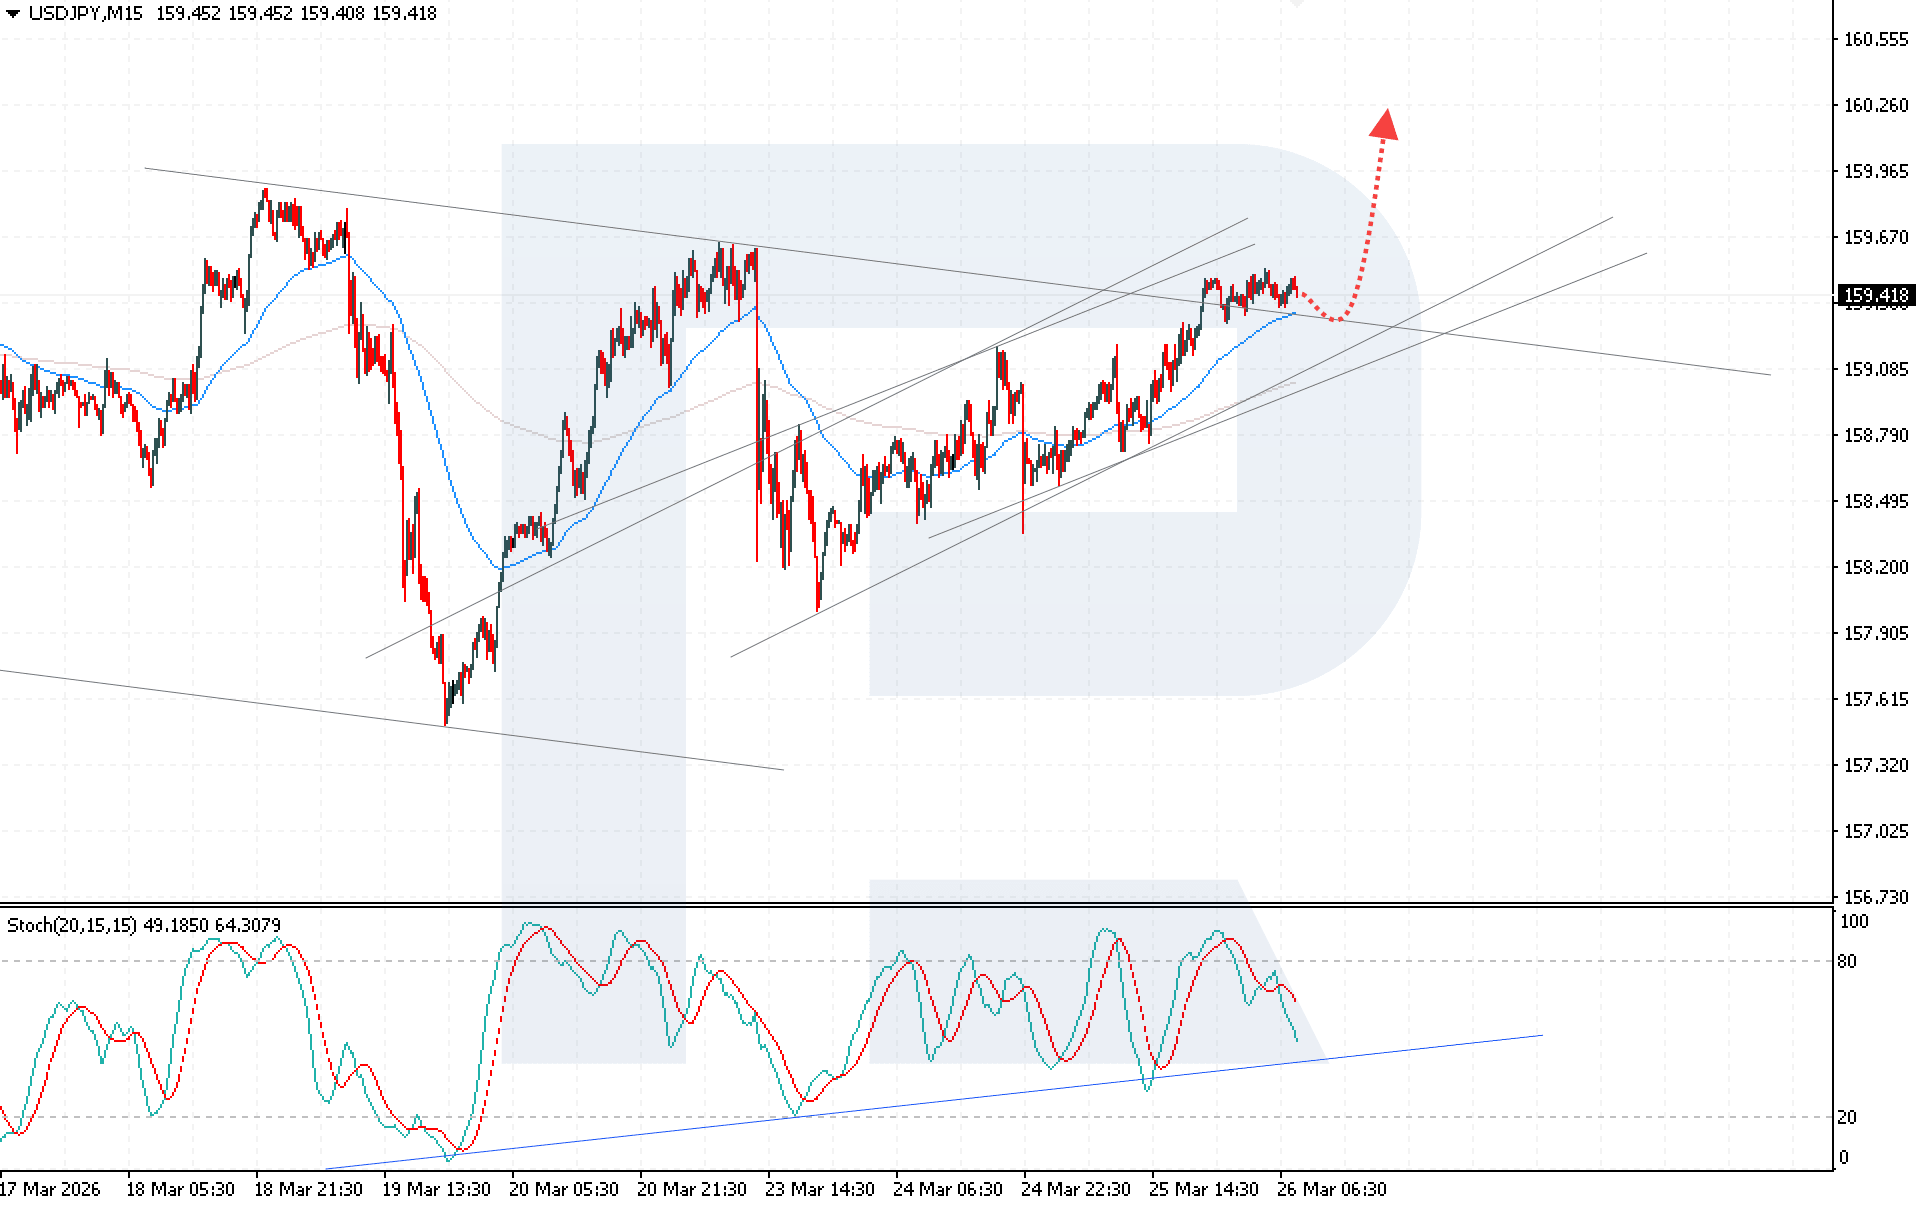
USDJPY ignores BoJ signals and continues to rise The USDJPY rate continues its confident upward movement, supported by geopolitical tension and steady demand for the US dollar. The rate currently stands at 159.41. Discover more in our analysis for 26 March 2026. Technical outlook USDJPY quotes have consolidated above the upper boundary of the previously formed descending channel, indicating a shift in the short-term trend towards growth. Buyers are confidently holding the price above the EMA-65, confirming stronger bullish pressure. The combination of geopolitical risks, steady demand for the US dollar. Read more - USDJPY Forecast Attention! Forecasts presented in this section only reflect the author’s private opinion and should not be considered as guidance for trading. RoboForex bears no responsibility for trading results based on trading recommendations described in these analytical reviews. Sincerely, The RoboForex Team
-
⭐ ajeet reacted to a post in a topic:
Fixed .. Maverick bundle lastest update march 2026
-

HFMarkets (hfm.com): Market analysis services.
AllForexnews replied to AllForexnews's topic in Fundamental Analysis
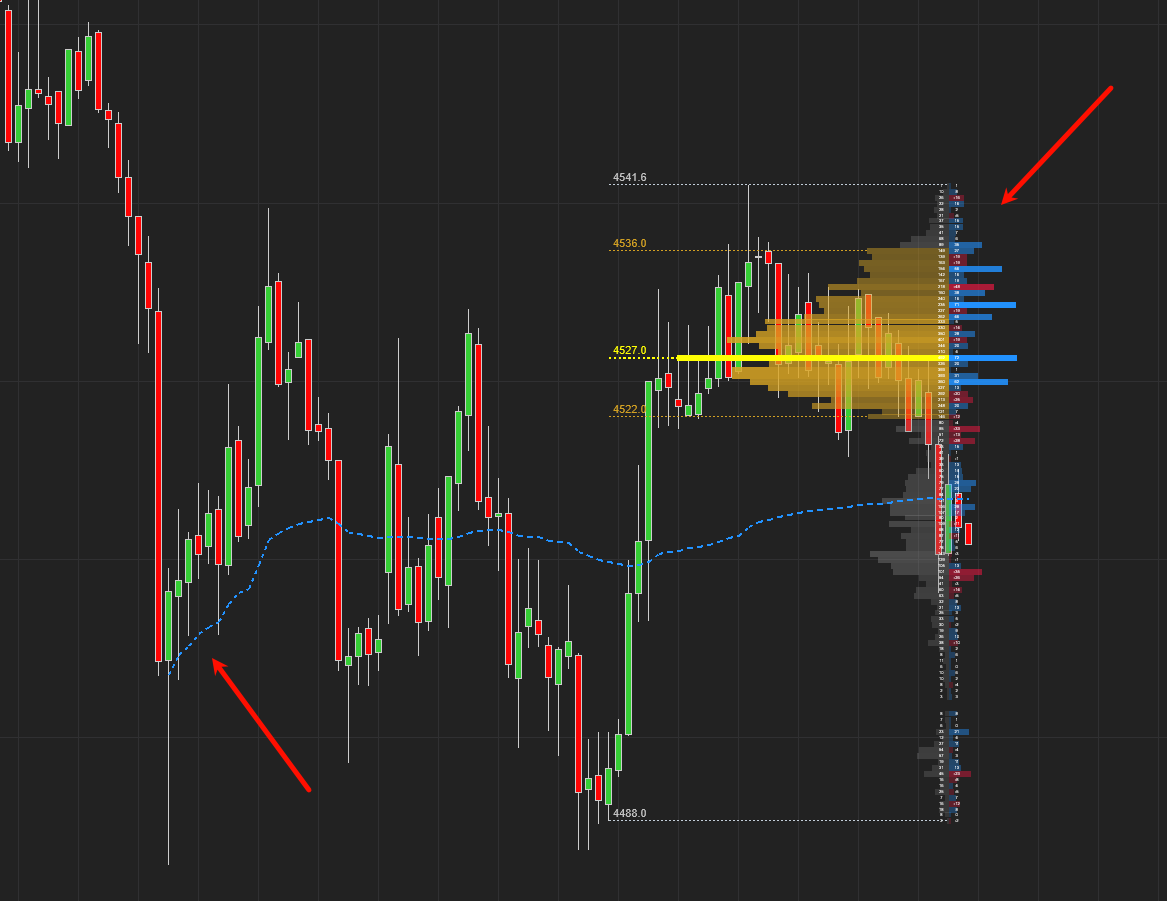
Date: 26th March 2026. Rising Bond Yields and a Stronger US Dollar Pressure Gold and the AUD. The latest inflationary figures from Australia have put the year’s best performing currency under rare pressure. The Australian Dollar was at times trading more than 7% higher in 2026 alone. This was mainly due to the unwinding of short trades, a hawkish central bank, and strong economic growth. However, the latest inflation figures did not live up to expectations, and the currency is also under pressure from weak Gold prices and a strong US Dollar. AUDUSD - Week Inflation Pressures the Best Performing Currency of 2026 The Australian Dollar continues to remain the year’s best performing currency even after weakening over the past two-weeks. The currency is currently trading 4.20% higher in 2026 so far, while the US Dollar trades 1.75% higher. The US Dollar is now the second best performing currency due to the bullish trend since the start of the US-Iran conflict. The AUDUSD has been in a downward trend since March 11th. Though within this period, the Australian Dollar has continued to show signs of strength despite the trend. However, the trend saw a relatively one-sided trend on Wednesday due to the inflation figures. Analysts had been expecting Australia’s inflation rate to remain at 3.8% and for inflation to rise by 0.1% on a monthly basis. However, no inflation was recorded for February and the inflation rate fell from 3.8% to 3.7%. Nevertheless, the inflation figures do not take into consideration the conflict and supply chain disruptions from the past few weeks. For this reason, analysts continue to believe the Reserve Bank of Australia will remain on a hawkish path. For this reason, investors continue to believe that inflation will rise, as will interest rates. This is likely to support the Australian Dollar even though it may see stronger resistance against the US Dollar. The EURAUD and AUDJPY may see a more one-sided trend. Furthermore, Ursula von der Leyen and Anthony Albanese announced that the EU and Australia had completed negotiations on a free trade agreement. This means many goods traded between them will become cheaper and easier to sell, as import taxes will be reduced or removed. This could also support the Australian Dollar. Australia will remove tariffs on many European goods such as wine, fruit and vegetables, chocolate, sugar, and other processed foods. The EU will also reduce or remove import barriers on many Australian goods, including wine, nuts, fruit, honey, some dairy products, and seafood, while allowing larger amounts of Australian beef, sugar, and rice to enter at lower tariffs. HFM AUDUSD 1-Hour Chart In terms of technical analysis, the price maintains indications of a downward trend for the short to medium term, but with strong spikes upwards. The average spike against the US Dollar in recent weeks measures 1.85%. The price remains below the moving average of the 2-hour chart and in the negative area of the RSI. However, on a 5-minute chart, the price holds a neutral indication while the exchange rate is relatively close to a key support area. If the AUDUSD’s price rises above 0.69522, buy signals are likely to materialise. Whereas, a price below 0.69395 will see sell signals strengthen. XAUUSD - Bond Yields and the Dollar Pressure Gold Prices! The World Gold Council said Gold is falling mainly because US government bond yields are rising. Economists also advise the stronger US Dollar and Gold reserve sales from the Middle East are also significantly pressuring Gold. When bond yields go up, gold often becomes less attractive to investors because gold does not pay interest. Right now, the 10-year US Treasury yield has risen to around 4.4%, and this has put pressure on gold prices. This reflects the usual pattern where gold and bond yields often move in opposite directions. At the same time, the Council said geopolitical tensions still matter a lot. If tensions in the Middle East ease, such as safer shipping through the Strait of Hormuz or progress in US-Iran talks, the balance in the market could change. Investors have also not fully abandoned precious metals, as silver and gold positioning remains relatively stable. Trading activity has increased compared with last week, which shows that interest in the market is still active, even though gold remains under pressure. The asset is currently witnessing a bearish bias due to the recent bearish momentum. In order for technical analysis and indicators to start pointing towards a potential uptrend, the price will need to rise above $4,536.65 for a stronger signal or $4,469.86 for a short-term bullish signal. HFM XAUUSD 1-Hour Chart Key Takeaways: The Australian Dollar remains 2026’s best-performing currency, but recent pressure has weakened its momentum. Softer-than-expected Australian inflation data triggered the latest decline in the Australian Dollar. Markets still expect the Reserve Bank of Australia to remain hawkish, which may support the currency. A stronger US Dollar and weaker Gold prices are creating added pressure on the Australian Dollar. Gold remains under pressure from rising US bond yields and the stronger US Dollar. Always trade with strict risk management. Your capital is the single most important aspect of your trading business. Please note that times displayed based on local time zone and are from time of writing this report. Click HERE to access the full HFM Economic calendar. Want to learn to trade and analyse the markets? Join our webinars and get analysis and trading ideas combined with better understanding of how markets work. Click HERE to register for FREE! Click HERE to READ more Market news. Michalis Efthymiou HFMarkets Disclaimer: This material is provided as a general marketing communication for information purposes only and does not constitute an independent investment research. Nothing in this communication contains, or should be considered as containing, an investment advice or an investment recommendation or a solicitation for the purpose of buying or selling of any financial instrument. All information provided is gathered from reputable sources and any information containing an indication of past performance is not a guarantee or reliable indicator of future performance. Users acknowledge that any investment in Leveraged Products is characterized by a certain degree of uncertainty and that any investment of this nature involves a high level of risk for which the users are solely responsible and liable. We assume no liability for any loss arising from any investment made based on the information provided in this communication. This communication must not be reproduced or further distributed without our prior written permission. -

The Polarity Factor System (Daniele Prandelli)
⭐ FFRT replied to pathfinder's topic in Trading Systems & Strategies Request
anyone having this book, it is quite old now and someone should have it ! -
 KJs reacted to a post in a topic:
Leavitt Autotrader -
KJs reacted to a post in a topic:
Leavitt Autotrader -
-
True that. Just need proof.
-
all videos are there on youtube
-
Jhon Snow allows installation on multiple PCs. But you may have to show pictures of the PCs should he request. I have his Optuma on 3 of my computers. Bought it in 2021 and later requested for an upgrade in 2025. The upgrade was for 3 computers as well.
-
They wouldn't do that or else, how are they making money selling stuff. They need to protect their educated ones so no, only 1 PC for 1 license. Locked up.
-
VP requires tick data to draw correctly.
-
Does John Snow offer programs that work on multiple devices?
-
AnchoredVP、AnchoredVWAP AnchoredVP.zip AnchoredVWAP.zip
-
 xiuli818 joined the community
 -
Hi everyone, thanks a lot for sharing this tool, really appreciate the work behind it. I just have a few questions before setting everything up: Is it possible to install and use this without a Charles Schwab account, or is a Schwab account mandatory for the API access? Do we need both a Schwab trading account AND a developer account, or is the developer access alone enough? Could someone outline the exact steps required to get this fully running (from Python setup to NT8 integration)? Are there any common issues (API approval, token errors, permissions) we should be aware of before starting? Would really help to understand the full setup process before diving in. Thanks in advance 🙏
-
What I used to do was that, when my trade went into a decent profit, I would just kill its stoploss then placed back my own, so I could move it anywhere I wanted. Eventually, I just looked at other strats from this bot, then I copied their stoplosses/targets/trailing, then I placed it in the strategy that I used. This way, it would move accordingly and more suitable for what I wanted it to do. But this is just me! You shouldn't do the same. Be aware that it has a whole bunch of strats within it. You could pick whichever one you think it is suitable for your trading style. It has its own stoploss/target/trailing, in different ways. So, you might need to play around and see which one is cool enough for you.
-
I think it is from the White House, that Press Secretary lady named Leavitt.🤪
-
Looks perfect.