

⤴️-Paid Ad- Check advertising disclaimer here. Add your banner here.🔥
All Activity
- Past hour
- Today
-
 moabdo joined the community
 -
Russell Sands - Turtle Trading Concepts - ANYBODY HAVE THEN PLS PROVIDE LINK ITS OLD AND HARD TO FIND
-
 SHYAM reacted to a post in a topic:
Larry Williams Market Forecast 2025
SHYAM reacted to a post in a topic:
Larry Williams Market Forecast 2025
-

roboforex Market Fundamental Analysis by RoboForex
RBFX Support replied to RBFX Support's topic in Fundamental Analysis
Solana receives double support: ETFs grow as Alpenglow speeds up the network SOLUSD continues to strengthen today amid the development of regulated infrastructure. The current SOLUSD rate stands at 85.85 SOLUSD forecast: key takeaways Spot products on Solana continue to attract capital The Alpenglow upgrade is expected to significantly accelerate transaction finality SOLUSD forecast for 20 August 2026: 89.00 or 83.60 Fundamental analysis Spot products on Solana continue to attract capital, while interest from large investors is supported by the development of regulated infrastructure. An additional positive factor is Bitwise’s plans to tokenise its Solana staking ETF through Superstate. The main fundamental driver for the ecosystem is Alpenglow. The upgrade is expected to significantly accelerate transaction finality, with a target of around 150 ms compared to approximately 12.8 seconds for the current TowerBFT finalisation. RoboForex Market Analysis & Forex Forecasts Attention! Forecasts presented in this section only reflect the author’s private opinion and should not be considered as guidance for trading. RoboForex bears no responsibility for trading results based on trading recommendations described in these analytical reviews. Sincerely, The RoboForex Team -
Market Technical Analysis by RoboForex
RBFX Support replied to RBFX Support's topic in Technical Analysis
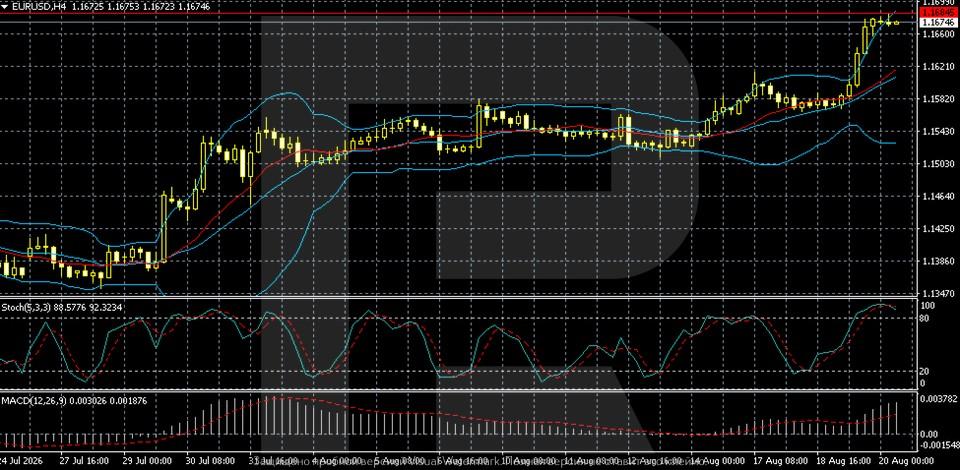
EURUSD hits three-month high as the US intervenes in the debt market The EURUSD pair rose to 1.1674. The US Treasury’s measures have left the dollar without support. Technical outlook On the H4 chart, the EURUSD pair maintains a clear bullish structure. After breaking out of consolidation in the 1.1570–1.1590 area, the pair accelerated sharply higher and is now trading around 1.1675, close to the upper Bollinger Band. The EURUSD pair climbed towards a three-month high. Read more - EURUSD Forecast Attention! Forecasts presented in this section only reflect the author’s private opinion and should not be considered as guidance for trading. RoboForex bears no responsibility for trading results based on trading recommendations described in these analytical reviews. Sincerely, The RoboForex Team
-

HFMarkets (hfm.com): Market analysis services.
AllForexnews replied to AllForexnews's topic in Fundamental Analysis
Date: 20th August 2026. Historic US Intervention Sees Gold Spike More Than 4%. A historic day for the US and for global banking and finance. The US Dollar fell to its lowest point since the first half of May 2026 and Gold saw its largest increase in two months. The US Treasury, for the first time in decades, intervened in the bond market to purposely lower yields. In addition to this, Trump told journalists that the economic plan for Iran is starting soon. The US Treasury is a regular buyer of US bonds, but not in the same way as the Fed and not to influence the market. The Treasury would normally purchase bonds in order to manage its debt maturity profile. However, the Treasury is seen as attempting to apply unconventional pressure to lower yields and reduce mortgage interest rates. This puts the government at odds with the Federal Reserve again. HFM - US Dollar 4-Hour Chart Trump Economic Plan Keeps Oil Above $85 Trump has announced a new ‘economic warfare’ campaign against Iran, describing it as an ‘economic D-Day’ aimed at further isolating Tehran and forcing it to accept US demands. The plan will include sanctions, financial restrictions, and pressure on Iran’s oil trade. Experts advise that this will include targeting not only Iranian entities but also foreign banks, shipping companies, and countries that help Iran bypass sanctions. As a result, crude oil prices remain above $85 per barrel for a third day. US Treasury vs The Federal Reserve The Federal Reserve traditionally oversees the condition of interest rates, bond yields, and economic stability. What investors do not want to see from the US Treasury is unpredictability, yet this is what they saw. This is the first time in US history that the US government has deliberately bought long-term bonds to calm a surge in yields. The Treasury announced that it would double certain long-term Treasury bond buybacks from $2 billion to at least $4 billion per operation. The move is specifically targeting bonds with maturities between 10 and 30 years. This came after the 30-year yield surged above 5.3%, its highest level since 2007. This indicates to markets that high bond yields are worrying US economists and that the government fears yields may become ‘out of control’. A higher fiscal deficit and higher yields can trigger a global recession if the trend continues. As a result, investors sold the Dollar and opted for Gold. The move suggests traders are seeking alternative safe-haven assets to reduce exposure. Simultaneously, investors are worried that Japan will have to sell US Treasury bonds in order to fund further currency interventions. This could further increase US bond yields and create a recurring issue for the US. Higher bond yields would normally support the US Dollar. However, if yields reach levels that trigger fear over fiscal stability, investors tend to turn to alternatives. Key Correlation Returns Wednesday saw the traditional correlation between the US Dollar and Gold return after both fell on Tuesday. This was because investors were simultaneously concerned about rising inflation, bond yields, and the lack of Federal Reserve reaction. More information on this can be found here. However, with the Treasury’s historic move, investors are less concerned about inflation and more concerned about fiscal policy and government debt levels. As a result, the correlation has returned, with the US Dollar declining and Gold rising. Gold - Technique Analysis Gold’s technical picture turned sharply bullish yesterday, with XAU/USD rising more than 4% and breaking decisively through the $4,455–$4,555 resistance zone. The move created a strong bullish daily candle and confirmed a breakout from the recent consolidation. The price also pushed above the 200-day moving average, and most momentum-based indications are pointing to upward price movement. The US Dollar continues to be one of the worst-performing currencies of the day, which is positive for Gold. In addition to this, Silver is also increasing during this morning’s Asian session, indicating that demand is across multiple metals, not only Gold. If Gold prices decline below $4,471.80, buy signals will significantly weaken in the short to medium term. Remaining above this price will continue to indicate that buyers are controlling the price action. HFM - Gold 1-Hour Chart Possible targets for Gold in the short term remain the psychological price and resistance levels between $4,500 and $4,529. Key Takeaways: The US Treasury’s intervention in long-term bonds marks a major shift in government involvement in financial markets. The US Dollar has fallen sharply as concerns increase over fiscal stability and government debt. Gold gained more than 4%, breaking key resistance levels and strengthening its bullish technical outlook. Oil remains above $85 as the US prepares a new economic pressure campaign against Iran. Markets are increasingly focused on rising bond yields, fiscal risks, and growing tension between Treasury policy and the Federal Reserve. Always trade with strict risk management. Your capital is the single most important aspect of your trading business. Please note that times displayed based on local time zone and are from time of writing this report. Click HERE to access the full HFM Economic calendar. Want to learn to trade and analyse the markets? Join our webinars and get analysis and trading ideas combined with better understanding of how markets work. Click HERE to register for FREE! Click HERE to READ more Market news. Michalis Efthymiou HFMarkets Disclaimer: This material is provided as a general marketing communication for information purposes only and does not constitute an independent investment research. Nothing in this communication contains, or should be considered as containing, an investment advice or an investment recommendation or a solicitation for the purpose of buying or selling of any financial instrument. All information provided is gathered from reputable sources and any information containing an indication of past performance is not a guarantee or reliable indicator of future performance. Users acknowledge that any investment in Leveraged Products is characterized by a certain degree of uncertainty and that any investment of this nature involves a high level of risk for which the users are solely responsible and liable. We assume no liability for any loss arising from any investment made based on the information provided in this communication. This communication must not be reproduced or further distributed without our prior written permission. -
⭐ RichardGere reacted to a post in a topic:
Timingsolution & Nifty Updates - 3
-
S_S_Chatterjee_Fortune_and_Finance_an_Astro_Analysis.pdf https://mega.nz/file/CJQAwAQA#nRTP6_wjhMCvGC2HXbOfxT8LMmuywF5SmNs28xJKiMg A book on Astrology & Finance, Studies done based on individuals who were successful, rich and famous. Can be useful for someone who is good in astrology
-
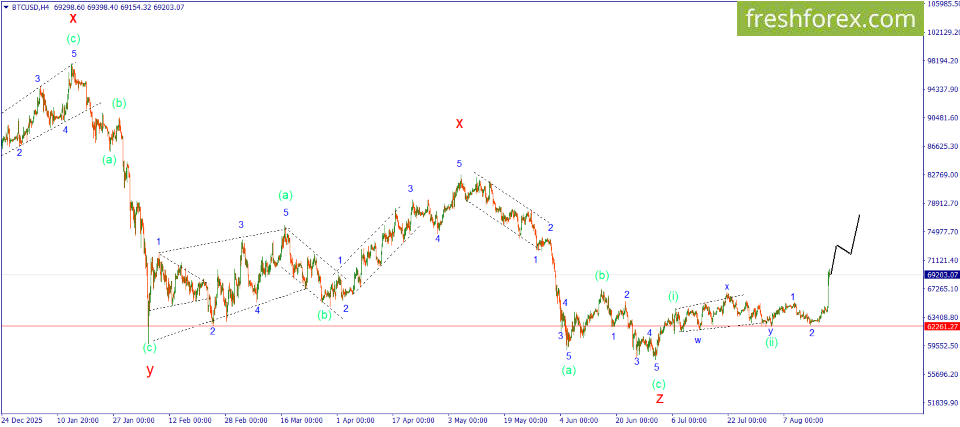
 Elliott wave analysis of the market for August 20, 2026 BTCUSD BTCUSD: BUY 70000, SL 67500, TP 75000. Bitcoin has finally produced the strong directional move that had been anticipated for quite some time. The price surged higher, exactly as expected. This move is most likely driven by the beginning of Wave 3 of (iii). The upside potential is far from exhausted. In the near term, the price is likely to continue its strong advance toward the previously established target. However, 75,000 may not be the ultimate limit. If buyers gain further momentum, Bitcoin could potentially accelerate beyond 80,000, making the current setup particularly attractive for long positions. Therefore, previously opened long positions should continue to be held. Additional positions in the same direction may also be considered. Investment idea: BUY 70000, SL 67500, TP 75000.
-
IBD HOME STUDY COURCE 9 ( I NEED FOR MY STOCK TRADING LEARNING )
-
 SHYAM joined the community
 -
 rkatl joined the community
 - Yesterday
-
Welcome to Indo-Investasi.com. Please feel free to browse around and get to know the others. If you have any questions please don't hesitate to ask.
-
 mausibausy joined the community
 -
Market Technical Analysis by RoboForex
RBFX Support replied to RBFX Support's topic in Technical Analysis
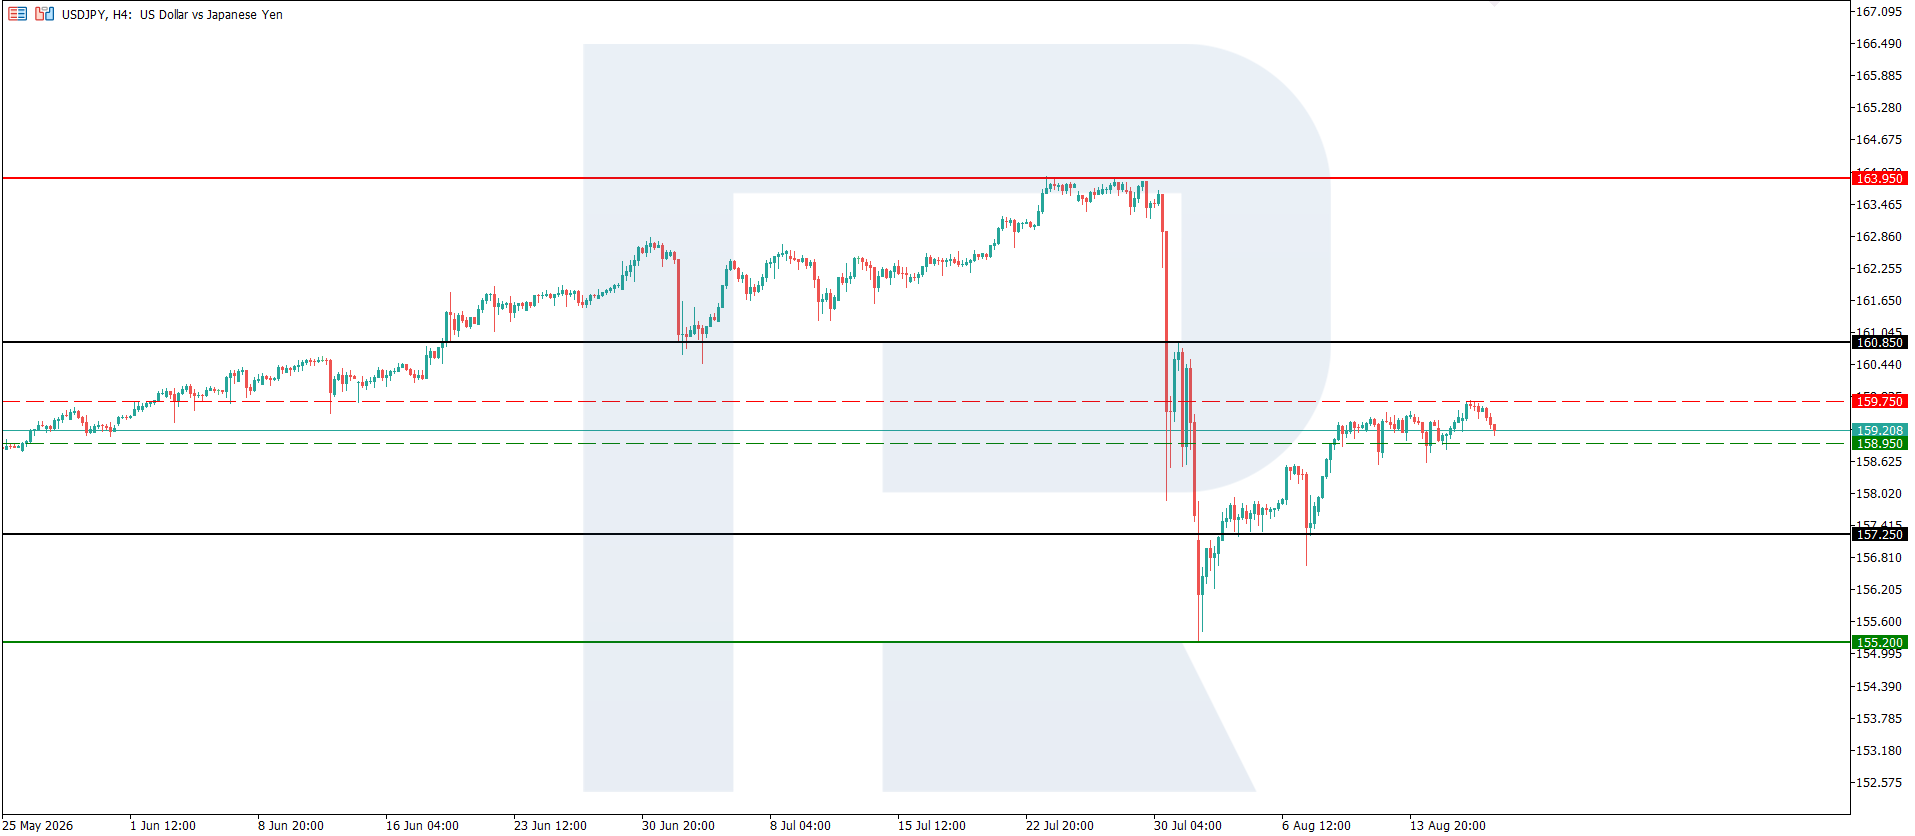
Yen strengthens: USDJPY resumes decline US retail sales data has turned the fundamental backdrop for USDJPY negative, with the rate currently at 159.20. Technical outlook On the H4 chart, the USDJPY rate has resumed its decline. The resistance level has formed at 159.75, with support at 158.95. On the D1 chart, resistance lies at 163.95, while the support level is located at 155.20. The yen continues to strengthen within the downtrend. Read more - USDJPY Forecast Attention! Forecasts presented in this section only reflect the author’s private opinion and should not be considered as guidance for trading. RoboForex bears no responsibility for trading results based on trading recommendations described in these analytical reviews. Sincerely, The RoboForex Team
-
roboforex Market Fundamental Analysis by RoboForex
RBFX Support replied to RBFX Support's topic in Fundamental Analysis
US 30 index forecast: US 30 completes correction The US 30 is completing its correction and is poised to resume its rise towards a new all-time high. A breakout below the 53,800.0 support level could push the index lower and open the way towards 52,900.0. US 30 forecast: key takeaways Recent data: US PPI remained flat in July compared to June Market impact: the current data has a moderately positive impact on the US 30 Fundamental analysis The release of the US Producer Price Index for July 2026 may have a moderately positive impact on the US 30 index and the US stock market overall, as PPI growth came in at 0.0% month-on-month versus expectations of a 0.2% increase. In June, the indicator fell by 0.1%. For the US 30, the main positive factor is a potential easing of concerns about further monetary tightening by the Federal Reserve. RoboForex Market Analysis & Forex Forecasts Attention! Forecasts presented in this section only reflect the author’s private opinion and should not be considered as guidance for trading. RoboForex bears no responsibility for trading results based on trading recommendations described in these analytical reviews. Sincerely, The RoboForex Team -
HFMarkets (hfm.com): Market analysis services.
AllForexnews replied to AllForexnews's topic in Fundamental Analysis
Date: 19th August 2026. Why Gold, Stocks and the Dollar are Declining at the Same Time. US bond yields slightly fell during the US session to the relief of most investors. However, the stock market, Gold and the US Dollar continue to decline despite the cooling yields. Gold, the US Dollar and even the equities market are normally correlated and do not usually simultaneously move lower. However, what we are witnessing is not a typical “risk-off” move. Instead, it reflects a combination of weaker US growth expectations, a bond-market selloff, and renewed inflation concerns. This is causing the US Dollar, Gold, and stocks to decline simultaneously. Behind this scenario are higher oil prices and weaker employment data, which are raising concerns that the Federal Reserve may find it increasingly difficult to bring inflation under control without putting further pressure on the economy. For this reason, investors will continue to pay close attention to the bond yields, oil prices and also the upcoming Jackson Hole Symposium. The Jackson Hole event will take place towards the end of next week. HFM - Lack of Traditional Correlation On Tuesday 18th Gold to Rebound as Yields Retrace and Dollar Continues to Fall? High bond yields do not instantly mean that Gold will decline, but if yields continue to rise in the longer-term, Gold can come under immense pressure. A good example of this was in 2021 during the COVID-19 pandemic. Bond yields rose sharply and Gold saw a quick change in trend where it fell by 15% at times. Bond yields are retracing lower due to the US pausing tariffs on Canada, a key trade partner for the US. The White House halted the duties after Canada committed to removing discriminatory measures affecting US autos, dairy, and alcohol. Canadian Prime Minister Mark Carney said the two sides have made substantial progress, although important work remains. Neither side disclosed whether earlier sticking points would be resolved. The US Dollar Index on Tuesday moved sideways and this morning is declining by more than 0.20%. Currently, the US Dollar is the worst performing currency of the day along with the Australian Dollar. However, Gold prices are yet to witness sustained bullish momentum in response. If the US Dollar continues to decline, bullish price movement for Gold will become more likely particularly if crude oil prices fall lower. Currently, crude oil is trading 0.50% higher. HFM - Gold 30-Minute Chart Gold on the 5-Minute timeframe is still trading below the 200-bar simple moving average and is currently trading at the VWAP. For this reason, the price remains neutral, but this indication may turn bullish if the price rises above $4,352.35. This is a key price for bullish price action on smaller timeframes. However, if the price falls below $4,339.00 and the US Dollar rebounds, buy signals would fully fade. S&P 500 - Meta Stocks Struggle as Various States Dispute the Company’s Ethics and Intentions The selloff seen overnight for the US equities measured 0.71%, a moderate decline, but not a unique fall to indicate a larger longer-term selloff. However, an interesting element to the decline was that the fall took place with virtually minimal retracements and attempts to rise. The decline is largely related to high bond yields, worries over inflation and also the tech sector. The largest declines are largely from technology companies such as Meta, Micron Technologies and NVIDIA. Meta stocks saw a decline of 4.45% due to its largest legal trial starting in the US. In the opening statements on Tuesday, attorneys general from four states alleged Meta engineered Facebook and Instagram to be addictive and damaging to young adults while misrepresenting their safety. This is part of a broader case brought by 29 states. Analysts advise Meta is likely to continue witnessing mounting legal cases globally. In addition to this, bans on platforms for under 16s are also likely to be introduced by more countries. A positive factor for the stock market this morning is the decline in bond yields. However, bond yields, oil prices and the US Dollar will continue to impact the S&P 500. In terms of the market’s risk appetite, the VIX is currently trading 0.35% higher. The increase is not positive for the S&P 500, however, the VIX is not high enough to point to significant downward volatility. The put-to-call ratio is at 0.74 which provides a bearish bias but is not indicating a stock market crash. HFM - S&P 500 30-Minute Chart Key Takeways: Gold, the USD and stocks are declining together, reflecting weaker growth expectations, inflation concerns and pressure from elevated bond yields. Bond yields have eased slightly, helped by the US pausing tariffs on Canada, but investors remain focused on oil prices and the upcoming Jackson Hole Symposium. Gold remains technically neutral, with $4,352.35 acting as a key bullish level. However, price action will depend on the US Dollar, bond yields but also oil prices. The S&P 500 remains under pressure, led by technology stocks. While VIX and put-to-call data point to bearish sentiment but not extreme market stress. Meta shares fell 4.45% as a major US trial began, with four states alleging that Facebook and Instagram were designed to be addictive and harmful to young users. Always trade with strict risk management. Your capital is the single most important aspect of your trading business. Please note that times displayed based on local time zone and are from time of writing this report. Click HERE to access the full HFM Economic calendar. Want to learn to trade and analyse the markets? Join our webinars and get analysis and trading ideas combined with better understanding of how markets work. Click HERE to register for FREE! Click HERE to READ more Market news. Michalis Efthymiou HFMarkets Disclaimer: This material is provided as a general marketing communication for information purposes only and does not constitute an independent investment research. Nothing in this communication contains, or should be considered as containing, an investment advice or an investment recommendation or a solicitation for the purpose of buying or selling of any financial instrument. All information provided is gathered from reputable sources and any information containing an indication of past performance is not a guarantee or reliable indicator of future performance. Users acknowledge that any investment in Leveraged Products is characterized by a certain degree of uncertainty and that any investment of this nature involves a high level of risk for which the users are solely responsible and liable. We assume no liability for any loss arising from any investment made based on the information provided in this communication. This communication must not be reproduced or further distributed without our prior written permission. -
 Sergiy23 joined the community
 -
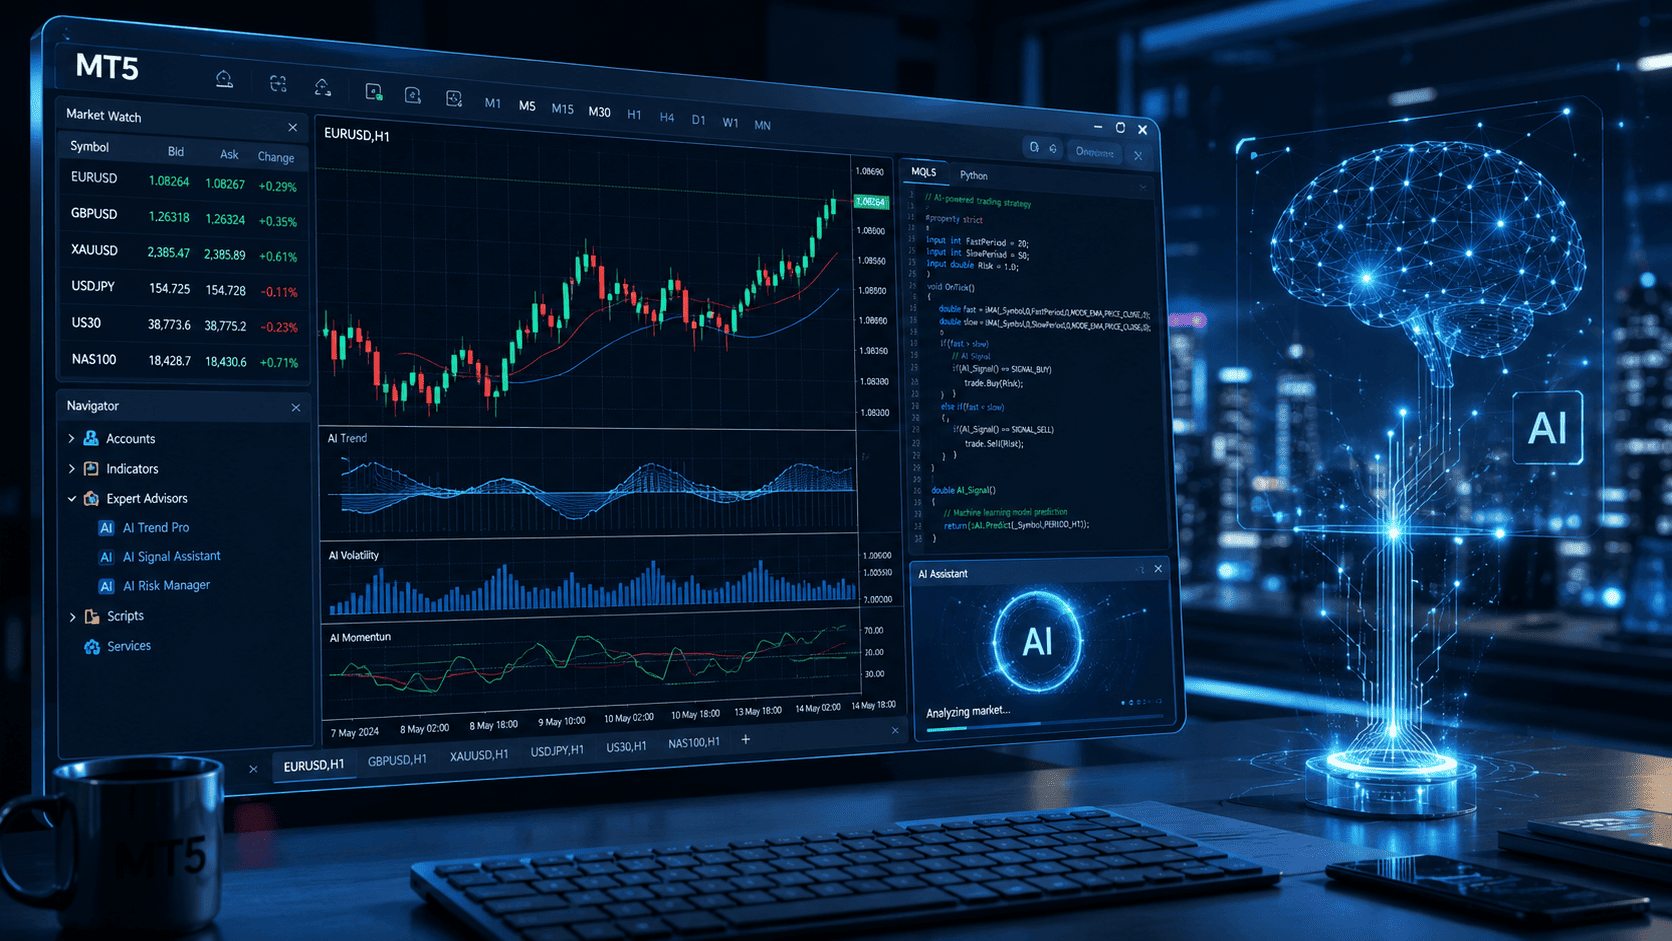
AI Has Arrived in MetaTrader 5: Trading Is Changing! MetaTrader 5 has received one of its biggest feature updates in recent years. The platform now integrates a full-fledged AI Assistant with support for the Model Context Protocol (MCP), allowing it to work directly with market data, the trading terminal, and MetaEditor. A subsequent update expanded the AI’s capabilities, enabling it to interact with chart indicators as well. Unlike a regular chatbot, the new assistant can independently break a task down into a sequence of actions and use MetaTrader 5 tools to complete it. According to MetaQuotes, in just three weeks after its launch, users processed more than 1 trillion tokens through the free MQL5 Lite model, highlighting strong interest in the new feature among traders and developers. What can AI now do in MetaTrader 5? Analyze the market. AI Assistant has access to quotes and charts and can assess the current market situation for an instrument, analyze price history, open positions, and completed trades. The assistant can identify risky positions and generate analytical reports. Work with charts. Following the Build 6090 update, AI gained the ability to add indicators directly to charts, as well as access a list of available indicators and their parameters. This makes it possible to use natural language for more advanced technical analysis. Create trading robots. In MetaEditor, the assistant can write an MQL5 program based on a text description, identify errors in existing code, make changes, compile the program, and check the result. In other words, AI can now assist not only with individual code fragments but also with entire projects. Connect external AI systems. Thanks to MCP, MetaTrader 5 can connect compatible solutions, including OpenAI Codex and Claude Code. Users can also use their own API keys for OpenAI, Anthropic, Gemini, DeepSeek, Ollama, and other providers. The developers have paid particular attention to controlling trading operations. Users can completely prohibit AI from executing such actions, allow them, or require mandatory manual confirmation. This means the final decision on a trade remains with the trader. How to use the new functionality: Use the desktop version of MT5 Build 6090 on Windows 10/11. Go to Help → About and check the build number. You need at least Build 6060, while Build 6090 or newer is recommended. The assistant is disabled on Windows 7. Log in to your MQL5.community account via Tools → Options → Community. This is a separate account and is not the same as your trading account login. Go to Tools → Options → AI Assistant. For market analysis, simply open AI Assistant in the terminal and enter a request in natural language, for example: “Analyze EURUSD on H1, identify the trend and the nearest support and resistance levels.” The assistant can also analyze open positions, trade history, and instruments available in Market Watch. Use the new MetaTrader 5 capabilities in your trading! The updated platform offers a more advanced set of tools for market analysis, algorithmic trading, and working with AI.
-
 IKERGFX joined the community
 - Last week
-
 ALMETAD joined the community
 -
Yeah, gold being fast-moving is exactly why “fast revenue” is the wrong thing to focus on. XAU can give plenty of opportunity, but bad sizing or getting caught around news can erase several good trades very quickly. The instrument isn’t really the edge, execution, reliable broker that offers it (like HFM) and risk control are
-
roboforex Market Fundamental Analysis by RoboForex
RBFX Support replied to RBFX Support's topic in Fundamental Analysis
Central banks are buying gold at a record pace: what is next for XAUUSD? Despite ongoing support, gold is forming a correction and testing the 4,390 USD level. XAUUSD forecast: key takeaways The likelihood of a Federal Reserve rate hike in September is around 35% The key upcoming event will be the release of the minutes from the July FOMC meeting on 19 August XAUUSD forecast for 18 August 2026: 4,345 and 4,480 Fundamental analysis Weak employment data, moderate inflation, and lower retail sales have prompted investors to reassess the outlook for US monetary policy. At this stage, the market estimates the probability of a Federal Reserve rate hike in September at around 35%, which continues to provide fundamental support for gold. US-Iran negotiations have effectively reached a deadlock, with Tehran announcing a shift to an offensive stance. Brent oil prices have risen to 89.00 USD per barrel, simultaneously supporting demand for safe-haven assets and increasing the risk of renewed inflationary pressure. RoboForex Market Analysis & Forex Forecasts Attention! Forecasts presented in this section only reflect the author’s private opinion and should not be considered as guidance for trading. RoboForex bears no responsibility for trading results based on trading recommendations described in these analytical reviews. Sincerely, The RoboForex Team -
Market Technical Analysis by RoboForex
RBFX Support replied to RBFX Support's topic in Technical Analysis
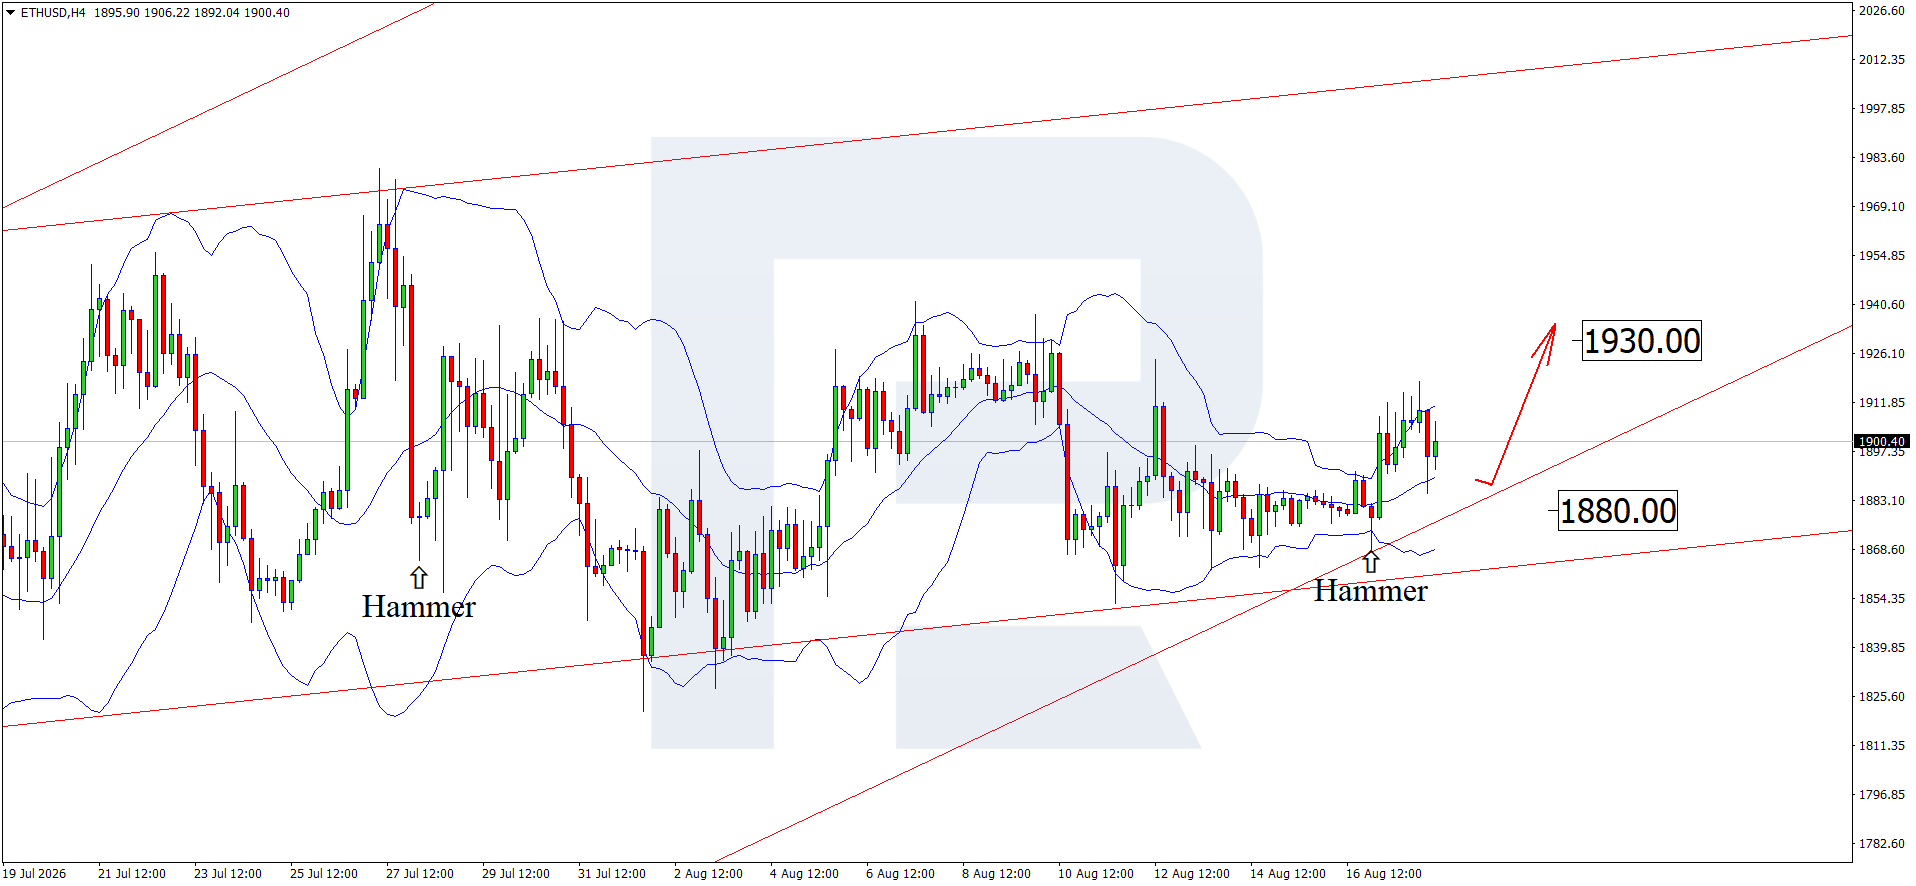
Ethereum changes the rules of the game: ETFs, staking, and stablecoins create a new growth driver A record share of Ethereum has been locked on the network, which in turn is supporting ETHUSD prices as they test the 1,900.00 level. Technical outlook On the H4 chart, the ETHUSD price formed a Hammer reversal pattern near the lower Bollinger Band. At this stage, the price may continue its upward wave as the signal plays out, with the upside target at the 1,930.00 resistance level. The Ethereum price may continue to rise amid changes in the network and expectations surrounding the Federal Reserve’s interest rate decision. Read more - ETHUSD Forecast Attention! Forecasts presented in this section only reflect the author’s private opinion and should not be considered as guidance for trading. RoboForex bears no responsibility for trading results based on trading recommendations described in these analytical reviews. Sincerely, The RoboForex Team
-
HFMarkets (hfm.com): Market analysis services.
AllForexnews replied to AllForexnews's topic in Fundamental Analysis
Date: 18th August 2026. Bond Market Fears Intensify as Risk-Off Sentiment Takes Hold. As President Trump refuses to prolong the US-Iran extension, markets turn their attention to bond yields and oil prices. Prospects for peace in the Middle East remain limited, with the White House appearing to pause temporarily to replenish resources before potentially escalating tensions again. Economists and analysts are anxious about the level of debt-to-GDP which looks to continue to grow. Country debt levels are on the rise globally as countries are spending considerably more on defence. At the same time higher inflation is eating into consumer spending. As a result, bond sales are slumping and yields are rising considerably. Bond Yields Trigger Risk-Off Sentiment Sovereign borrowing costs are rising sharply across major markets, with 30-year US Treasury yields, French government borrowing costs and German yields all climbing to elevated levels. Analysts and fund managers are increasing their exposure to short-term borrowing in order to avoid high interest rates. The increase reflects broader global pressures, including geopolitical fragmentation, concerns over government spending and long-term shifts in market structure and demographics. Higher bond yields are creating a risk-off sentiment due to investors fearing a debt-crisis and even an economic downturn. All global indices are trading lower while the VIX, Dollar and Oil prices rebound. This will be a key issue for the US government and its fiscal policy. Some US firms are increasingly tapping overseas bond markets, with one example being Alphabet Inc.’s decision to market its debut Australian dollar debt issue of $3.6 billion. Crude Oil Rises As The US Do Not Renew Its Current Ceasefire With Iran Positive dynamics are supported by a decrease in the probability of a peace agreement between the US and Iran soon. The deal announced earlier in the month by US Treasury Secretary Scott Bessent never took place and instead, the parties demanded reparation payments from each other and intensified attacks on civilian tankers. As a result, a long blockade and an expansion of the energy crisis are expected. President Trump has told his administration not to renew the ceasefire with Iran and has also warned Oman. As a result, oil prices are trading higher over the past 24 hours. Yesterday, the president said that the US still held leverage over Iran, pointing to the naval blockade of Iranian ports. He also repeated his proposal to declare the waterway US territory, arguing that Washington maintained full control over it. This morning, Crude Oil prices rose above $85 for the first time in August. If oil prices remain elevated, inflation is likely to become sticky and increase the possibility of an interest rate hike in October. As a result, the US Dollar may continue to rebound and stocks to decline. HFM - Crude Oil 30-Minute Chart NASDAQ Falls Over Key Economic and Fiscal Concerns The NASDAQ is declining this morning and looks likely to form a third day of consecutive falls. The NASDAQ is coming under pressure from bond yields and oil prices which are triggering a lower market risk appetite. The VIX Index this morning is trading 1.50% higher and the Put to Call ratio is again on the rise. This is currently verifying the risk-off sentiment. Investors fear that the cost of debt and higher debt-to-GDP adds an additional level of risk to the stock market. In addition to this, higher oil prices and lower employment data globally also points to risks from both the monetary policy and consumer demand. If oil prices remain above $85 per barrel and bond yields do not subside, the NASDAQ remains at risk of further downside. Two key support levels can be seen at $29,139 and $29,435. HFM - NASDAQ 30-Minute Chart In the short-term, the NASDAQ is trading below key Moving Averages and is forming lower lows and highs. This supports the bearish bias but the price has slightly retraced higher. For this reason, investors will be looking for the price to again decline below $29,750 in order to witness stronger sell indications from the price action and indicators. If the NASDAQ is to rebound upwards, the resistance levels can be seen at $29,852 and $30,207. Key Takeaways: US-Iran tensions remain elevated, with the US not extending the ceasefire and prospects for a near-term peace agreement appearing limited. Global bond yields are rising sharply as investors worry about growing government debt, higher defence spending, inflation and the risk of an economic slowdown. Crude oil has climbed above $85, raising concerns that inflation could remain persistent and increase the likelihood of tighter monetary policy. The NASDAQ remains under pressure as higher oil prices, rising bond yields and weaker risk appetite weigh on equities, keeping the short-term outlook bearish. Always trade with strict risk management. Your capital is the single most important aspect of your trading business. Please note that times displayed based on local time zone and are from time of writing this report. Click HERE to access the full HFM Economic calendar. Want to learn to trade and analyse the markets? Join our webinars and get analysis and trading ideas combined with better understanding of how markets work. Click HERE to register for FREE! Click HERE to READ more Market news. Michalis Efthymiou HFMarkets Disclaimer: This material is provided as a general marketing communication for information purposes only and does not constitute an independent investment research. Nothing in this communication contains, or should be considered as containing, an investment advice or an investment recommendation or a solicitation for the purpose of buying or selling of any financial instrument. All information provided is gathered from reputable sources and any information containing an indication of past performance is not a guarantee or reliable indicator of future performance. Users acknowledge that any investment in Leveraged Products is characterized by a certain degree of uncertainty and that any investment of this nature involves a high level of risk for which the users are solely responsible and liable. We assume no liability for any loss arising from any investment made based on the information provided in this communication. This communication must not be reproduced or further distributed without our prior written permission. -
English please
-
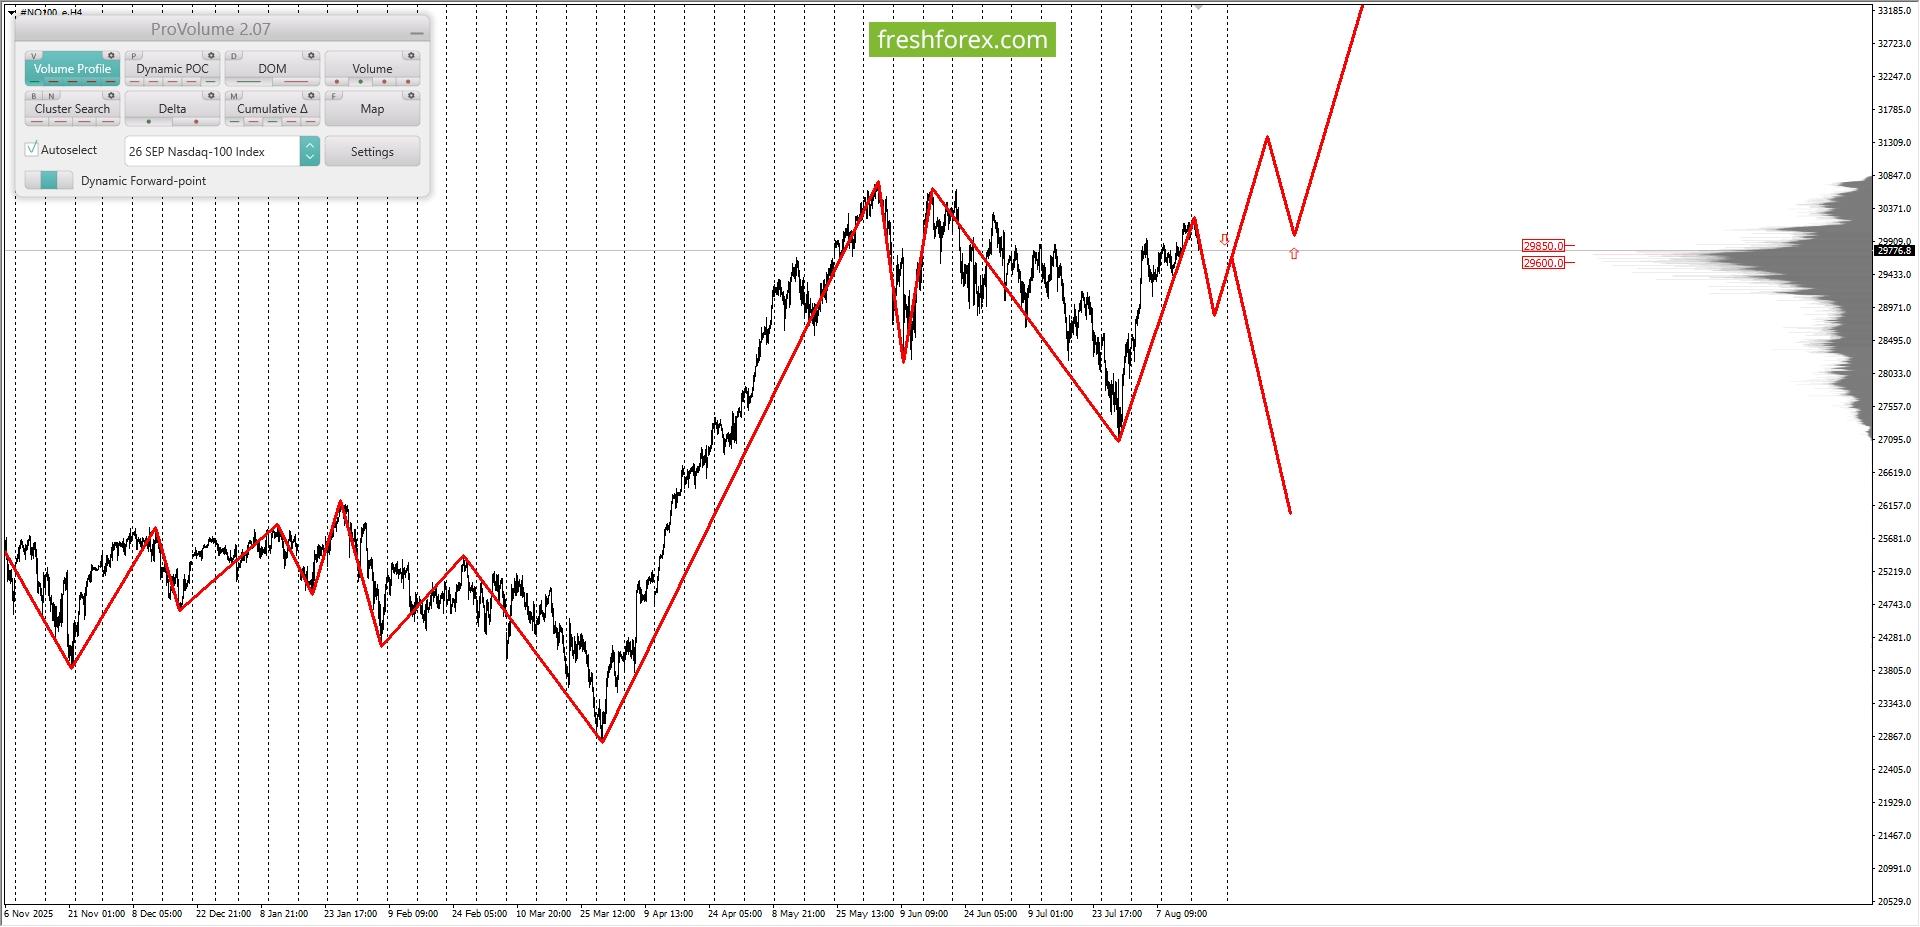
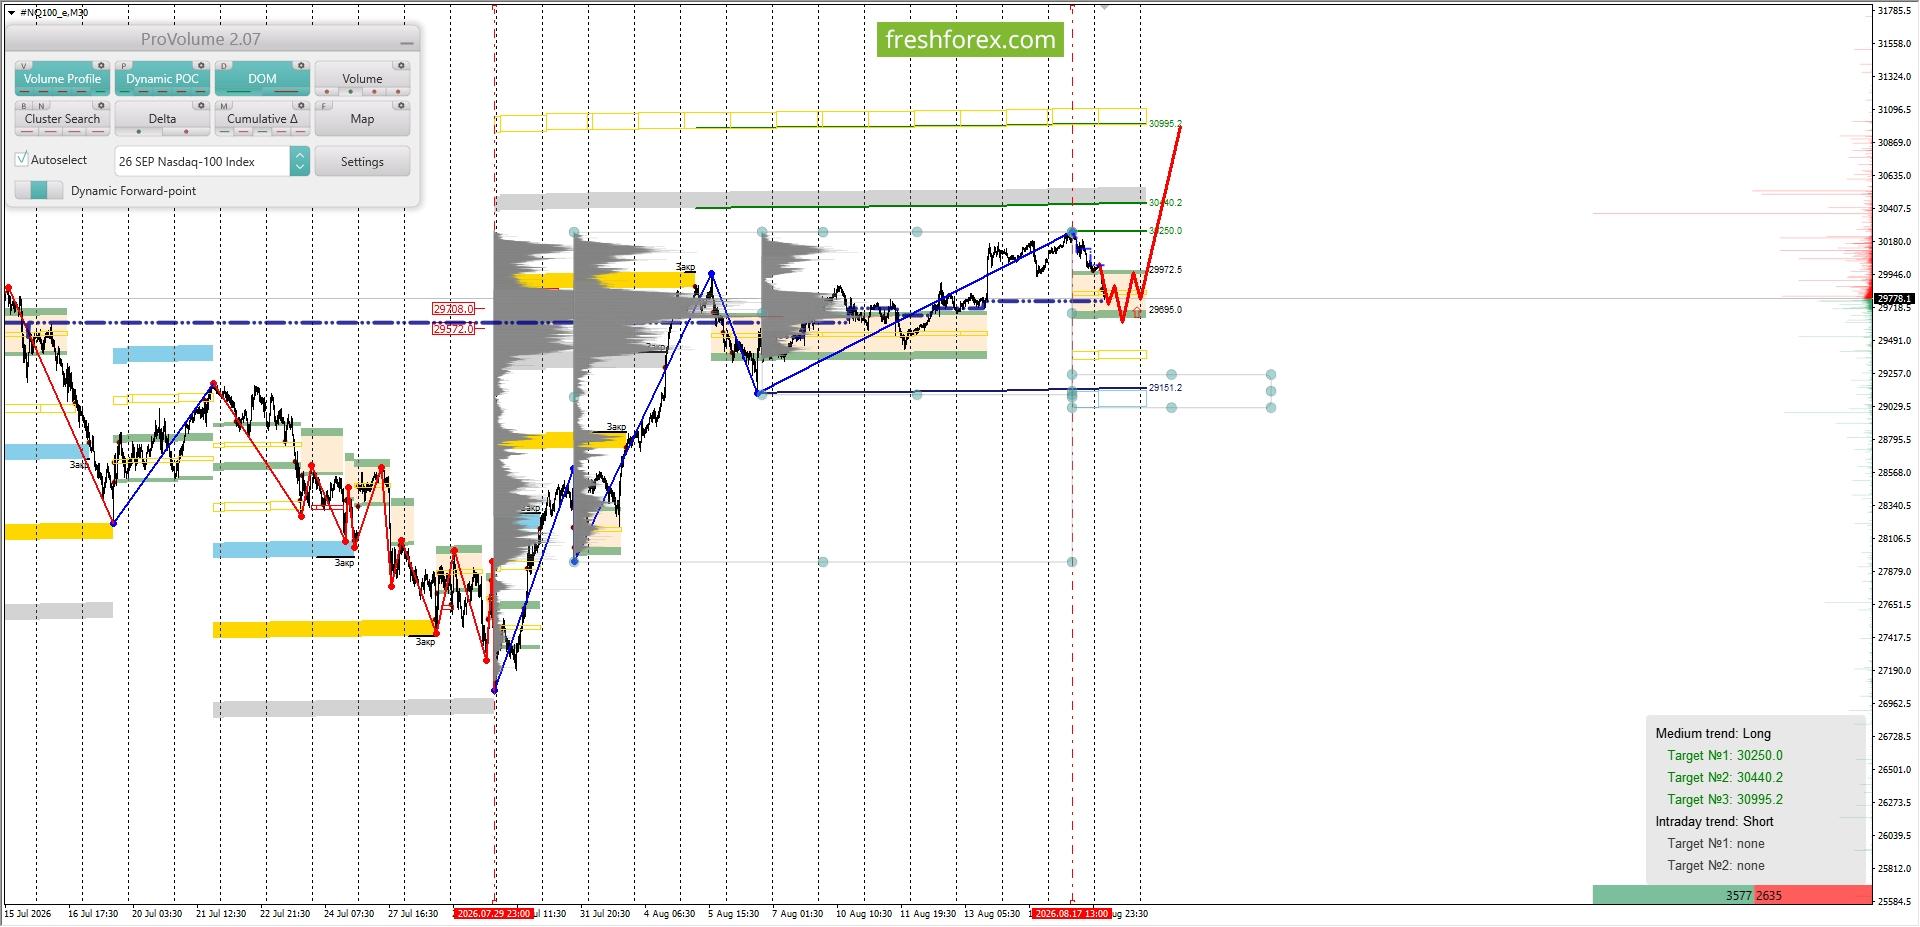
Analysis of margin levels for August 18, 2026 XAUUSD #NQ100: BUY 29695.0-29972.5, TP1-30250.0, TP2-30995.2. Exclusively for our readers — get $10 to start trading with no deposit required! Register, complete verification, and enter the promo code INDOINVEST10 in your Client Area. This is a limited offer: the bonus is available to the first 100 participants only. Long-term trend: bearish. The largest concentration of volume in the current contract is located within the 29600.0–29850.0 range. At present, trading activity in #NQ100 is taking place within this range, indicating temporary uncertainty. Medium-term trend: bullish. The largest concentration of medium-term volume is located within the 29572.0–29708.0 range. At present, trading activity in #NQ100 is taking place above this range, indicating buyer strength. From a margin requirements perspective, the favorable buying area is located between the 1/4 and 1/2 zones drawn from the high of 17.08.2026. The upper boundary of the 1/4 zone is 29972.5. The upper boundary of the 1/2 zone is 29695.0. Intraday targets: a retest of the highs from 17.08.2026 at 30250.0. Medium-term targets: a test of the lower boundary of the GWCZ at 30995.2. Investment recommendations: consider buying from the favorable price range if a reversal pattern forms. Buy: 29695.0-29972.5, Take Profit 1-30250.0, Take Profit 2-30995.2.
-
Sempre em busca de conhecimento!!