⤴️-Paid Ad- Check advertising disclaimer here. Add your banner here.🔥
All Activity
- Past hour
-

Anybody can recommend a broker for News trading??
binaryowner replied to venturefx's topic in Forex Brokers
no broker will make news trading safe by itself. I learned to treat slippage and spread widening as a normal cost, so I only trade news with smaller size and a clear max loss instead of trusting fixed spreads -
Personally, I have tried using it yesterday during NY session and it is more distracting than anything else.
- Today
-
Just trying some random strat under live data: https://ibb.co/LDZqmJYX
-

HFMarkets (hfm.com): Market analysis services.
AllForexnews replied to AllForexnews's topic in Fundamental Analysis
Date: 15th May 2026. Higher Yields, Oil Prices and Potentially Interest Rates Trigger Risk-Off Sentiment. Gold and the stock market witnessed a strong decline on Friday as investors priced in no interest rate cuts for 2026. Investors are being shaken by higher inflation figures and bond yields rising. Particularly, bond yields have risen to a 14-month high which makes the US Dollar more attractive but pressures Gold and the stock market. Interest rates and Bond Yields Trigger Unfavourable Conditions There is no new development indicating that the stock market is on the verge of witnessing a significant selloff. However, market conditions are deteriorating for Gold and the stock market making it difficult to maintain an upward trend. The main concerns for investors are interest rates, bond yields, and oil prices. US inflation has risen from 3.3% to 3.8% and core inflation rose by double the previous month. In addition to this, producer inflation rose to its highest level in four years. For this reason, investors are expecting the Federal Reserve to not cut interest rates at all in 2026. Higher interest rates alone can pressure the stock market and Gold. However, higher bond yields also add additional pressure on the two assets by increasing the value of the US Dollar. The US 10-Year Treasury yield has risen 73 basis points this morning and continues to trade above 4.5%. Trading above this level is known to pressure Gold while above 5% tends to see investors clicking the panic button. Higher Oil Prices Oil prices on Friday morning have risen by more than 2%, rising close to the key resistance level of $103.75. Prices are increasing for three reasons which are ultimately triggering a ‘risk-off’ appetite throughout the whole market. The three reasons are the Strait continuing to remain closed, Iran seizing a ship near Oman and Trump’s comments before leaving China. According to Trump, China is now willing to purchase oil from the US. China has not confirmed this. However, Trump’s statement suggests Beijing may be looking to diversify its oil supply amid rising Middle East tensions and growing risks around the Strait of Hormuz. NASDAQ Comes Under Pressure From Bond Yields The NASDAQ this morning has fallen slightly above 1%, triggering short-term sell signals but not validating a long-term trend yet. In addition to the above which continues to pressure the stock market, investors are also concerned about AI-related companies keeping the stock market afloat. HFM - NASDAQ 30-Minute Chart Nasdaq 100 futures are still trading well above the key medium-term moving averages on larger timeframes. For example, the 20-day, 50-day, 100-day, and 200-day averages are all below current price, confirming that the wider trend remains positive. In addition to this, on smaller timeframes the decline has now reached a key support level. However, short-term indicators are clearly pointing towards a decline. The VWAP is trading above the price, as are the Parabolic SARs and Moving Averages. If the price rises above $29,515.00 buy signals will again return as more than 65% of the decline would have been regained. However, if the price remains lower than this level, bearish impulse waves remain possible. Immediate resistance sits near 29,530–29,600, while support is around 29,420, followed by 29,320 if selling pressure continues. Gold Dives Due To Dollar Demand Gold remains under short-term technical pressure, despite its broader safe-haven appeal. High bond yields are resulting in investors not using Gold as their preferred safe-haven option. The latest move shows XAU/USD struggling to regain upside momentum after recent weakness, with daily technical indicators still leaning bearish and moving averages showing a ‘Strong Sell’ bias. The price is trading below the recent recovery zone, with immediate resistance around $4,637–$4,670, followed by a stronger cap near $4,708. On the downside, key support sits around $4,605, followed by $4,560 and the previous swing-low area near $4,503. A break above $4,670 could suggest buyers are trying to stabilise the market, but as long as Gold remains capped below $4,708, the short-term bias remains corrective. A move below $4,605 would increase the risk of further downside towards $4,560. Key Takeaway Points: Gold and stocks declined as investors reduced expectations for Federal Reserve rate cuts in 2026. Higher bond yields strengthened the US Dollar, adding pressure on equities and Gold. Rising oil prices increased inflation concerns and supported broader risk-off sentiment. NASDAQ and Gold remain technically weak, with short-term sell signals still active. Always trade with strict risk management. Your capital is the single most important aspect of your trading business. Please note that times displayed based on local time zone and are from time of writing this report. Click HERE to access the full HFM Economic calendar. Want to learn to trade and analyse the markets? Join our webinars and get analysis and trading ideas combined with better understanding of how markets work. Click HERE to register for FREE! Click HERE to READ more Market news. Michalis Efthymiou HFMarkets Disclaimer: This material is provided as a general marketing communication for information purposes only and does not constitute an independent investment research. Nothing in this communication contains, or should be considered as containing, an investment advice or an investment recommendation or a solicitation for the purpose of buying or selling of any financial instrument. All information provided is gathered from reputable sources and any information containing an indication of past performance is not a guarantee or reliable indicator of future performance. Users acknowledge that any investment in Leveraged Products is characterized by a certain degree of uncertainty and that any investment of this nature involves a high level of risk for which the users are solely responsible and liable. We assume no liability for any loss arising from any investment made based on the information provided in this communication. This communication must not be reproduced or further distributed without our prior written permission. -
 ⭐ Azazel reacted to a post in a topic:
Dynamic Trader Ver 8
⭐ Azazel reacted to a post in a topic:
Dynamic Trader Ver 8
-
⭐ suresh.hacker reacted to a post in a topic:
Dynamic Trader Ver 8
-
⭐ suresh.hacker reacted to a post in a topic:
Dynamic Trader Ver 8
- Yesterday
-
Try this:
-
Also, what is the price?
-
I'm new here and wanted to know how to request a nt8 indicator/strategy to be educated. Can I commision it, can we do a group commision? What is the process?
-
Lol I did ;0
-
⭐ goldeneagle1 reacted to a post in a topic:
new indi from abc123 indicators needs to crack
-
⭐ goldeneagle1 reacted to a post in a topic:
new indi from abc123 indicators needs to crack
-
i dont have
-

new indi from abc123 indicators needs to crack
Ninja_On_The_Roof replied to TRADER's topic in Ninja Trader 8
This has nothing to do with abc123. Yours is from trading123.net. The two are completely different from one another. I think, you got them confused. -
you are right, anyway MT4/MT5 has CFD data (AMP MT5 has futures data unfortunately jagged) so from my side useless....If I have to use EOD data I prefer to use only the supertrend and I don't need an additional platform (obviously my opinion)
-
⭐ suresh.hacker reacted to a post in a topic:
Dynamic Trader Ver 8
-

Dynamic Trader Ver 8
⭐ suresh.hacker replied to ⭐ suresh.hacker's topic in General Forex Discussions
Yeah.. That is correct. But we can use it for EOD or datas downloaded from MT4,MT5 & CSV.. which is best option... @iatin man.. Thank you so much for sharing the program. Do you have 8.2.1.281 which is latest one. -
⭐ suresh.hacker reacted to a post in a topic:
Dynamic Trader Ver 8
-
Plese share Multichrts 12+ with a patch. Thank you
-

roboforex Market Fundamental Analysis by RoboForex
RBFX Support replied to RBFX Support's topic in Fundamental Analysis
JP 225 forecast: the index is correcting after reaching a new all-time high The JP 225 stock index has completed its correction and is poised for a new all-time high. The JP 225 forecast for today is positive. JP 225 forecast: key takeaways Recent data: Japan’s services PMI came in at 51.0 in April Market impact: the effect on the Japanese stock market is moderately negative Fundamental analysis The S&P Global Japan services PMI reading of 51.0 is a moderately cautious signal for the JP 225 index. The figure remains above the 50.0 level, indicating continued expansion in the services sector, but the actual result was below the forecast of 51.2 and noticeably lower than the previous reading of 53.4. For the JP 225 index, the impact could be mixed, but with a moderately negative bias. On the one hand, the fact that the PMI remains above 50.0 suggests Japan’s services sector has not contracted, meaning the economy retains some resilience. RoboForex Market Analysis & Forex Forecasts Attention! Forecasts presented in this section only reflect the author’s private opinion and should not be considered as guidance for trading. RoboForex bears no responsibility for trading results based on trading recommendations described in these analytical reviews. Sincerely, The RoboForex Team -
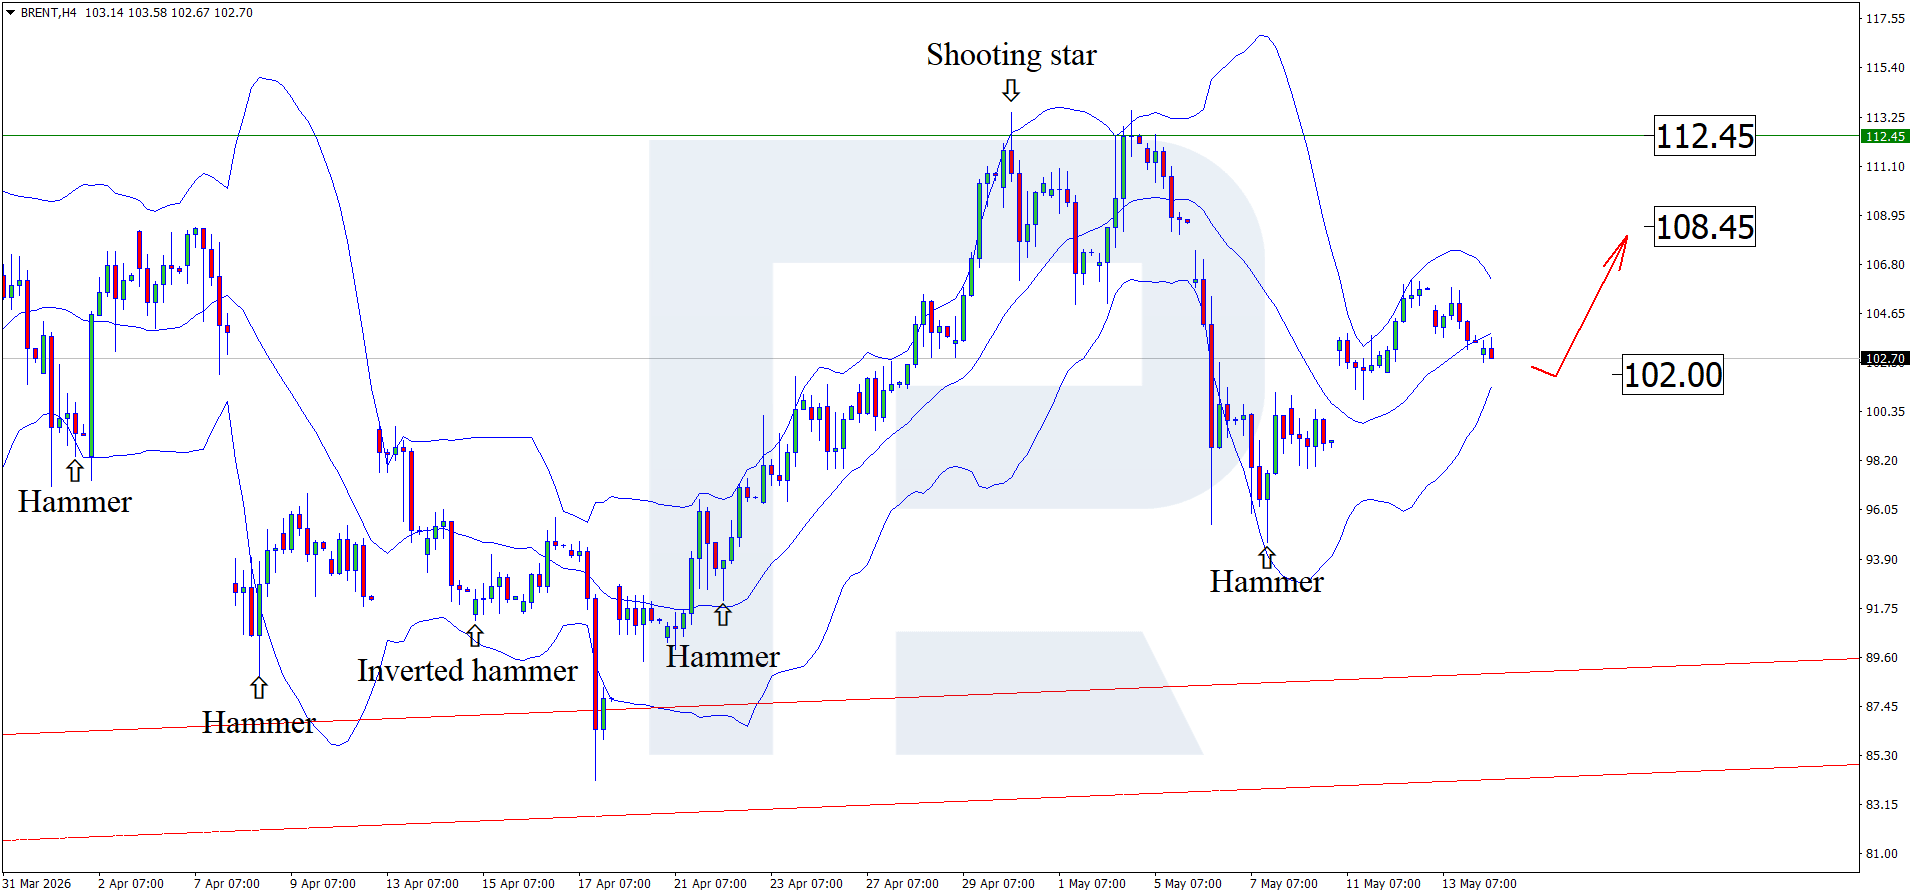
Market Technical Analysis by RoboForex
RBFX Support replied to RBFX Support's topic in Technical Analysis
Brent awaits the outcome of the Beijing summit Following a rise, Brent quotes declined to the 103.00 USD area and froze ahead of the outcome of the talks between the US President and the President of China. Find out more in our analysis for 14 May 2026. Technical outlook On the H4 chart, Brent prices formed a Hammer reversal pattern near the lower Bollinger Band. At this stage, Brent quotes may continue their upward wave following the pattern signal, with the first upside target at the 108.45 resistance level. Brent crude oil is awaiting the outcome of the Beijing talks on the Middle East conflict. Read more - Brent Forecast Attention! Forecasts presented in this section only reflect the author’s private opinion and should not be considered as guidance for trading. RoboForex bears no responsibility for trading results based on trading recommendations described in these analytical reviews. Sincerely, The RoboForex Team
-
HFMarkets (hfm.com): Market analysis services.
AllForexnews replied to AllForexnews's topic in Fundamental Analysis
Date: 14th May 2026. AI Rally Meets Inflation Fears: Key Market Moves Traders Need to Watch. Global Markets Overview Global markets entered Thursday’s trading session with investors balancing two powerful forces: unstoppable enthusiasm surrounding artificial intelligence and growing concerns that inflation may keep central banks restrictive for longer. Equity markets across Asia and the United States remained supported by the AI-driven rally that has dominated financial markets throughout 2026. However, underneath the surface, traders are increasingly cautious as rising oil prices, stronger inflation data, and geopolitical uncertainty threaten to complicate the outlook. At the centre of market attention was the highly anticipated meeting between US President Donald Trump and Chinese President Xi Jinping. While investors hoped for progress on trade and geopolitical tensions, markets largely treated the summit as a “no negative surprises” event rather than a catalyst for major breakthroughs. For traders, the session highlighted an important market theme currently shaping nearly every asset class: Risk appetite remains strong, but inflation and geopolitical risks continue to limit aggressive bullish positioning. European Session: UK GDP Strength Supports Sterling The European session was dominated by stronger-than-expected UK GDP data. The report surprised to the upside across most metrics, showing that the British economy remained resilient before the recent escalation in Middle East tensions and the ongoing US-Iran conflict. The stronger growth figures reinforced expectations that the Bank of England may need to keep monetary policy tighter for longer, especially as inflation risks remain elevated globally. Sterling initially found support following the release, although broader political uncertainty in the UK limited gains later in the session. The stronger GDP figures reinforced the view that the Bank of England may not rush towards easing, while political uncertainty continues to keep GBP volatility elevated. Looking ahead in Europe, traders are monitoring the Spanish Final CPI release, although expectations are that the data will not materially alter the European Central Bank’s policy outlook. As a result, any market reaction is likely to remain muted unless inflation surprises significantly. American Session Preview: Retail Sales and Jobless Claims in Focus The US session shifts attention towards two major economic releases: US Retail Sales US Jobless Claims Why Retail Sales Matter Retail Sales provide insight into the health of the American consumer, which remains the backbone of the US economy. Market expectations are pointing towards slower growth compared to the previous month: Retail Sales M/M expected at 0.5% vs 1.7% prior Core Retail Sales ex-Autos expected at 0.6% vs 1.9% prior Retail Control Group expected at 0.4% vs 0.7% prior Although Retail Sales is a major market-moving release, its impact is often temporary unless the numbers significantly surprise expectations. Still, the numbers could influence: US dollar direction Treasury yields Short-term Fed rate expectations Equity market sentiment A stronger-than-expected report could further reinforce the narrative that the US economy remains resilient despite elevated interest rates. That would likely support the dollar and potentially pressure risk assets if yields rise further. Jobless Claims Continue to Reflect Labour Market Strength Alongside Retail Sales, traders are closely monitoring Initial and Continuing Jobless Claims. Forecasts currently show: Initial Claims expected at 205K vs 200K prior Continuing Claims expected at 1.780M vs 1.766M prior The labour market continues to display remarkable resilience. Initial Claims remain near cycle lows, while Continuing Claims have steadily declined towards levels not seen since 2024. The combination of resilient employment conditions and sticky inflation continues to reduce pressure on the Federal Reserve to cut rates anytime soon. Inflation Fears Return to the Forefront One of the biggest themes driving markets this week has been the return of inflation concerns. Recent US CPI and PPI data both came in hotter than expected, reinforcing fears that inflation may not cool fast enough for the Federal Reserve to pivot towards aggressive easing. US producer prices posted their strongest increase since early 2022, while annual consumer inflation accelerated at its fastest pace in three years. The result has been: Rising Treasury yields Stronger US dollar demand Reduced expectations for Fed rate cuts Increasing speculation about future hikes Market pricing now reflects growing expectations that the Fed could remain restrictive well into 2027. Higher Treasury yields are becoming increasingly important for traders because they can pressure growth-focused assets while supporting defensive positioning and commodity demand. AI Mania Continues to Fuel Equity Markets Despite inflation concerns, technology stocks continue to dominate market momentum. The Nasdaq and S&P 500 both reached fresh record highs as investors maintained strong exposure to AI-related companies. Asian markets also reflected the AI boom: Japan’s Nikkei reached new all-time highs South Korea’s KOSPI remained supported by semiconductor demand AI-related companies continued to outperform broader markets One of the standout stories came from SK Hynix, which is reportedly approaching a $1 trillion market valuation after a massive rally this year. The ongoing AI frenzy has created a market environment where investors continue buying growth despite rising yields and geopolitical uncertainty. Still, the strength of the AI rally means markets could become more vulnerable to disappointment if earnings slow, economic data weakens, or geopolitical tensions intensify. Trump-Xi Summit: Stability More Important Than Breakthroughs Another major market focus was the summit between Donald Trump and Xi Jinping. Investors entered the meeting with relatively low expectations, meaning markets were primarily looking for stability rather than transformational agreements. Early headlines suggested: Trade discussions are continuing Both sides want to avoid major escalation Taiwan remains a key geopolitical risk Possible tariff adjustments may be discussed Even without major breakthroughs, markets viewed the absence of fresh escalation as supportive for risk sentiment. Meanwhile, reports suggesting that the US and China may explore limited tariff reductions on selected goods helped support sentiment towards the Chinese yuan. The yuan climbed to its strongest levels in roughly three years, while Chinese equities experienced some profit-taking after a powerful AI-driven rally in recent weeks. Technology stocks led declines in China as traders locked in gains ahead of clearer details from the summit. Market Moves Oil Prices Keep Inflation Risks Elevated Crude oil remains one of the most important variables for global markets. The ongoing conflict involving Iran and tensions surrounding the Strait of Hormuz continue to keep energy markets under pressure. Brent crude traded above $105 per barrel, while WTI crude remained above $100. Elevated energy prices continue to feed inflation concerns, increase production costs, and complicate the outlook for central banks considering future rate cuts. As long as oil prices remain elevated, inflation expectations are unlikely to decline meaningfully. This creates a difficult environment for central banks attempting to balance slowing growth with persistent price pressures. US Dollar The US dollar remained supported by: Higher Treasury yields Hawkish Fed expectations Strong labour market data Inflation concerns The Dollar Index continued to strengthen as traders reduced expectations for near-term easing. Euro: The euro weakened modestly against the dollar as markets focused on diverging monetary policy expectations between the ECB and the Fed. British Pound: Sterling initially gained after strong UK GDP data but later faced pressure from political uncertainty. Japanese Yen: The yen remained under pressure near intervention-sensitive levels around 158 against the dollar. Traders remain alert for potential intervention from Japanese authorities if volatility accelerates. Chinese Yuan: The yuan strengthened significantly, reaching multi-year highs amid optimism surrounding the Trump-Xi summit and expectations for trade stability. Central Bank Speakers Could Trigger Volatility Several central bank officials are scheduled to speak throughout the day, increasing the potential for volatility across forex and bond markets. Key speakers include: ECB President Christine Lagarde Fed’s Schmid BoE’s Pill Fed’s Hammack Fed’s Barr Fed’s Williams Given the market’s sensitivity to inflation and rate expectations, traders will closely watch for: Any shift towards a more hawkish stance Comments on inflation persistence Labour market concerns Rate path guidance Even subtle changes in tone could move currencies, yields, and equities sharply. What Traders Should Watch Next Several themes are likely to remain at the centre of market attention in the coming sessions: Inflation data and Treasury yields AI-driven momentum in equity markets Developments from the Trump-Xi summit Central bank commentary and rate expectations Oil price volatility linked to Middle East tensions Final Thoughts Financial markets are currently navigating a complex environment where optimism and caution coexist. On one side, the AI boom continues driving equity markets to record highs, supported by strong corporate earnings and resilient economic data. On the other side, rising oil prices, persistent inflation, and geopolitical uncertainty continue to threaten the outlook. For traders, this means volatility opportunities are likely to remain elevated across: Forex markets Equity indices Commodities Bond markets As the US session unfolds, Retail Sales data, Jobless Claims, and central bank commentary could become the next major catalysts shaping short-term market direction. In the current environment, staying flexible and closely monitoring macroeconomic developments remains essential. Always trade with strict risk management. Your capital is the single most important aspect of your trading business. Please note that times displayed based on local time zone and are from time of writing this report. Click HERE to access the full HFM Economic calendar. Want to learn to trade and analyse the markets? Join our webinars and get analysis and trading ideas combined with better understanding of how markets work. Click HERE to register for FREE! Click HERE to READ more Market news. Andria Pichidi HFMarkets Disclaimer: This material is provided as a general marketing communication for information purposes only and does not constitute an independent investment research. Nothing in this communication contains, or should be considered as containing, an investment advice or an investment recommendation or a solicitation for the purpose of buying or selling of any financial instrument. All information provided is gathered from reputable sources and any information containing an indication of past performance is not a guarantee or reliable indicator of future performance. Users acknowledge that any investment in Leveraged Products is characterized by a certain degree of uncertainty and that any investment of this nature involves a high level of risk for which the users are solely responsible and liable. We assume no liability for any loss arising from any investment made based on the information provided in this communication. This communication must not be reproduced or further distributed without our prior written permission. -
more info please? Thanks !
-
Yes, I agree completely; the only thing left is MS data, and I find it tricky to get that into trading software at all
-
⭐ iatin reacted to a post in a topic:
Dynamic Trader Ver 8
-
Can never find this one
- Last week
-
⭐ RichardGere reacted to a post in a topic:
neoharmonics toolkit
-
Some out there. Whether on Telegram or Discord.
-
On vacation🤪
-

new indi from abc123 indicators needs to crack
⭐ osijek1289 replied to TRADER's topic in Ninja Trader 8
Here they are: https://workupload.com/file/aB55cUv58T2 -
Is there any forum like this out there
-
Looks like educators are no longer active on this forum anymore.
-
Thanks for sharing, DT! It's a powerful tool, but I feel like it's a trap for overpriced data subscriptions? It's like buying a cheap printer and finding out the ink costs a fortune. 😁 The need for specialized and expensive data feeds like eSignal or IQFeed makes the total cost of ownership much higher than expected. I'm talking about using it in RT. As for EOD, we can use MS data.