⤴️-Paid Ad- Check advertising disclaimer here. Add your banner here.🔥
All Activity
- Past hour
- Today
-
 st4nd4rt reacted to a post in a topic:
ScalperIntel IFVG
st4nd4rt reacted to a post in a topic:
ScalperIntel IFVG
-
st4nd4rt reacted to a post in a topic:
livewireindicators.com
-
st4nd4rt reacted to a post in a topic:
tradingdj.com
-
And CONGRATS to everyone who wants to start your new journey as a serious trader! When I first began way back then, with pretty much nothing in my pocket but a tiny and thin wallet...This PDT rule was no doubt, a setback and a nasty headache... To first start out with a few bucks in hands, then also you would have to purchase this and that such as trading courses, software, indicators, strategies, bots and of course, those emptied promises and vidvid dreams of making a boat load of money from the so called trading gurus you saw on YouTube, TikTok, Discord channels, Telegram...And so you bit your tongue and joined those as well. Money, money and your money, began to dry up and by the time you actually decided to trade, you finally aint had 25K left but only a few bucks... Sounds familiar?🤪
-
stickyfingaz reacted to a post in a topic:
CopierLite_V2
-
⭐ QuBit reacted to a post in a topic:
fixed : VolumeAi
-
nice indicator, ill play with it, for one ill add alerts to drive my TV to NT webhook, and see if some automation can be derived
-
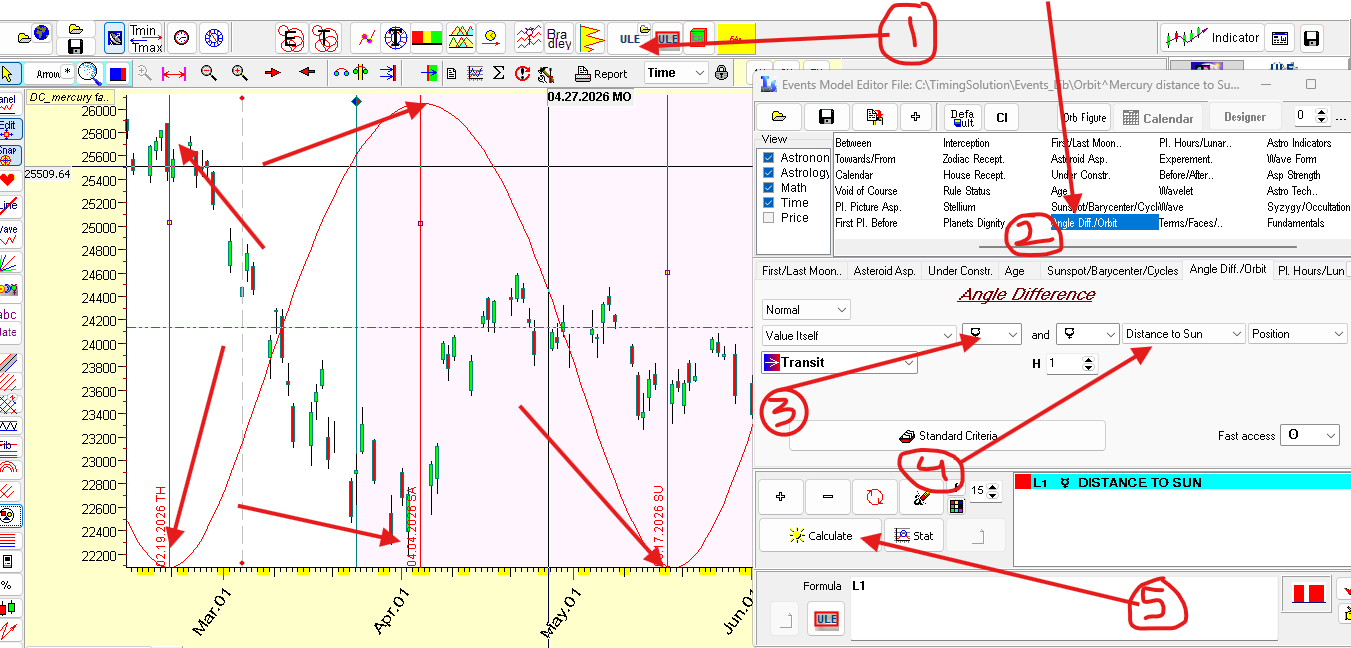
Santosh Thanks for the picture. What I have noticed in TS is that, historically its good at picking turning points/ups/downs. But on a forecasting basis, it mostly fails, this was my observation. Lost heavily based on its forecasts some years ago. Recall my posts earlier -:( Just as a validation, pickup 2 dates in the future and lets see if it works! Please understand, I am genuinely interested and not to test/poke fun !!
-
most of the time Nifty tend to change its direction when mercury reaches farthest to sun, check screenshot attached to do same in TS

-

Market Technical Analysis by RoboForex
RBFX Support replied to RBFX Support's topic in Technical Analysis
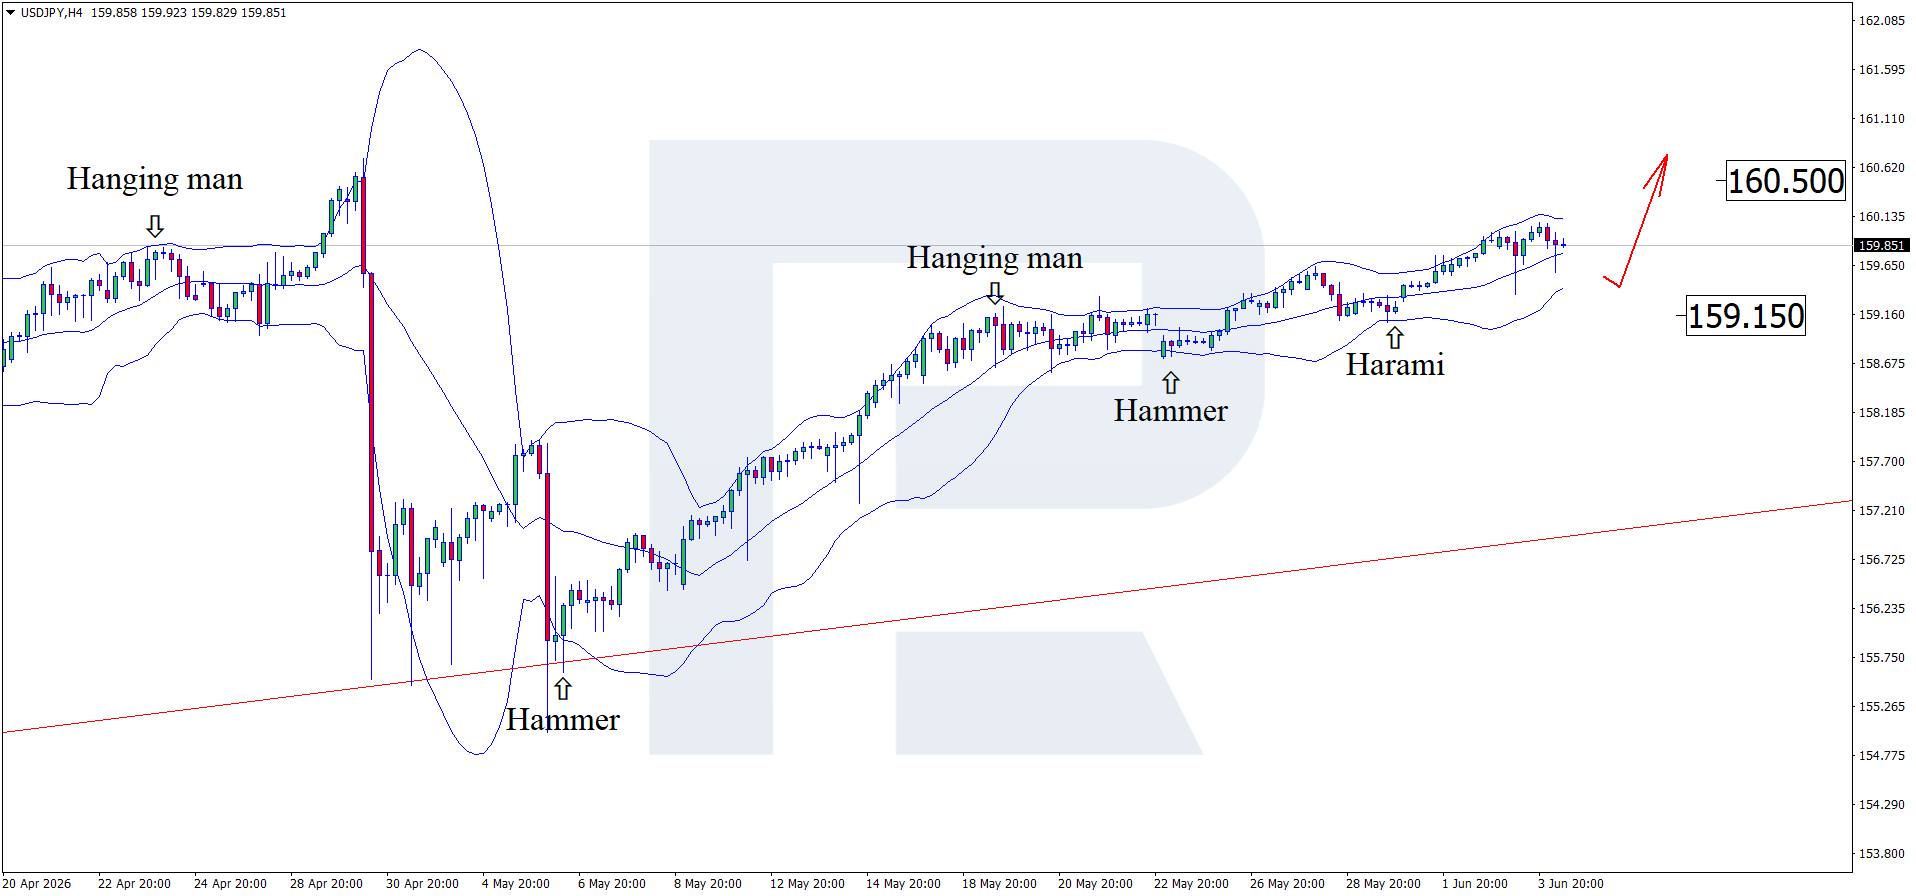
USDJPY trapped in a vice, the Japanese government is keeping a low profile After testing the psychological 160.00 level, the USDJPY pair failed to consolidate above it and pulled back. The rate currently stands at 159.85. Technical outlook On the H4 chart, the USDJPY pair formed a Harami reversal pattern near the lower Bollinger Band and is trading around 159.85. Since the price remains within an ascending channel, it could form an upward wave following the pattern signal, with the upside target remaining at 160.50. The USDJPY pair attempted to break above the psychological 160.00 level and consolidate above it, but buyers lacked the strength to do so. Read more - USDJPY Forecast Attention! Forecasts presented in this section only reflect the author’s private opinion and should not be considered as guidance for trading. RoboForex bears no responsibility for trading results based on trading recommendations described in these analytical reviews. Sincerely, The RoboForex Team
-
roboforex Market Fundamental Analysis by RoboForex
RBFX Support replied to RBFX Support's topic in Fundamental Analysis
Brent may spring an unpleasant surprise The situation in the Middle East is triggering Brent prices. After rising, quotes are forming a corrective wave and are currently hovering around 96.30 USD. Brent forecast: key takeaways US crude oil inventories fell by 8 million barrels last week Inventories at the largest terminal in Cushing declined to minimum operating levels Brent forecast for 4 June 2026: 100.50 Fundamental analysis The Brent forecast for 4 June 2026 shows that, after rising, oil prices are forming a corrective wave, primarily driven by geopolitical de-escalation, which has eased supply concerns. At this stage, Brent quotes are testing the 96.30 USD per barrel mark. A ceasefire agreement between Israel and Lebanon was announced a day earlier. This breakthrough, mediated by the US, is viewed by the market as an important step towards de-escalating the conflict in the Middle East. RoboForex Market Analysis & Forex Forecasts Attention! Forecasts presented in this section only reflect the author’s private opinion and should not be considered as guidance for trading. RoboForex bears no responsibility for trading results based on trading recommendations described in these analytical reviews. Sincerely, The RoboForex Team -

HFMarkets (hfm.com): Market analysis services.
AllForexnews replied to AllForexnews's topic in Fundamental Analysis
Date: 4th June 2026. US Dollar Surges While Broadcom Triggers a Tech Sell-Off. An interesting 24 hours for the financial markets, with strong new US economic data, a Hezbollah-Israel ceasefire, and Broadcom earnings. The US Dollar saw a significant rise on Wednesday and is now trading close to a two-month high. The latest US economic data, higher oil prices, and the lack of progress with Iran support the US Dollar. In addition to the US Dollar and oil rising, stock fell 1% as traders took a slightly more risk-off approach. This is due to weaker Broadcom earnings and interest rate expectations. Broadcom Earnings Fail to Meet Analysts’ Extreme Predictions Broadcom is the sixth most influential stock for the NASDAQ and holds a weight of almost 5%. The stock is declining more than 12%, with the price falling from $481 to $413. The reason for the decline was the latest earnings report, which was made public after the market closed. Even though the quarterly earnings report did not meet analysts’ expectations, most analysts are advising that the predictions may have been slightly overoptimistic and the official figures remain positive. Nonetheless, the stock continues to come under pressure from selling pressure as do NVIDIA, Micron Technology, and AMD stocks. Broadcom reported strong Q2 FY2026 results, with revenue up 48% YoY to $22.19 billion, adjusted EPS of $2.44, and adjusted EBITDA of $15.24 billion. The main driver was AI, with AI semiconductor revenue rising 143% YoY to $10.8 billion. For the next quarter, Broadcom guided revenue of around $29.4 billion and AI semiconductor revenue of $16.0 billion. This was the main sticking point for investors, who had been expecting greater guidance for the next quarter. NASDAQ - Broadcom’s Forward Guidance Pressures Tech Stocks The NASDAQ fell 0.80% on Wednesday, opened with a bearish gap this morning, and is falling a further 0.18% so far. The decline is largely due to the decline among semiconductor stocks, particularly Broadcom, which is witnessing extreme volatility. HFM - NASDAQ 30-Minute Chart However, the stronger US Dollar and higher oil prices are damaging demand for stocks, particularly while index trading is at an all-time high. A fear for investors is that the Strait of Hormuz remains closed for a further month. As a result, oil prices will remain higher for longer, and this is impacting interest rate expectations and can pressure GDP growth. According to the Chicago exchange, the market’s expectations for interest rate hikes in 2026 have risen over the past month from 32.9% to 46.6%. The increase in the likelihood of hawkish interest rate adjustments is pressuring demand for stocks. The VIX index, which rose 1.40% this morning, and the put-all ratio, which increased for the first time since 15 May, also point to sell signals. The put-all ratio also suggests that the stock market may be overstretched. However, the component percentage is yet to indicate a full bearish signal. 59% of the most influential stocks are decreasing in value, not enough to support a sell signal. If a further two stocks turn negative, the NASDAQ component percentage will also indicate a sell. Technical analysis, on the other hand, is providing a sell signal on smaller timeframes. The price trading below the VWAP and moving averages also shows this. The US Dollar - ADP Employment Change Exceeds Expectations The US Dollar is trading slightly lower this morning, but is considerably higher than yesterday’s open. The worst-performing currencies of the day so far are the Canadian Dollar and the Australian Dollar. The recent ADP Employment Change and ISM Services PMI were key reasons for the Dollar’s rise. April JOLTS data showed US job openings rising from 6.887 million to 7.618 million, well above forecasts of 6.860 million, signalling continued labour-market strength. Yesterday’s ADP NFP Change also came in higher than expectations, again supporting the currency further. The ADP NFP Change came in at 122,000, higher than expectations and the previous month. The ISM Services Index also read higher than expectations. Markets now await May employment data, which could increase expectations of tighter Fed policy if results are strong. The NFP change and unemployment rate will be made public tomorrow afternoon. Stronger data can again further support the Dollar. HFM - AUDUSD 30-Minute Chart Key Takeaways: The US Dollar strengthened after stronger US labour and services data reduced expectations of Fed support. The recent ADP Employment Change and ISM Services PMI was a key reason for the Dollar’s rise. Broadcom’s results were positive, but its AI guidance disappointed high investor expectations, pressuring semiconductor stocks. The NASDAQ weakened as tech stocks fell, the US Dollar rose, and oil prices increased. Markets look to May NFP and unemployment data, which could further influence Fed rate expectations. Always trade with strict risk management. Your capital is the single most important aspect of your trading business. Please note that times displayed based on local time zone and are from time of writing this report. Click HERE to access the full HFM Economic calendar. Want to learn to trade and analyse the markets? Join our webinars and get analysis and trading ideas combined with better understanding of how markets work. Click HERE to register for FREE! Click HERE to READ more Market news. Michalis Efthymiou HFMarkets Disclaimer: This material is provided as a general marketing communication for information purposes only and does not constitute an independent investment research. Nothing in this communication contains, or should be considered as containing, an investment advice or an investment recommendation or a solicitation for the purpose of buying or selling of any financial instrument. All information provided is gathered from reputable sources and any information containing an indication of past performance is not a guarantee or reliable indicator of future performance. Users acknowledge that any investment in Leveraged Products is characterized by a certain degree of uncertainty and that any investment of this nature involves a high level of risk for which the users are solely responsible and liable. We assume no liability for any loss arising from any investment made based on the information provided in this communication. This communication must not be reproduced or further distributed without our prior written permission. -
Can someone please reupload the filed, all links are dead. Thanks In Advance.
-
@Mestor Thank you very much!
-
Can someone reupload please, Thanks in advance!
- Yesterday
-
PFA. SimpleFootPrintV1.zipdpLRLWP3 NT8 5-18-2026.zip Thanks.
-
https://nexusfi.com/local_links.php?action=ratelink&catid=27&linkid=2759 https://nexusfi.com/local_links.php?action=ratelink&catid=27&linkid=2756 thanks
-
Do not open too many trades at the same time. When you overtrade, you lose focus and make mistakes. It is better to wait for one high-quality setup today. Patience pays much better than trading twenty times a day.
-

Do emotions determine profits more than analysis?
hhduy replied to Bambang Sugiarto's topic in General Forex Discussions
Analysis gives you the plan, but emotion changes it. Many people know how to read charts. However, they cannot sit still when the market moves fast. Discipline is the real key to profit. -
roboforex Market Fundamental Analysis by RoboForex
RBFX Support replied to RBFX Support's topic in Fundamental Analysis
US 30 index forecast: growth momentum has weakened, but the uptrend remains The US 30 index is trading near its all-time high, but the likelihood of a downward correction is increasing. The US 30 forecast for today is positive. US 30 forecast: key takeaways Recent data: US GDP rose by 1.6% year-over-year in Q1 2026 Market impact: the data is negative for the stock market Fundamental analysis US quarterly GDP data came in below expectations, showing actual growth of 1.6%, below the forecast of 2.0% but up from the previous 0.5%. For the US 30 index, this is a mixed signal, but in the short term, it is more likely to have a moderately negative effect. For the US 30 index, which includes major US industrial, financial, consumer, and technology companies, softer GDP could reduce appetite for more cyclical stocks. RoboForex Market Analysis & Forex Forecasts Attention! Forecasts presented in this section only reflect the author’s private opinion and should not be considered as guidance for trading. RoboForex bears no responsibility for trading results based on trading recommendations described in these analytical reviews. Sincerely, The RoboForex Team -
i believe was 55$ tier 1.. now 200$
-
How much it was before ? Someone told me that he was advertising on Eva Gray group -maybe someone using this forum will say couple of words about it .
-
HFMarkets (hfm.com): Market analysis services.
AllForexnews replied to AllForexnews's topic in Fundamental Analysis
Date: 3rd June 2026. US Dollar Surges as Employment Data Sees Rate Cut Hopes Fade. The US Dollar regains momentum due to positive employment data fading any likelihood of interest rate cuts in 2026. The US JOLTS Job Openings data made public on Tuesday afternoon read considerably higher than market expectations. As a result, the US Dollar Index was quick to increase in value, with the bullish momentum continuing during this morning’s Asian session. The Middle East tensions are also partially supporting the price of the US Dollar due to its safe-haven status. According to reports, negotiations had been put on hold by Iran due to its dissatisfaction with Israel. However, according to Axios, the negotiations are back on track after President Trump pressured Netanyahu to avoid further escalations. Nonetheless, the higher tensions are triggering higher oil prices, which again are supporting the US Dollar. JOLTS Job Openings - US Dollar Finds Further Support The US JOLTS Job Openings rose to their highest since December 2026 and came in almost 800,000 above expectations. Analysts were expecting a figure in the region of 6.70-7.60 million new job vacancies, whereas the figure came in at 7.62 million. This afternoon, the US will also release the ADP NFP Change and the ISM Services PMI. Both releases will also further impact the Federal Reserve rate expectations and therefore also the US Dollar. Currently, there is less than a 1% possibility of the Federal Reserve reducing interest rates in 2026, according to the CME. According to the CME, there is a 42% chance of no adjustments this year, a 1% chance of a small cut, and a 57% chance of a hike. The market’s hawkish expectations for monetary policy are supporting the price of the US Dollar. While inflation is rising and the employment sector remains resilient, there is little need for the Federal Reserve to consider lowering interest rates. This afternoon, the US Treasury Secretary, Scott Bessent, will also speak regarding the 2027 budget. Investors will closely monitor comments from Mr Bessent, and they could potentially impact the Dollar and US Markets. AUDUSD - Australian GDP Underperforms While the US Dollar is the best-performing currency of the day, one of the currencies coming under pressure is the Australian Dollar. The Australian Dollar had been one of the best-performing of the previous days and of the year so far. However, a string of poor economic releases is putting the currency and the Reserve Bank of Australia under pressure. For this reason, the AUDUSD is trading 0.25% lower during this morning’s Asian session. Earlier in the day, Australia released its quarterly Gross Domestic Product. The GDP figure was 0.3%, lower than the market’s expectations of 0.5%. In addition to this, last week’s inflation figures also fell from 4.6% to 4.2%, again lower than expectations and pressuring the RBA not to become overly hawkish. HFM - AUDUSD 30-Minute Chart The AUD still remains the best-performing currency of the year, but poor economic data can support a correction in favour of the USD. On the 2-hour chart, the price is trading at the 100-bar SMA and slightly below the 75-bar EMA. In addition to this, the RSI is trading at 46.20, slightly above the sell zone. On smaller timeframes, such as the 5-minute chart, the price trades below the 200-bar SMA and with clear lower lows. However, on this timeframe, the RSI is again trading above 45.00. For this reason, the AUDUSD is showing a minor bearish bias, but not yet a clear bearish signal. However, if the price falls below 0.71565, sell signals may potentially materialise. Crude Oil - Trump Rebukes Netanyahu The price of crude oil continues to increase in value as the sentiment towards de-escalation in the Middle East remains shaky. Israel carried out new strikes in southern Lebanon despite a reported US-backed de-escalation effort. Reuters reported that Israel struck south Lebanon after holding off on attacks against Beirut due to US pressure. Currently, the market is unsure whether the US is brokering a ceasefire or simply a series of actions to de-escalate. So far, Israel is holding off on attacking the Lebanese capital. Hezbollah has accepted a US proposal to stop attacks on Israel in exchange for Israel avoiding strikes on Beirut and its suburbs. Fighting, however, has continued in the south. HFM - Crude Oil 30-Minute Chart Nonetheless, the price of Crude Oil continues to rise, with charts showing clear buy signals on smaller timeframes. For example, the RSI continues to rise above 65.00, and the price trades above the VWAP. Nonetheless, $100 per barrel is a clear psychological price for traders and can act as a resistance level. Key Takeaways: JOLTS Job Openings exceeded expectations, reinforcing confidence in the US labour market and boosting the Dollar. Markets now see almost no chance of Fed rate cuts in 2026, with expectations shifting towards rates remaining unchanged or even rising. Australia's GDP growth missed forecasts, increasing pressure on the RBA and helping drive AUD/USD lower. Uncertainty around Israel-Lebanon de-escalation efforts is keeping oil prices elevated, while safe-haven demand continues to support the US Dollar. Always trade with strict risk management. Your capital is the single most important aspect of your trading business. Please note that times displayed based on local time zone and are from time of writing this report. Click HERE to access the full HFM Economic calendar. Want to learn to trade and analyse the markets? Join our webinars and get analysis and trading ideas combined with better understanding of how markets work. Click HERE to register for FREE! Click HERE to READ more Market news. Michalis Efthymiou HFMarkets Disclaimer: This material is provided as a general marketing communication for information purposes only and does not constitute an independent investment research. Nothing in this communication contains, or should be considered as containing, an investment advice or an investment recommendation or a solicitation for the purpose of buying or selling of any financial instrument. All information provided is gathered from reputable sources and any information containing an indication of past performance is not a guarantee or reliable indicator of future performance. Users acknowledge that any investment in Leveraged Products is characterized by a certain degree of uncertainty and that any investment of this nature involves a high level of risk for which the users are solely responsible and liable. We assume no liability for any loss arising from any investment made based on the information provided in this communication. This communication must not be reproduced or further distributed without our prior written permission. -
this one jsut came in. it can deliver really good stuff, but still needs improvement, so if you can bring your eyes and brain would help us all. NQ1!_2026-06-03_08-16-46.png
-
if you want to bias out holidays add this fileHolidays.txt to C:\Program Files\NinjaTrader 8\bin\ otherwise in setting uncheck CSV date filter
-
Good morning everyone, hope you guys are well. I came here to share a project of mine that was developed with AI(hermes). its a scalping indicator that provides good trades. I incorporated Volume Spread Analyzys aka VP, Gaussian moving average, Market structure Highs and Lows and one oscilattor that I will share later. the Letters are Normal buys and sells, and Big dots are big confidence Trades. This is to a point where it provides trades where all oh them are showing confluence. NOW, APART from sharing, i came here to ask for help form oyur minds, to helps further improve more this system, what can we add to make it better, adjustments, please let us know. Leaving the code here for you guys to study it. Hope you enjoy! This is for TDview, i know we supposed t only do NT8, but i figured you guys would like to be part of it. Levaing also images below.This is for the 1 minute and 30 minute time frames. GAMABOOM TDView.txt Images: ( mind the box panel, ignore it, AI is out of his mind) 3wSfgHkR2R
-
Market Technical Analysis by RoboForex
RBFX Support replied to RBFX Support's topic in Technical Analysis
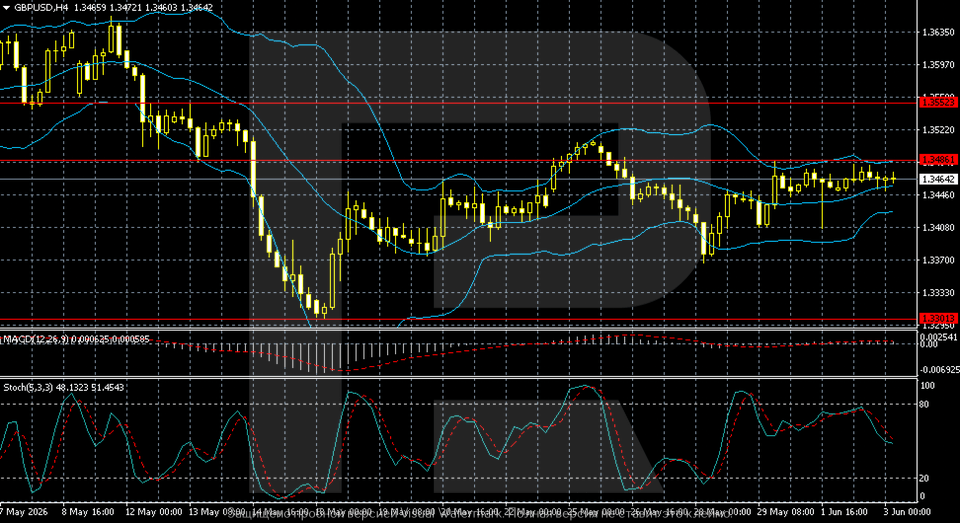
GBPUSD on hold: caught between oil rally and high interest rates The GBPUSD pair is standing in a narrow sideways range near 1.3464. The market needs strong news. Technical outlook The GBPUSD pair remains in a consolidation phase on the H4 chart after the sharp decline from May highs in the 1.3630–1.3650 area. After forming a local low near 1.3300, buyers recouped some losses, but a sustainable upward momentum has yet to emerge. The GBPUSD pair remains without a strong catalyst, but holds below crucial levels. Read more - GBPUSD Forecast Attention! Forecasts presented in this section only reflect the author’s private opinion and should not be considered as guidance for trading. RoboForex bears no responsibility for trading results based on trading recommendations described in these analytical reviews. Sincerely, The RoboForex Team
-
yes, came across.. we was charging very cheap in the beggining, now raised the prices aaaaaloooooott kkkkk
-
if anyone who has ORS_Fusion 2.7 as was posted in first post of this thread by Kimsam try this settings template I created it does even better than StratGeek. MNQ, 1 min, 5 contracts , 3/01 - 5/30 26' MNQ_5C_1Min_Tweaked.xml
-

More than 2000 usd bonus without initial deposit
binaryowner replied to maxbox's topic in Trading Contests & Bonuses
A no-deposit bonus always needs the small print checked properly. Usually the catch is in withdrawal conditions, minimum lots, profit caps, or needing a deposit later before any profit can leave the account. I’d see it more as a test account/promo than something to depend on as real capital. If we consider bonuses with relatively fair conditions, I would suggest to take a look at HFM offers for newly registered client