⤴️-Paid Ad- Check advertising disclaimer here. Add your banner here.🔥
All Activity
- Today
-
the best software for a Fibonacci traders, though its user interface is not so dynamic to switch between symbols. EoD it is best and it truly gives positional view. Use either MS or ASCII (require one time setup) and it is done. I dont know what is new in ver 8 over ver 7 that i am using currently. I create sector specific stocks in a portfolio and then like Excel tab, one has to switch between stocks. Robert miner several books and daily markets are easily searchable
-
Great job getting it to work! I tried several ways myself but had no luck. But like I said before, without a tutorial on how the addon actually functions, it’s just like throwing random numbers at it.... It’s as if someone gave me a car but I don't know how to drive; it’s no use to me, I might as well just resell it—which is probably what a lot of people do, considering all the constant requests to unprotect it."
-
 Daimon Rigor reacted to a post in a topic:
Dynamic Trader Ver 8
Daimon Rigor reacted to a post in a topic:
Dynamic Trader Ver 8
-

Dynamic Trader Ver 8
⭐ suresh.hacker replied to ⭐ suresh.hacker's topic in General Forex Discussions
You can... Just have csv file in a folder, Then go File-->Portfolio manager.. There is ASCII setup option.. Once you had setup the ASCII Setup correctly. You need to create New Portfolio.. The thing each time you need to update the portfolio symbols if you change the symbol. BR -
lalelulilo reacted to a post in a topic:
Scammer and his scam indi channel @crackATAS
-
lalelulilo reacted to a post in a topic:
VolumeAi
-
Where to put the CSV files guys, 25 year computer nerd is struggling with this software lol.. I think I found it with help of Deepseek.. there is ascii setup and portfolio setup. Still not easy
- Yesterday
-
⭐ aotegaoteg reacted to a post in a topic:
Hedge Fund Trender
-
⭐ aotegaoteg reacted to a post in a topic:
Anyone can educate with Viper Trading Indicator?
-
⭐ goldeneagle1 reacted to a post in a topic:
toptradetools.com
-
Traderbeauty reacted to a post in a topic:
toptradetools.com
-
raock95 reacted to a post in a topic:
toptradetools.com
-
Thank You so much
-

roboforex Market Fundamental Analysis by RoboForex
RBFX Support replied to RBFX Support's topic in Fundamental Analysis
US Tech forecast: the index hits a new all-time high The US Tech index has reached another all-time high, marking one of the strongest streaks of trading sessions this year. The US Tech forecast for next week is positive. US Tech forecast: key takeaways Recent data: US inflation rate rose to 3.8% year-on-year in April Market impact: the effect on the technology sector is mixed Fundamental analysis The US CPI release at 3.8% year-on-year, above the forecast of 3.7% and the previous reading of 3.3%, is a negative signal for the US Tech index. Official BLS data shows headline inflation accelerating, with core inflation excluding food and energy also up to 2.8% year-on-year from 2.6% the month before. For the US Tech, such news is typically perceived as particularly sensitive, as technology stocks rely heavily on expectations for future earnings growth. When the inflation rate comes in above forecast, investors are more likely to revise their rate and bond yield expectations. RoboForex Market Analysis & Forex Forecasts Attention! Forecasts presented in this section only reflect the author’s private opinion and should not be considered as guidance for trading. RoboForex bears no responsibility for trading results based on trading recommendations described in these analytical reviews. Sincerely, The RoboForex Team -
Grab the DLLs out of the ZIP file and place into \bin\Custom , since it contains images off the web site. https://workupload.com/file/xSBCgeFfYau
-
⭐ goldeneagle1 reacted to a post in a topic:
orderflowAi.io
-
Market Technical Analysis by RoboForex
RBFX Support replied to RBFX Support's topic in Technical Analysis
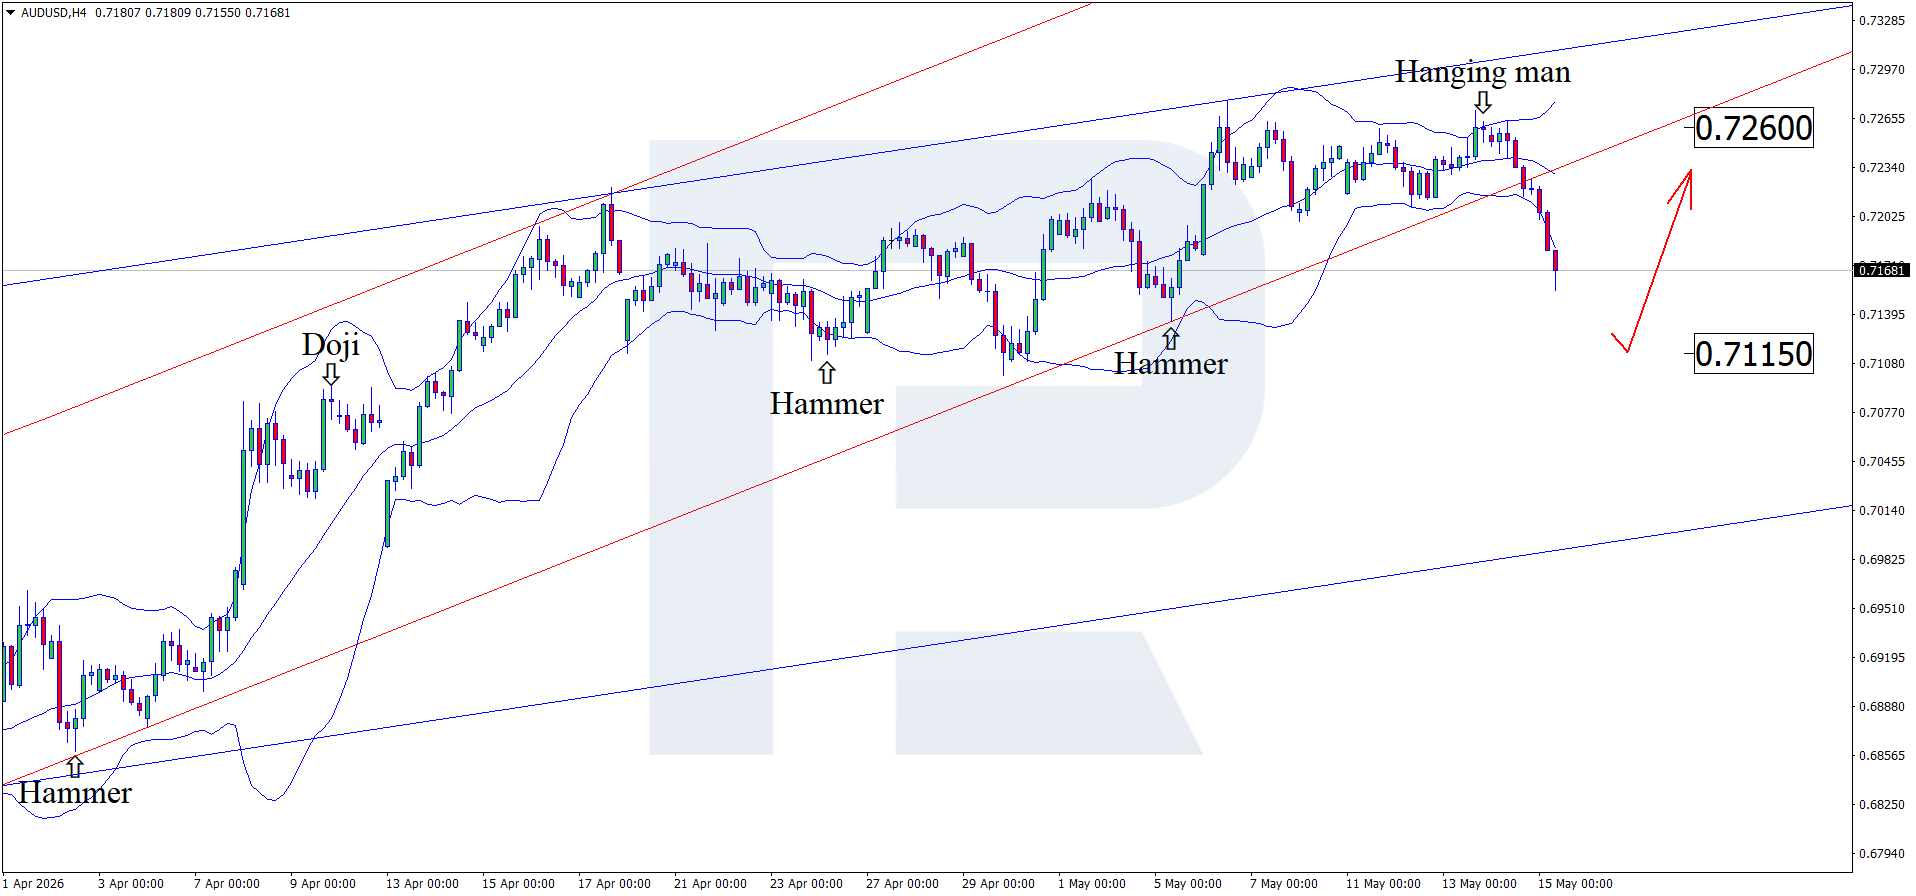
Panic in the AUDUSD market: the dollar dominates, while the Aussie holds on to hopes The Australian dollar continues to lose ground amid geopolitical conflicts and rising energy prices. At the moment, the price is testing the 0.7160 level. Find out more in our analysis for 15 May 2026. Technical outlook On the H4 chart, the AUDUSD pair formed a Hanging Man reversal pattern near the upper Bollinger Band. At this stage, quotes remain within an ascending channel and could continue the corrective wave following the signal from the pattern. Rising inflation in the US is prompting the Federal Reserve to tighten monetary policy to strengthen the USD. Read more - AUDUSD Forecast Attention! Forecasts presented in this section only reflect the author’s private opinion and should not be considered as guidance for trading. RoboForex bears no responsibility for trading results based on trading recommendations described in these analytical reviews. Sincerely, The RoboForex Team
-
@RichardGere please re up
-

Anybody can recommend a broker for News trading??
binaryowner replied to venturefx's topic in Forex Brokers
no broker will make news trading safe by itself. I learned to treat slippage and spread widening as a normal cost, so I only trade news with smaller size and a clear max loss instead of trusting fixed spreads -
Personally, I have tried using it yesterday during NY session and it is more distracting than anything else.
-
Just trying some random strat under live data: https://ibb.co/LDZqmJYX
-

HFMarkets (hfm.com): Market analysis services.
AllForexnews replied to AllForexnews's topic in Fundamental Analysis
Date: 15th May 2026. Higher Yields, Oil Prices and Potentially Interest Rates Trigger Risk-Off Sentiment. Gold and the stock market witnessed a strong decline on Friday as investors priced in no interest rate cuts for 2026. Investors are being shaken by higher inflation figures and bond yields rising. Particularly, bond yields have risen to a 14-month high which makes the US Dollar more attractive but pressures Gold and the stock market. Interest rates and Bond Yields Trigger Unfavourable Conditions There is no new development indicating that the stock market is on the verge of witnessing a significant selloff. However, market conditions are deteriorating for Gold and the stock market making it difficult to maintain an upward trend. The main concerns for investors are interest rates, bond yields, and oil prices. US inflation has risen from 3.3% to 3.8% and core inflation rose by double the previous month. In addition to this, producer inflation rose to its highest level in four years. For this reason, investors are expecting the Federal Reserve to not cut interest rates at all in 2026. Higher interest rates alone can pressure the stock market and Gold. However, higher bond yields also add additional pressure on the two assets by increasing the value of the US Dollar. The US 10-Year Treasury yield has risen 73 basis points this morning and continues to trade above 4.5%. Trading above this level is known to pressure Gold while above 5% tends to see investors clicking the panic button. Higher Oil Prices Oil prices on Friday morning have risen by more than 2%, rising close to the key resistance level of $103.75. Prices are increasing for three reasons which are ultimately triggering a ‘risk-off’ appetite throughout the whole market. The three reasons are the Strait continuing to remain closed, Iran seizing a ship near Oman and Trump’s comments before leaving China. According to Trump, China is now willing to purchase oil from the US. China has not confirmed this. However, Trump’s statement suggests Beijing may be looking to diversify its oil supply amid rising Middle East tensions and growing risks around the Strait of Hormuz. NASDAQ Comes Under Pressure From Bond Yields The NASDAQ this morning has fallen slightly above 1%, triggering short-term sell signals but not validating a long-term trend yet. In addition to the above which continues to pressure the stock market, investors are also concerned about AI-related companies keeping the stock market afloat. HFM - NASDAQ 30-Minute Chart Nasdaq 100 futures are still trading well above the key medium-term moving averages on larger timeframes. For example, the 20-day, 50-day, 100-day, and 200-day averages are all below current price, confirming that the wider trend remains positive. In addition to this, on smaller timeframes the decline has now reached a key support level. However, short-term indicators are clearly pointing towards a decline. The VWAP is trading above the price, as are the Parabolic SARs and Moving Averages. If the price rises above $29,515.00 buy signals will again return as more than 65% of the decline would have been regained. However, if the price remains lower than this level, bearish impulse waves remain possible. Immediate resistance sits near 29,530–29,600, while support is around 29,420, followed by 29,320 if selling pressure continues. Gold Dives Due To Dollar Demand Gold remains under short-term technical pressure, despite its broader safe-haven appeal. High bond yields are resulting in investors not using Gold as their preferred safe-haven option. The latest move shows XAU/USD struggling to regain upside momentum after recent weakness, with daily technical indicators still leaning bearish and moving averages showing a ‘Strong Sell’ bias. The price is trading below the recent recovery zone, with immediate resistance around $4,637–$4,670, followed by a stronger cap near $4,708. On the downside, key support sits around $4,605, followed by $4,560 and the previous swing-low area near $4,503. A break above $4,670 could suggest buyers are trying to stabilise the market, but as long as Gold remains capped below $4,708, the short-term bias remains corrective. A move below $4,605 would increase the risk of further downside towards $4,560. Key Takeaway Points: Gold and stocks declined as investors reduced expectations for Federal Reserve rate cuts in 2026. Higher bond yields strengthened the US Dollar, adding pressure on equities and Gold. Rising oil prices increased inflation concerns and supported broader risk-off sentiment. NASDAQ and Gold remain technically weak, with short-term sell signals still active. Always trade with strict risk management. Your capital is the single most important aspect of your trading business. Please note that times displayed based on local time zone and are from time of writing this report. Click HERE to access the full HFM Economic calendar. Want to learn to trade and analyse the markets? Join our webinars and get analysis and trading ideas combined with better understanding of how markets work. Click HERE to register for FREE! Click HERE to READ more Market news. Michalis Efthymiou HFMarkets Disclaimer: This material is provided as a general marketing communication for information purposes only and does not constitute an independent investment research. Nothing in this communication contains, or should be considered as containing, an investment advice or an investment recommendation or a solicitation for the purpose of buying or selling of any financial instrument. All information provided is gathered from reputable sources and any information containing an indication of past performance is not a guarantee or reliable indicator of future performance. Users acknowledge that any investment in Leveraged Products is characterized by a certain degree of uncertainty and that any investment of this nature involves a high level of risk for which the users are solely responsible and liable. We assume no liability for any loss arising from any investment made based on the information provided in this communication. This communication must not be reproduced or further distributed without our prior written permission. -
⭐ Azazel reacted to a post in a topic:
Dynamic Trader Ver 8
- Last week
-
Try this:
-
Also, what is the price?
-
I'm new here and wanted to know how to request a nt8 indicator/strategy to be educated. Can I commision it, can we do a group commision? What is the process?
-
Lol I did ;0
-
i dont have
-

new indi from abc123 indicators needs to crack
Ninja_On_The_Roof replied to TRADER's topic in Ninja Trader 8
This has nothing to do with abc123. Yours is from trading123.net. The two are completely different from one another. I think, you got them confused. -
you are right, anyway MT4/MT5 has CFD data (AMP MT5 has futures data unfortunately jagged) so from my side useless....If I have to use EOD data I prefer to use only the supertrend and I don't need an additional platform (obviously my opinion)
-
Dynamic Trader Ver 8
⭐ suresh.hacker replied to ⭐ suresh.hacker's topic in General Forex Discussions
Yeah.. That is correct. But we can use it for EOD or datas downloaded from MT4,MT5 & CSV.. which is best option... @iatin man.. Thank you so much for sharing the program. Do you have 8.2.1.281 which is latest one. -
Plese share Multichrts 12+ with a patch. Thank you
-
roboforex Market Fundamental Analysis by RoboForex
RBFX Support replied to RBFX Support's topic in Fundamental Analysis
JP 225 forecast: the index is correcting after reaching a new all-time high The JP 225 stock index has completed its correction and is poised for a new all-time high. The JP 225 forecast for today is positive. JP 225 forecast: key takeaways Recent data: Japan’s services PMI came in at 51.0 in April Market impact: the effect on the Japanese stock market is moderately negative Fundamental analysis The S&P Global Japan services PMI reading of 51.0 is a moderately cautious signal for the JP 225 index. The figure remains above the 50.0 level, indicating continued expansion in the services sector, but the actual result was below the forecast of 51.2 and noticeably lower than the previous reading of 53.4. For the JP 225 index, the impact could be mixed, but with a moderately negative bias. On the one hand, the fact that the PMI remains above 50.0 suggests Japan’s services sector has not contracted, meaning the economy retains some resilience. RoboForex Market Analysis & Forex Forecasts Attention! Forecasts presented in this section only reflect the author’s private opinion and should not be considered as guidance for trading. RoboForex bears no responsibility for trading results based on trading recommendations described in these analytical reviews. Sincerely, The RoboForex Team -
Market Technical Analysis by RoboForex
RBFX Support replied to RBFX Support's topic in Technical Analysis
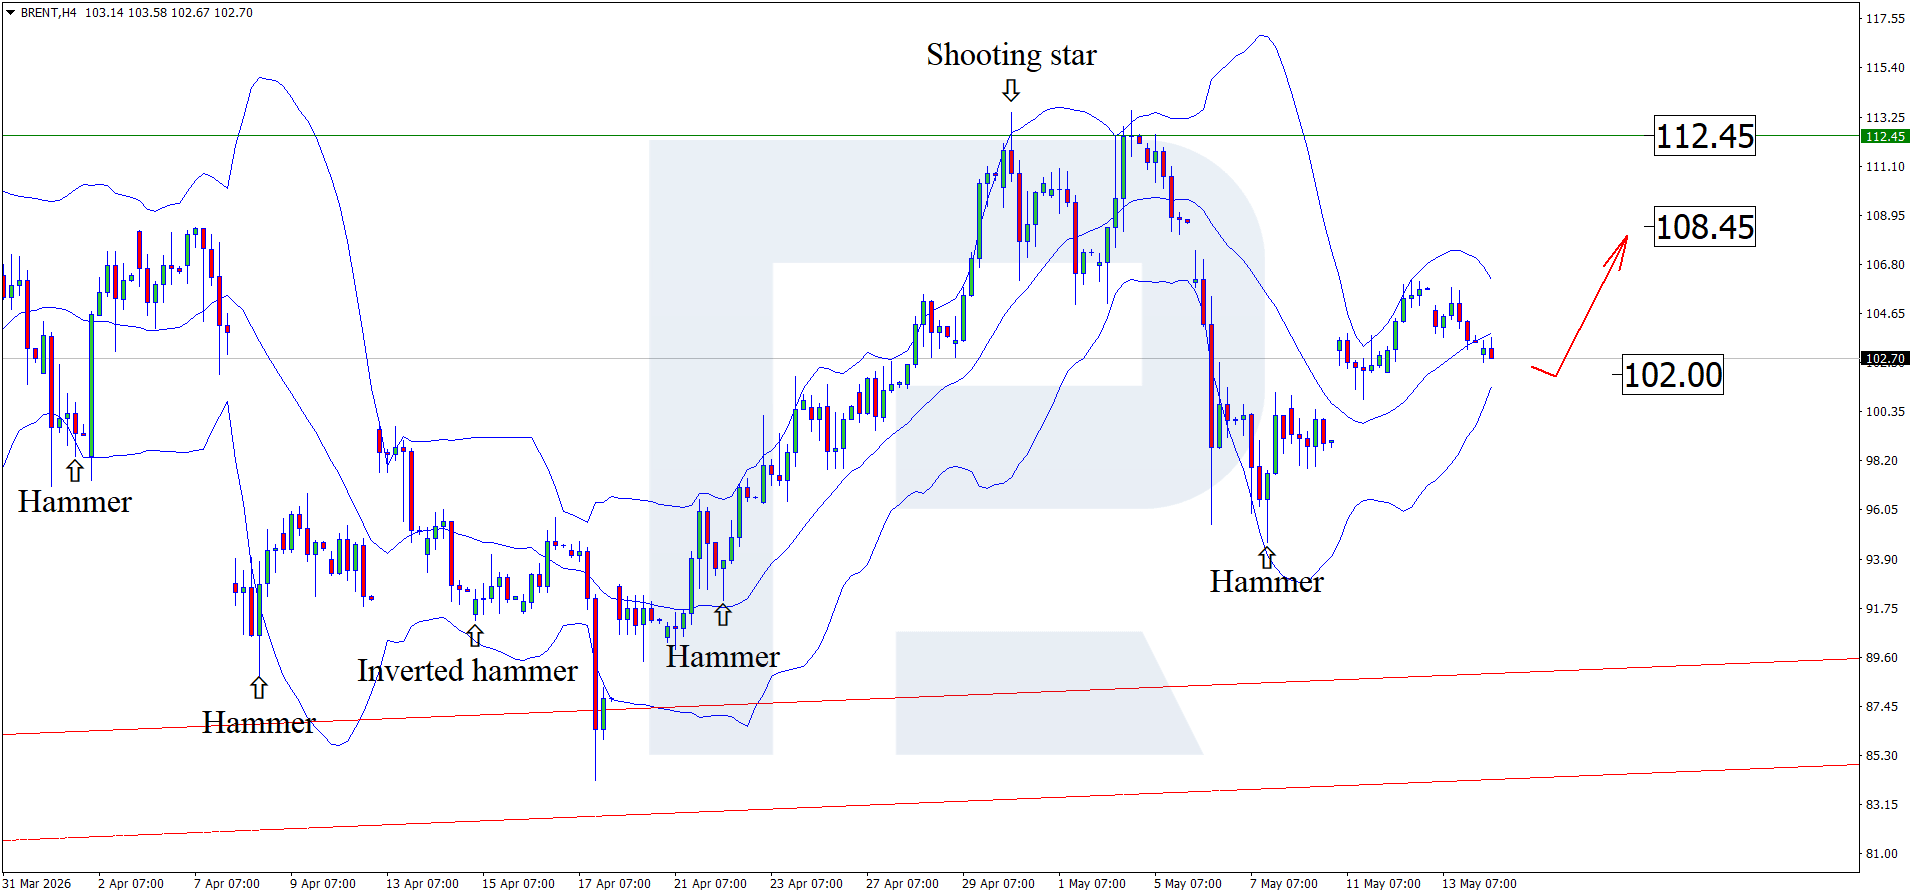
Brent awaits the outcome of the Beijing summit Following a rise, Brent quotes declined to the 103.00 USD area and froze ahead of the outcome of the talks between the US President and the President of China. Find out more in our analysis for 14 May 2026. Technical outlook On the H4 chart, Brent prices formed a Hammer reversal pattern near the lower Bollinger Band. At this stage, Brent quotes may continue their upward wave following the pattern signal, with the first upside target at the 108.45 resistance level. Brent crude oil is awaiting the outcome of the Beijing talks on the Middle East conflict. Read more - Brent Forecast Attention! Forecasts presented in this section only reflect the author’s private opinion and should not be considered as guidance for trading. RoboForex bears no responsibility for trading results based on trading recommendations described in these analytical reviews. Sincerely, The RoboForex Team