All Activity
- Past hour
-
 Dragon- reacted to a post in a topic:
All iGrid NT8 Indicators
Dragon- reacted to a post in a topic:
All iGrid NT8 Indicators
-
gfinance reacted to a post in a topic:
HFT Algo HFT SPECTRE
- Today
-
Are you using the latest version of Hawk?
-
⭐ ralph kabota reacted to a post in a topic:
HFT WarHammer Unlocked
-
⭐ osijek1289 reacted to a post in a topic:
Hawk Bot Plus ATM
-
⭐ JDizzle22 reacted to a post in a topic:
HFT WarHammer Unlocked
-
Kermit 1981 reacted to a post in a topic:
Something that works?
-
Kermit 1981 reacted to a post in a topic:
ninjacators E-mini Predictive Trader
-
Kermit 1981 reacted to a post in a topic:
ninjacators E-mini Predictive Trader
-
Wow, thank You, TickHunter.
-

roboforex Market Fundamental Analysis by RoboForex
RBFX Support replied to RBFX Support's topic in Fundamental Analysis
Gold (XAUUSD) at risk: the market does not need insurance Gold (XAUUSD) is trading around 3,218 USD on Friday. The week ends with a loss of around 3%, with the outlook remaining highly uncertain. Find out more in our analysis for 16 May 2025. XAUUSD forecast: key trading points Gold (XAUUSD) quotes are closing the week down by about 3% due to declining interest in safe-haven assets The Federal Reserve may slow the pace of rate cuts, which is negative for gold XAUUSD forecast for 16 May 2025: 3,200 and 3,119 Fundamental analysis Gold (XAUUSD) prices are hovering around 3,218 USD per troy ounce at the end of the week. The precious metal is closing this period with a roughly 3% loss. Gold has temporarily lost its appeal as a safe-haven asset due to easing global trade tensions. The US and China agreed to reduce tariffs for 90 days – a temporary measure, yet one that helped ease fears about prolonged fallout from their trade conflict. Geopolitical risks also subsided, with the truce between India and Pakistan remaining stable. Soft US inflation data typically supports gold. These figures have strengthened expectations that the Federal Reserve may cut interest rates at least twice by the end of 2025. Fed Chairman Jerome Powell previously mentioned that inflation could become more volatile in the future due to persistent supply disruptions. This scenario may complicate efforts by global central banks to maintain price stability. RoboForex Market Analysis & Forex Forecasts Attention! Forecasts presented in this section only reflect the author’s private opinion and should not be considered as guidance for trading. RoboForex bears no responsibility for trading results based on trading recommendations described in these analytical reviews. Sincerely, The RoboForex Team -
Market Technical Analysis by RoboForex
RBFX Support replied to RBFX Support's topic in Technical Analysis
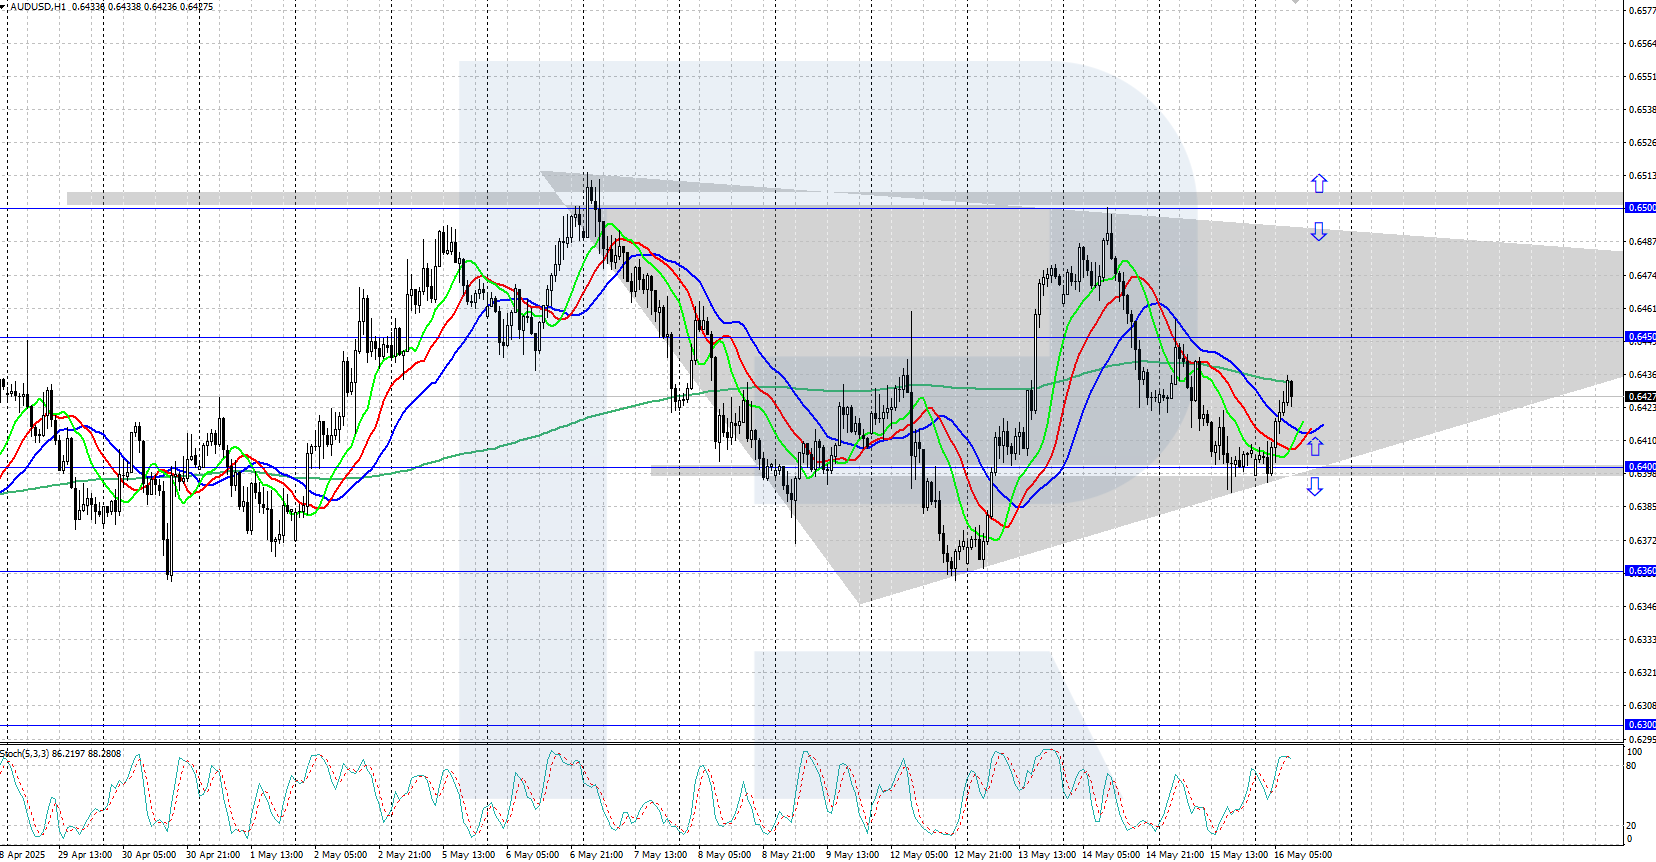
AUDUSD reversed upwards – is the correction over? The AUDUSD rate reversed to the upside, rising to 0.6450 amid weaker-than-expected US inflation. Discover more in our analysis for 16 May 2025. AUDUSD technical analysis The AUDUSD pair has reversed upwards on the H4 chart after rebounding from the 0.6400 support level. The Alligator indicator is also attempting to turn upwards, suggesting the downward correction may be ending. A Triangle pattern could form, with the potential for further growth towards the 0.6600 area. The AUDUSD rate reversed to the upside, rising to the 0.6450 area as US inflation cooled. Read more - AUDUSD Forecast Attention! Forecasts presented in this section only reflect the author’s private opinion and should not be considered as guidance for trading. RoboForex bears no responsibility for trading results based on trading recommendations described in these analytical reviews. Sincerely, The RoboForex Team
-
Kermit 1981 reacted to a post in a topic:
HFT WarHammer Unlocked
-
Would I run this on a live account? Hell No. Would I run this on an eval account, probably not. This is just fun for me, it's always good to check out what other traders are using for their 'edge', maybe learn something new. I trade manually. But here are my settings, kind of work for me, could be a disaster for you! Bot settings: Trading time: 01:00 - 22:00 (I'm in the UK) Max profit - Max loss: 5000 and -5000 All other settings are default. ATM settings: 4 contracts - 80tick SL but with 2x with 20tick PT, 1x 30tick PT and then a runner, with a 40tick trailing SL.
-
I think nothing works without an ID....In the attached video, it explains how to get it.
-
even forex brokers are going into crypto lmfx just launched their own crypto exchange with their own toke, with utilization. its called lmgx. im excited to see its future, sto is set to 2027
-

HFMarkets (hfm.com): Market analysis services.
AllForexnews replied to AllForexnews's topic in Fundamental Analysis
[b]Date: 16th May 2025.[/b] [b]NASDAQ - Producer Inflation Down But Fed Will Not Budge![/b] The NASDAQ increased in value for a third consecutive day and has now fully recovered all previous losses in 2025. The NASDAQ is now trading 1.70% higher in 2025 and is in the positive zone for the first time since February 27th. The upward price movement continues due to investor confidence rising, particularly after yesterday’s lower producer inflation. NASDAQ - US Inflation and Economic Data The NASDAQ during the Asian and European sessions fell lower, witnessing only the second dip of the week. However, the price action quickly changed after the US released its producer inflation and retail sales. The positive developments from the US-China trade negotiations will now start to fade, meaning investors will need further price drivers. As the price fell during the first two sessions of the day, this price driver can be derived from the latest US data. The US producer inflation (Producer Price Index) read 0.5%, which is 0.7% lower than the previous expectations. The Core Producer Price Index read 0.4%, again significantly lower than what the market was expecting. As a result, the producer inflation over a period of 12 months fell from 2.7% to 2.4%. The lower inflation figures continue to support the stock market as it is known to boost consumer demand while pressuring the Federal Reserve to lower interest rates. The inflation data from Tuesday (consumer inflation) and yesterday (producer inflation) was one of the main price drivers. However, the NASDAQ also reacted positively to the Retail Sales, which rose above expectations. The weekly US unemployment claims came in at 1.881 million, lower than expected. However, a negative development came from Applied Materials’ quarterly earnings report, which was that the company’s revenue failed to meet expectations. As a result, the stock fell 5.50% after the market close. Applied Material is the 26th most influential company within the NASDAQ, holding a weight of 0.89%. Even though the NASDAQ managed to increase after the inflation announcement, investors were concerned that only 51% of the most influential stocks rose in value. The upward price movement was largely due to the strong performance by Cisco Systems (+4.85%), Netflix (+2.34%) and PepsiCo (+2.37). NASDAQ Companies Performance The NASDAQ - The Federal Reserve One of the main risks for the NASDAQ is connected to the trade policy with Europe, which remains one of the only trade partners to not sign a trade policy. In addition to this, a possible external risk remains the Federal Reserve, which is yet to indicate any concrete rate cuts. The Federal Reserve Chairman Jerome Powell highlighted the agency’s cautious stance. He stated that borrowing costs are likely to remain elevated over the long term due to structural economic shifts and ongoing uncertainty in government policy. We can see here that the Federal Reserve is reluctant to give an indication of any rate cuts despite the lower inflation figures. However, the next inflation announcement in June will be the first release after the US tariffs on China and Europe. This is likely to be the most important inflation reading of 2025. Currently, based on the Chicago Exchange, there is an 8% chance of a rate cut in June, a 38% chance in July and a 75% chance in September. The report indicates that by the end of 2025, the most likely scenario is the Fed lowering rates to 3.75%–4.00%. NASDAQ - Technical Analysis For the NASDAQ, technical analysis indicates a neutral signal for the short-term with a bullish bias in the long-term. In the short term, the price is forming a symmetrical price pattern, which indicates range-bound trading conditions. The price is also at a key psychological level as the index rises to the previous highs. Due to this, investors are now contemplating what the asset’s intrinsic value is. However, in the long term the price is obtaining bullish signals as the price trades above the trend-lines, moving averages and above the 50.00 level on the RSI. NASDAQ 15-Minute Chart Key Takeaway Points: The NASDAQ has risen for three straight days, now up 1.70% YTD and in positive territory for the first time since February. Lower-than-expected producer and consumer inflation boosted investor sentiment, reinforcing hopes for rate cuts and supporting retail sales growth. Despite index gains, only 51% of the top NASDAQ stocks rose. Applied Materials missed earnings, dropping 5.5%, while Cisco, Netflix, and PepsiCo outperformed. Powell signalled no immediate rate cuts despite cooling inflation. Markets expect a 75% chance of a cut by September, with rates likely to fall to 3.75%–4.00% by year-end. [b]Always trade with strict risk management. Your capital is the single most important aspect of your trading business.[/b] [b]Please note that times displayed based on local time zone and are from time of writing this report.[/b] Click [url=https://www.hfm.com/hf/en/trading-tools/economic-calendar.html][b]HERE[/b][/url] to access the full HFM Economic calendar. Want to learn to trade and analyse the markets? Join our webinars and get analysis and trading ideas combined with better understanding of how markets work. Click [url=https://www.hfm.com/en/trading-tools/trading-webinars.html][b]HERE[/b][/url] to register for FREE! [url=https://analysis.hfm.com/][b]Click HERE to READ more Market news.[/b][/url] [b]Michalis Efthymiou HFMarkets[/b] [b]Disclaimer:[/b] This material is provided as a general marketing communication for information purposes only and does not constitute an independent investment research. Nothing in this communication contains, or should be considered as containing, an investment advice or an investment recommendation or a solicitation for the purpose of buying or selling of any financial instrument. All information provided is gathered from reputable sources and any information containing an indication of past performance is not a guarantee or reliable indicator of future performance. Users acknowledge that any investment in Leveraged Products is characterized by a certain degree of uncertainty and that any investment of this nature involves a high level of risk for which the users are solely responsible and liable. We assume no liability for any loss arising from any investment made based on the information provided in this communication. This communication must not be reproduced or further distributed without our prior written permission. -
This is for RedFolder News Strategy, basically is 1 leader account brings 2 followers account as one group for long and the second group vice versa for short. you can see the below video, this is yesterday i tested on CPI news
-
Are there any similar utility for other software or app like Tradingview ? Look forward for this Ninja also
-
⭐ laser1000it reacted to a post in a topic:
Something that works?
-
yes please @ apmoo
-
This trade copier been tested and work perfectly with RedFolder Strategy But needs to remove Trial @apmoo @kimsam Stc1.zip
-
Ninjatools got it , they have all the assorted plug ons. I once I bought one from them before. Binance NinjaTools Addon
-
From my experience, being regulated is not just about legal paperwork. It usually means the broker follows certain standards like segregated accounts, regular audits, and clear dispute procedures. I’ve seen unregulated brokers freeze accounts or delay withdrawals without explanation. If you're serious about trading long term, going with a regulated broker is just the minimum. You still have to evaluate fees, trading conditions, and how they treat their clients.
-
Thank you for sharing your experience @Ninja_On_The_Roof While those are basic, drawing a 'right' trendline is difficult. Otherwise, you would not spend much time on other indicators and would return to this strategy. However, the issue with this approach is that you have to be in front of your computer, which most people cannot do since most of us are trying to trade to generate side income.
- Yesterday
-
Just from my own journey in trading and personal experience throughout the years. As many of you, I have bought countless of indicators and systems. I have tried countless of strategies and bots. I have spent thousands and thousands of dollars attending to trading classes and courses. I have had personal trading coaches and so called "gurus". I have watched millions of anything related to trading on YouTube. I have read countless of articles related to trading...all over the place. Besides the money I have spent, the amount of precious times I have wasted, also the stress and the sheer pain of feeling defeated. At some points in time, I even told myself, maybe this trading thing ain't for me. I wasn't cut out for it. Yet, in the end. Without giving up. I have found myself going back to the most basic thing of all and it certainly costs me nothing in return. Support and Resistance, Supply and Demand and a simple Trendline and with just 1 simple strategy that I still, have been using every single day trading 5 to 10 contracts on ES. The infamous ORB, open range breakout, on a 15 minute time frame. Back then of course, I would have to draw vertical and horizon lines on my chart to map out the range. Now a day, everything gets so easy and convenient. We have plenty of free indicators out there that would draw the range out for us. Plus, we can also put in the time range we need the ORB to start and end. I humbly suggest you to take 1 step back and just to make life and trading as simple as much as possible. Nothing beats the leading indicators. Everything else, shall lag.
-
Just ignore it. Don't put anything in the ID part.
-
Forget about printing money - do any of these indicators generate at least $10 /month for a year or two?
-
Most of these bots dont even work thats why people sell them for 5 grand. I genuinly dont think there is such thing as a bot that u can just run 24/7 and print money lol
-
I've been testing the indicators shared in this forum to see if they consistently perform well over time. Despite spending significant time on them, I haven't had success. Has anyone else had better results? Thank you for sharing your thoughts.
-
Hi guys please what's the last working version of motive wave
-
It’s just a link to the website - I don’t have the file
-
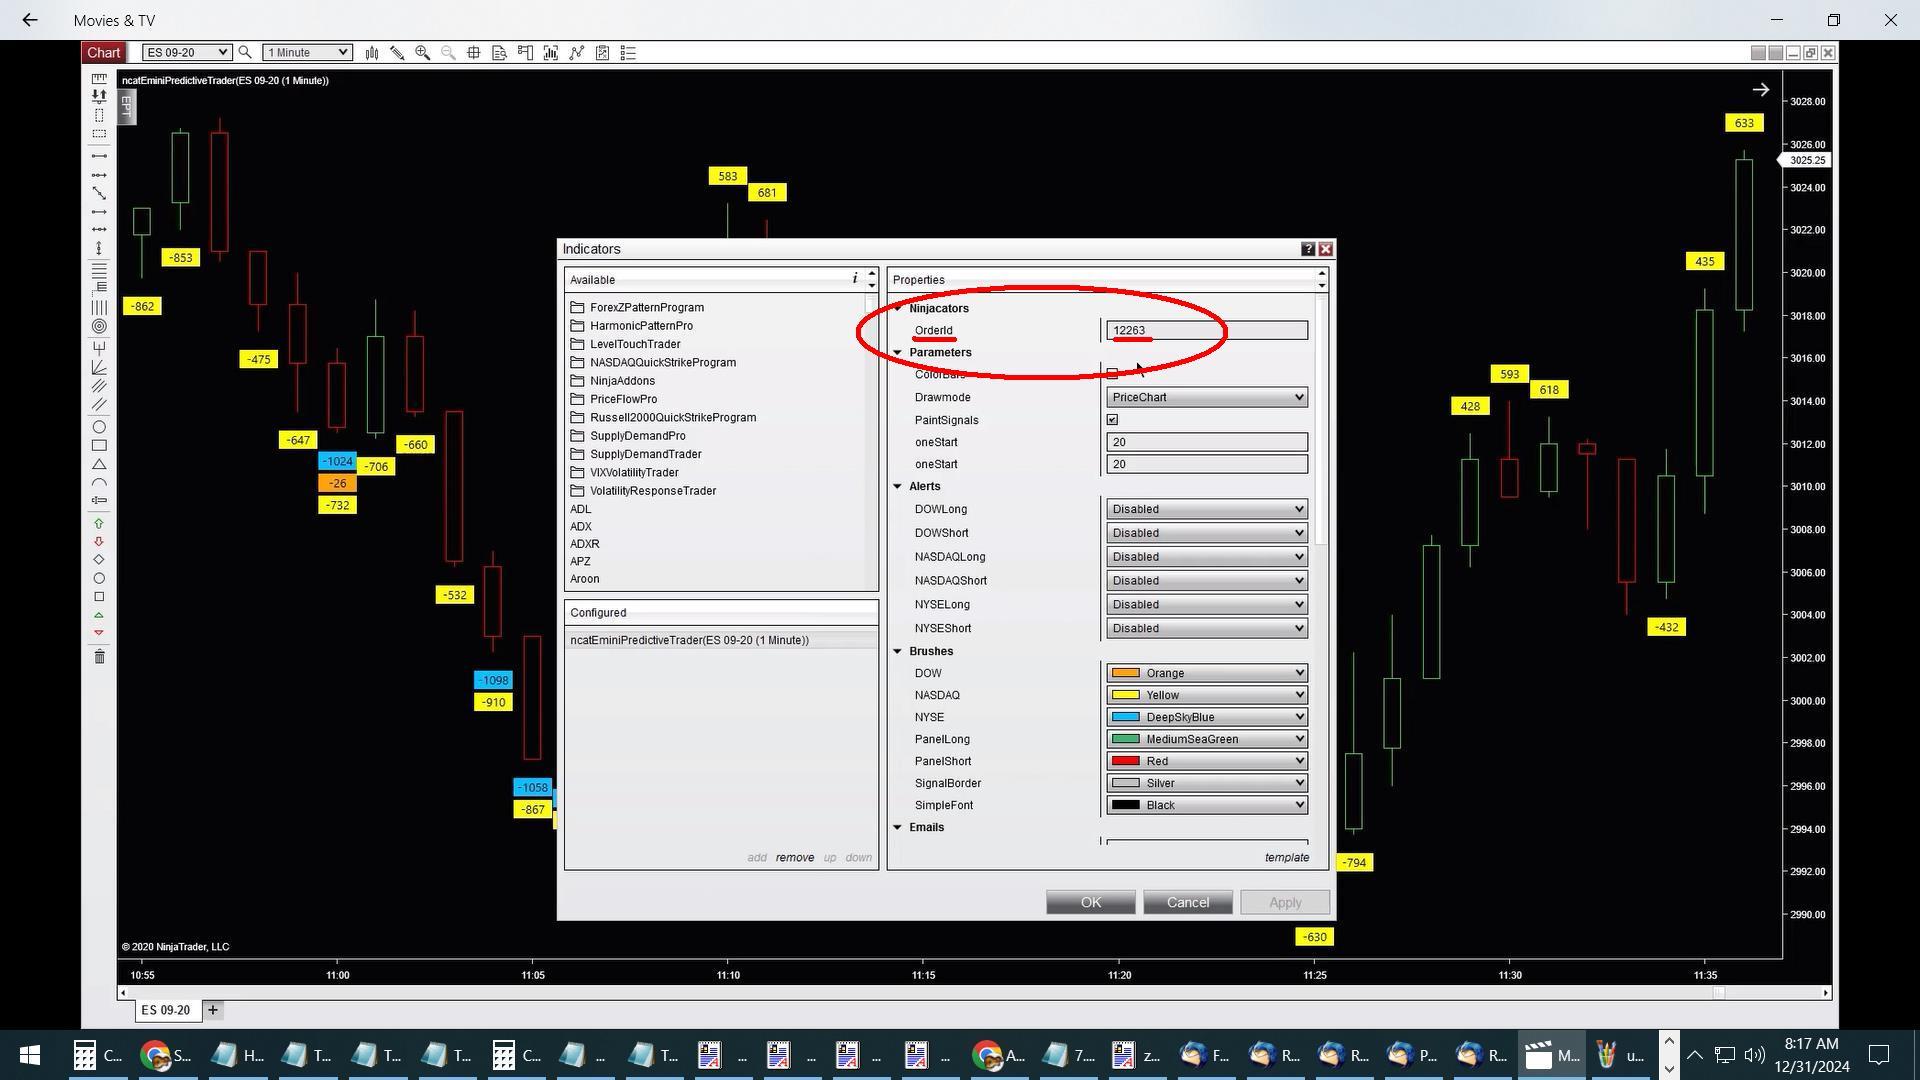
Hey Ninja_On_The_Roof, Great! thanks! I dwnld'd both. I'd actually deleted my NT I got so discouraged, so I have to re-install it before I get a good look at this indicator. So neither one of these require an order ID? The other one I found a few months ago required it. (attaching screenshot from THEIR video.) Again, thanks a bunch! Ardubya
-
Add that free swing indicator that comes with ninjatrader. Look to your left on chart.
-
please unlock HFT Spectre