

⤴️-Paid Ad- Check advertising disclaimer here. Add your banner here.🔥
All Activity
- Past hour
-
 Trader D joined the community
 -
Welcome to Indo-Investasi.com. Please feel free to browse around and get to know the others. If you have any questions please don't hesitate to ask.
- Today
-
 Green light joined the community
 -

roboforex Market Fundamental Analysis by RoboForex
RBFX Support replied to RBFX Support's topic in Fundamental Analysis
Solana may become scarce as developers prepare a major update After its decline, the Solana price is developing a new upward wave in anticipation of updates, currently trading at 73.60. SOLUSD forecast: key takeaways The validator community is still debating the SGP-0003 package Developers continue to prepare the Alpenglow update for release SOLUSD forecast for 6 August 2026: 76.75 or 72.90 Fundamental analysis The validator community is still debating the SGP-0003 package, which includes the SIMD-0550 and SIMD-0553 proposals. If adopted, the network could significantly increase the daily burn of SOL through a new fee while also slowing the issuance of new coins more rapidly. In the longer term, this may become a factor putting pressure on the amount of tokens in circulation. The SOLUSD forecast for 6 August 2026 takes into account that institutional investor interest in the ecosystem remains strong. Following the recent launch of tokenised money market funds and the more active use of the network for stablecoin settlements, Solana is becoming increasingly established as infrastructure for traditional finance, rather than only for DeFi and NFTs. RoboForex Market Analysis & Forex Forecasts Attention! Forecasts presented in this section only reflect the author’s private opinion and should not be considered as guidance for trading. RoboForex bears no responsibility for trading results based on trading recommendations described in these analytical reviews. Sincerely, The RoboForex Team -
Market Technical Analysis by RoboForex
RBFX Support replied to RBFX Support's topic in Technical Analysis
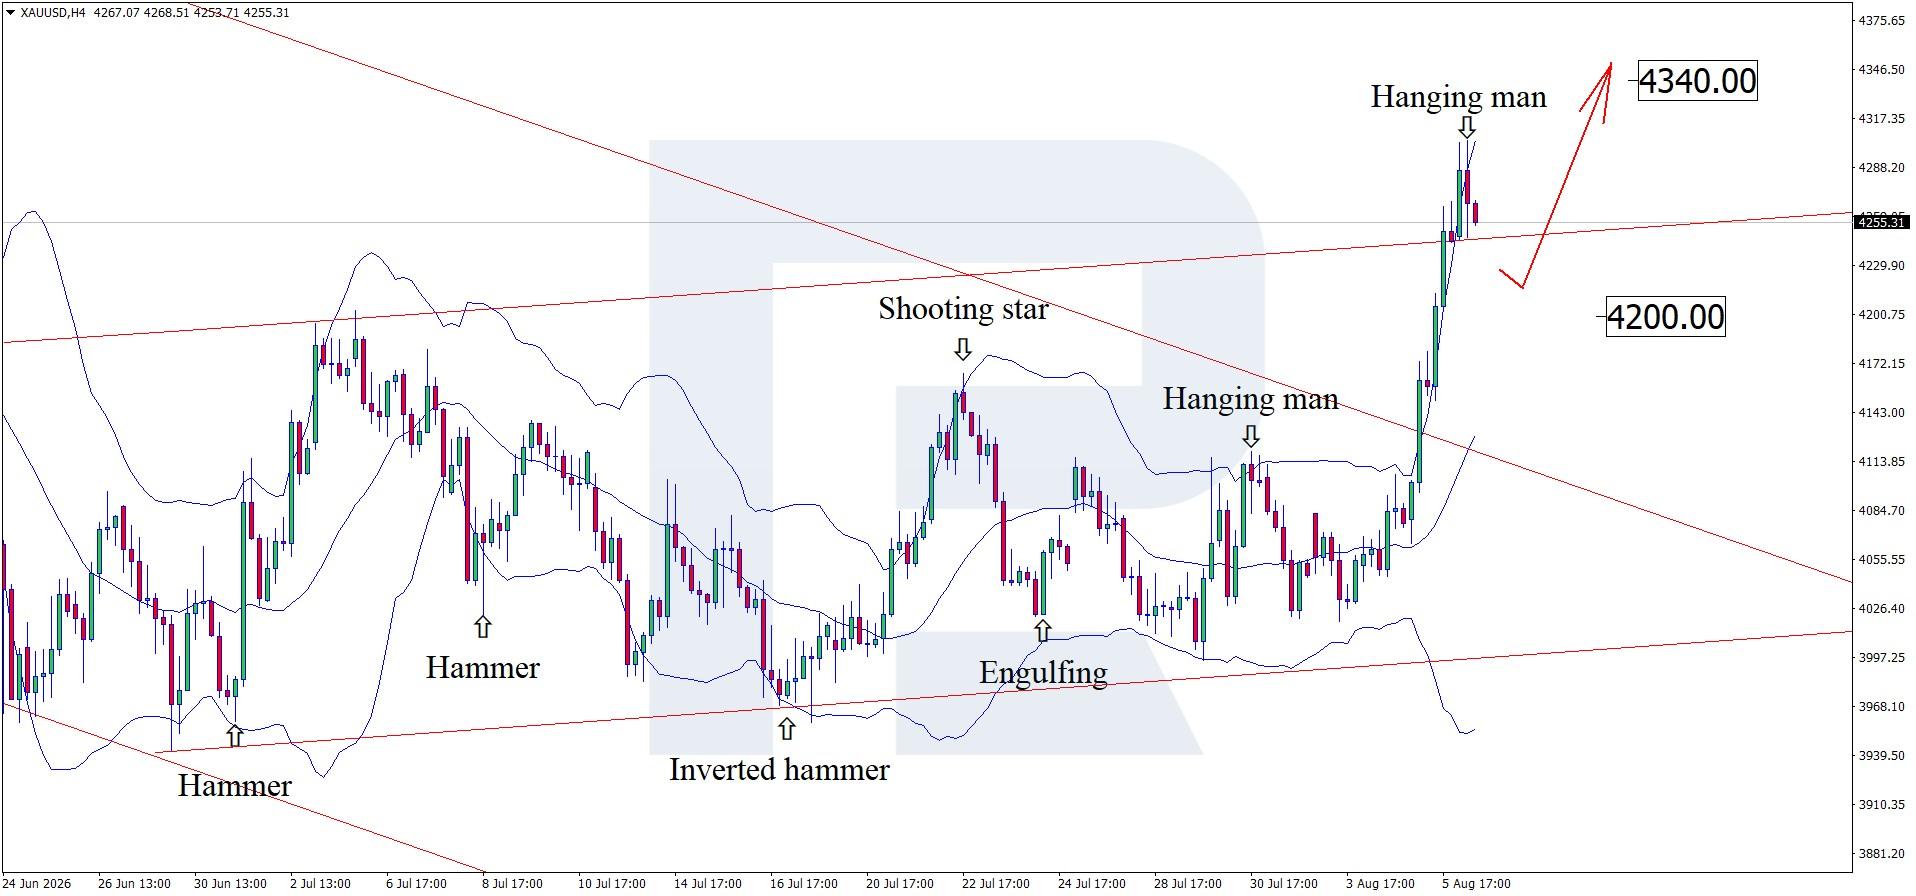
Gold catches a wave: can XAUUSD maintain momentum after NFP? Gold is forming a corrective wave after its surge. The main trigger of the week is the Nonfarm Payrolls report. Prices currently stand at 4,255 USD Technical outlook On the H4 chart, XAUUSD prices formed a Hanging Man reversal pattern near the upper Bollinger Band. As the pattern signal develops, quotes may continue their corrective wave. Gold continues to strengthen amid a weaker USD and expectations ahead of the US employment data release. Read more - Gold Forecast Attention! Forecasts presented in this section only reflect the author’s private opinion and should not be considered as guidance for trading. RoboForex bears no responsibility for trading results based on trading recommendations described in these analytical reviews. Sincerely, The RoboForex Team
-
 The link isn't working. Can I set a new link? Thank you.
 -

HFMarkets (hfm.com): Market analysis services.
AllForexnews replied to AllForexnews's topic in Fundamental Analysis
Date: 6th August 2026. Gold Posts Its Biggest Rise in Six Months: Can the Rally Continue? Gold sees its largest bullish rise in six months as oil prices continue to fall. Crude oil prices have now fallen to $75.00, the lowest in almost four weeks due to a possible Oman-Iran agreement. According to Iran, an agreement has been reached but does not necessarily open the strait fully. Gold is rising as investors expect lower oil prices to pressure inflation, meaning fewer interest rate hikes. As a result, investors can again invest in non-yielding assets such as Gold. However, this primarily depends on how low oil prices and inflation fall. 38% of analysts continue to expect the Federal Reserve to hike twice this year, while 43% believe it will hike once. As a result, the price of oil and next week’s inflation rate will primarily determine if Gold’s momentum will continue. Crude Oil - Iran and Oman Reach a Temporary Agreement on The Strait of Hormuz Oman and Iran have come to an agreement to safely open the strait to certain ships. However, Iran has also said the deal will proceed if ‘certain parties do not obstruct the process’. Here, Iran is referring to the US, which is holding separate talks with Iran. Oil prices are falling based on the news of the agreement. However, investors should note that the agreement is relatively weak. The agreement only covers a limited number of ships through a small route. In addition to this, the US continues to block the strait to Iran. For this reason, market analysts remain cautious about any positive news while the US does not have an agreement in place with Iran. In the past two weeks the price has fallen by 21% but based on historic correlations between oil prices and inflation, this is not enough to pressure inflation. The Federal Reserve is looking to push inflation to 2%, with inflation currently at 3.5%. As a general rule, most economists believe that if oil prices remain 10% lower than their previous price, inflation falls by a maximum of 0.40%. So far, inflation has fallen by 20% meaning a further 10% is needed to bring inflation down to its target. Therefore, oil would need to fall to $66 per barrel and remain there for some time in order for inflation to fall to 2%. Otherwise, the Federal Reserve is likely to continue considering interest rate adjustments. Currently, the price of Crude Oil is struggling to cross below the support level of $74.40. Over the past 24 hours three attempts have been seen. However, the price action will largely depend on the US and Iranian negotiations. If the price breaks below the support level, technical analysts will maintain a bearish bias, targeting the psychological $70.00 level next, followed by support at $68.00. HFM - Crude Oil 30-Minute Chart Gold - Importance of Inflation Gold prices saw a significant surge on Wednesday in response to lower oil prices, a weaker Dollar and hopes that this could lower inflation. However, this cannot yet be known, as demand and the employment sector remains resilient. On Wednesday, three members of the Federal Reserve spoke to journalists about monetary policy. All three generally sounded hawkish and willing to hike interest rates. Tomorrow’s NFP data will trigger volatility for Gold and the US Dollar, however, the inflation rate next week will be more influential. Stronger NFP data and higher inflation are likely to weaken Gold, while weaker data could fuel a medium-term rise. Gold’s technical outlook remains cautiously bullish in the short term. The price is trading above its 50-day moving average, and momentum indicators continue to strengthen. Immediate resistance is located around $4,300, and a break above this price could indicate a further rise. On the downside, traders may first target the $4,220–$4,200 support zone, followed by the more significant $4,157 level. As long as gold remains above $4,160, bearish signals are avoided; however, a rejection from $4,300 and a break below this support would weaken the bullish structure. HFM - Gold 30-Minute Chart Key Takeaway Points: Gold posted its strongest six-month rally as oil prices and the US Dollar declined. The temporary Oman-Iran agreement pushed crude oil towards $75, but the deal remains limited and uncertain. Oil may need to fall towards $66 and stay there to significantly reduce inflation pressure to the Fed’s target. Gold’s next major catalysts are the US jobs report and next week’s inflation data. Gold remains cautiously bullish above $4,160, with resistance near $4,300. Always trade with strict risk management. Your capital is the single most important aspect of your trading business. Please note that times displayed based on local time zone and are from time of writing this report. Click HERE to access the full HFM Economic calendar. Want to learn to trade and analyse the markets? Join our webinars and get analysis and trading ideas combined with better understanding of how markets work. Click HERE to register for FREE! Click HERE to READ more Market news. Michalis Efthymiou HFMarkets Disclaimer: This material is provided as a general marketing communication for information purposes only and does not constitute an independent investment research. Nothing in this communication contains, or should be considered as containing, an investment advice or an investment recommendation or a solicitation for the purpose of buying or selling of any financial instrument. All information provided is gathered from reputable sources and any information containing an indication of past performance is not a guarantee or reliable indicator of future performance. Users acknowledge that any investment in Leveraged Products is characterized by a certain degree of uncertainty and that any investment of this nature involves a high level of risk for which the users are solely responsible and liable. We assume no liability for any loss arising from any investment made based on the information provided in this communication. This communication must not be reproduced or further distributed without our prior written permission. -
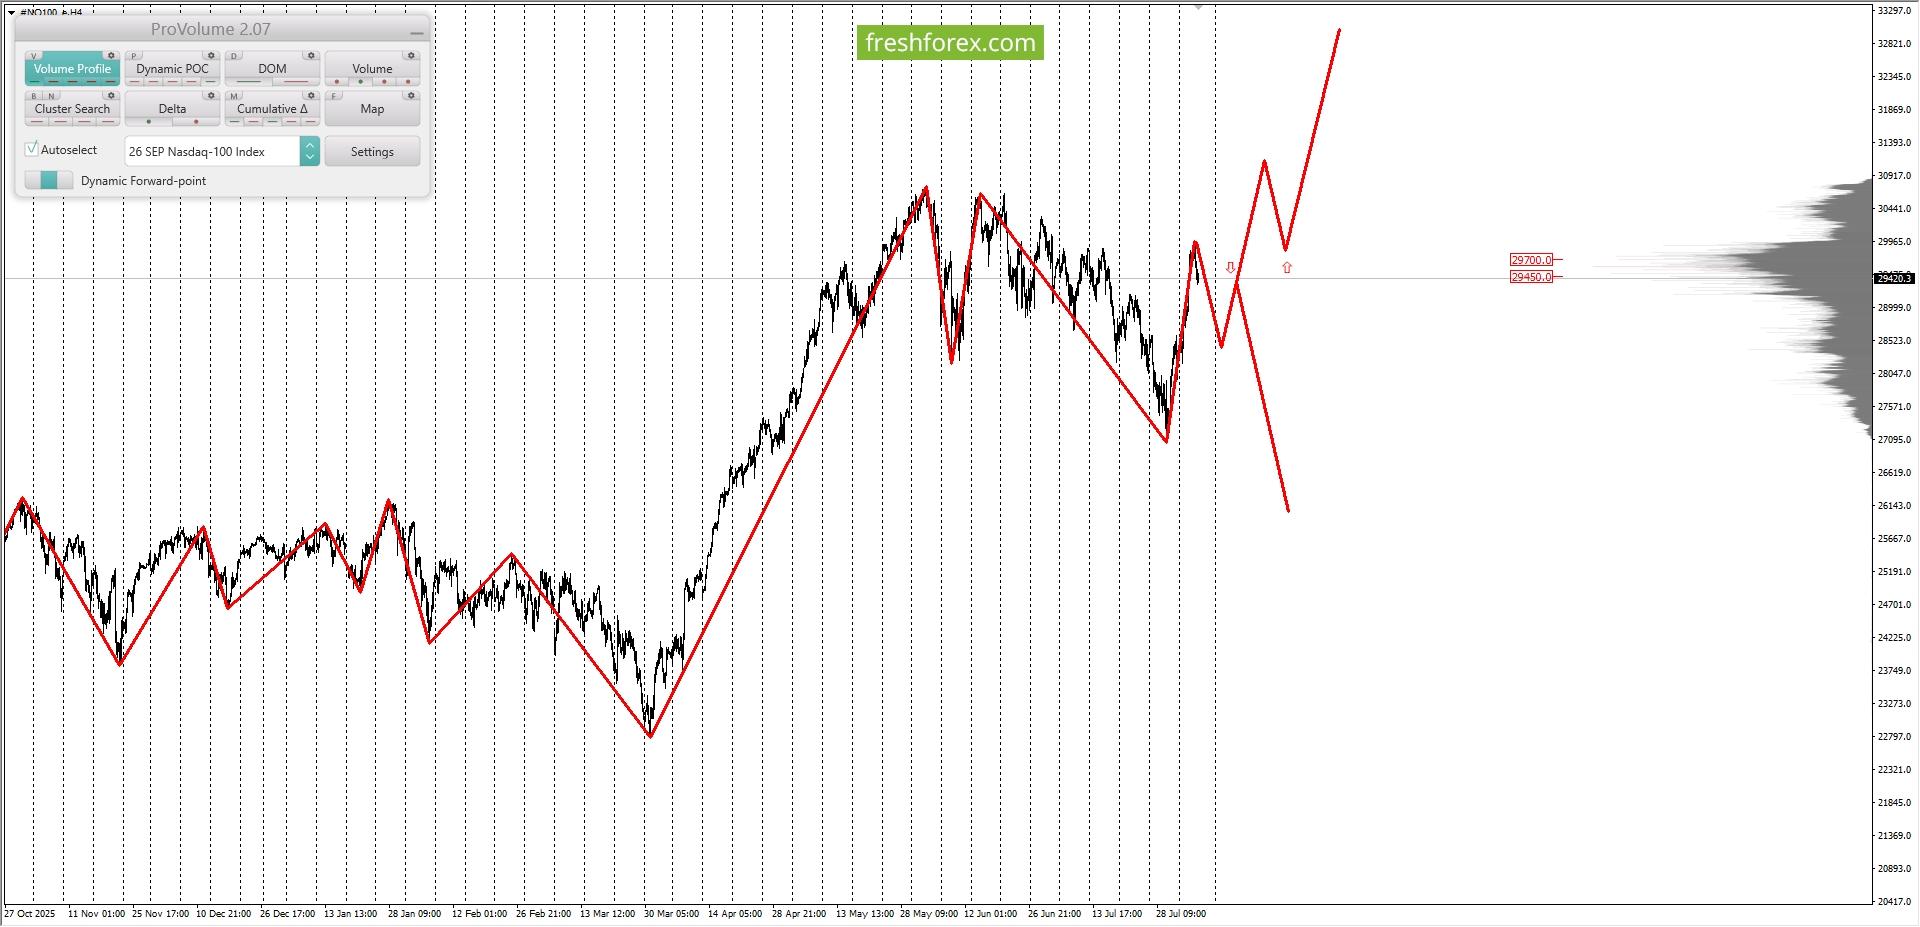
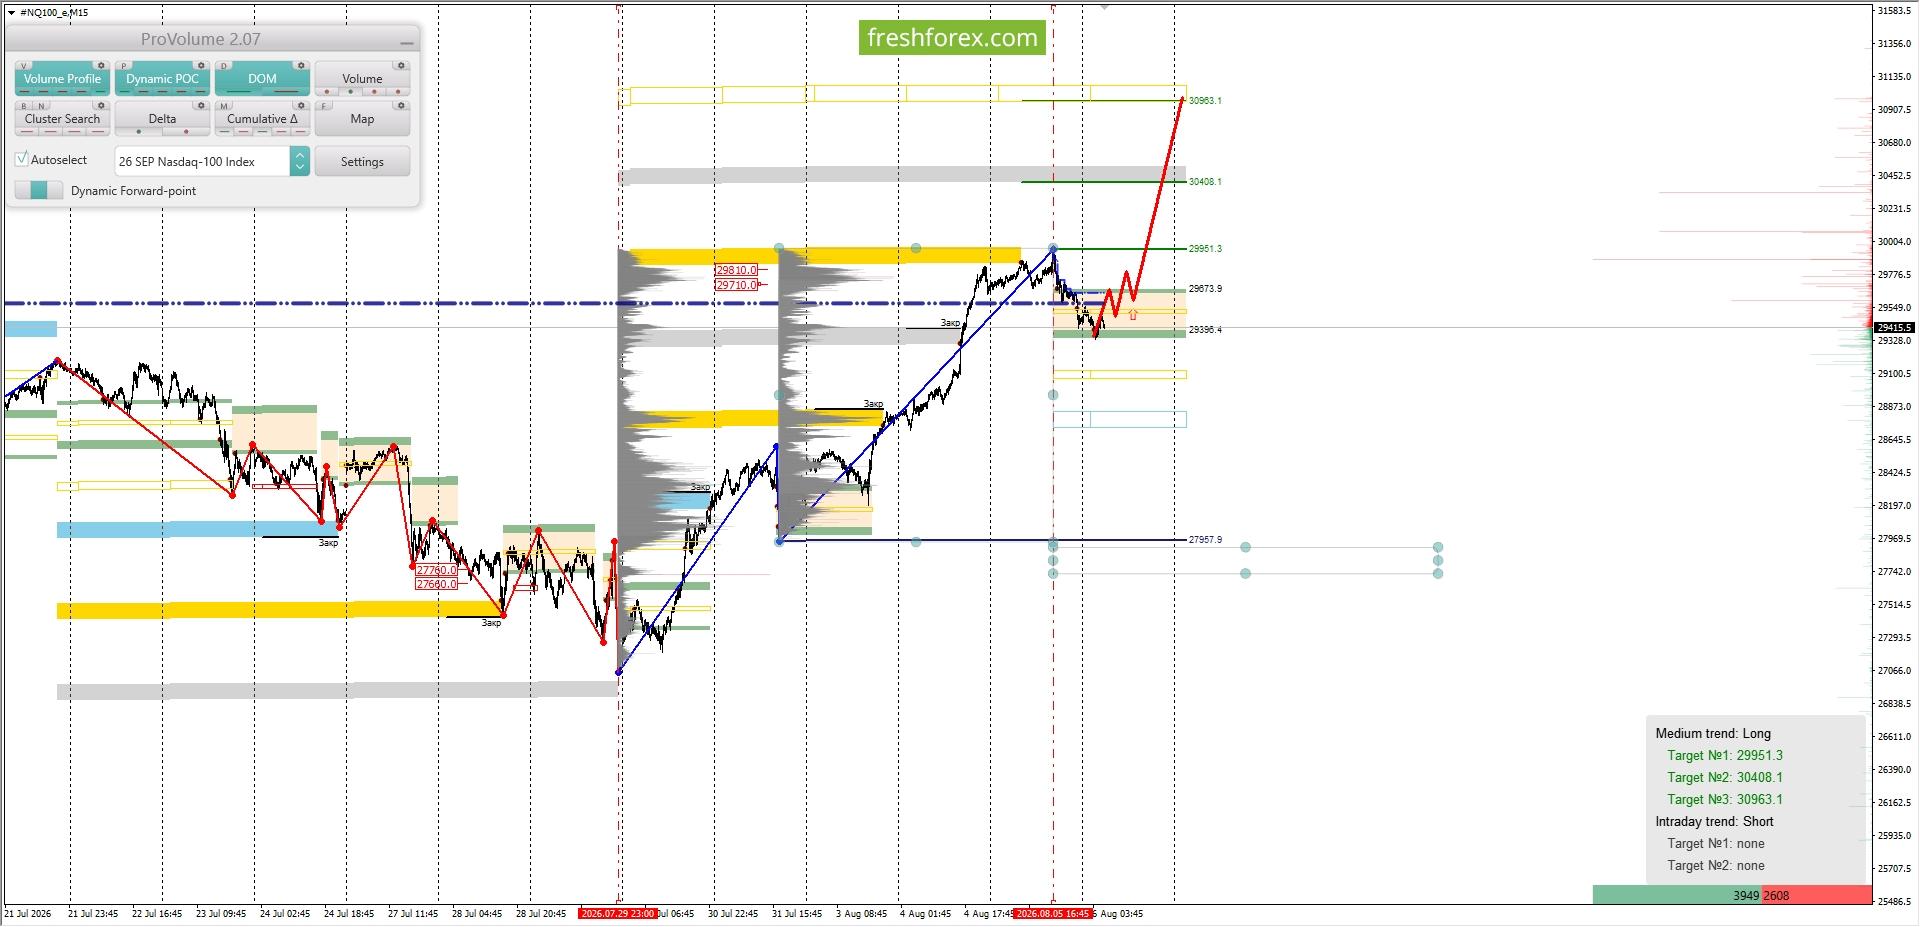
 Analysis of margin levels for August 6, 2026 #NQ100 #NQ100: BUY 29364.4-29673.9, TP1-29951.3, TP2-30963.1. Exclusively for our readers — get $10 to start trading with no deposit required! Register, complete verification, and enter the promo code INDOINVEST10 in your Client Area. This is a limited offer: the bonus is available to the first 100 participants only. Long-term trend: bearish. The highest concentration of volumes in the current contract is located within the 29450.0–29700.0 range. Investment activity in #NQ100 is currently taking place below this range, indicating seller strength. Medium-term trend: bullish. The highest concentration of medium-term volumes is located within the 27660.0–27760.0 and 29710.0–29810.0 ranges. Investment activity in #NQ100 is currently taking place within this range, indicating temporary uncertainty. From the perspective of margin requirements, the favorable buying area is located between the 1/4 and 1/2 zones constructed from the high of 05.08.2026. The upper boundary of the 1/4 zone is 29673.9. The upper boundary of the 1/2 zone is 29364.4. Intraday target: a retest of the 05.08.2026 high at 29951.3. Medium-term target: a test of the lower boundary of the GWCZ at 30963.1. Investment recommendation: buy from the favorable price range if a reversal pattern forms. Buy: 29364.4-29673.9, Take Profit 1-29951.3, Take Profit 2-30963.1.
-
 a83n3rmkva reacted to a post in a topic:
Timingsolution & Nifty Updates - 3
a83n3rmkva reacted to a post in a topic:
Timingsolution & Nifty Updates - 3
- Yesterday
-
 Nedek joined the community
 -
This topic is for an e-book. Perhaps you may have better success posting this as a separate topic.
-
Bro to bother u,
Which ema do you use for your meanrenko on mt4 please.
I see u use 2 ema.
U can tell me their size
-
roboforex Market Fundamental Analysis by RoboForex
RBFX Support replied to RBFX Support's topic in Fundamental Analysis
US 30 forecast: the index reaches a new all-time high The US 30 index rose by more than 5% and hit a new all-time high. The US 30 forecast for today is positive. US 30 forecast: key takeaways Recent data: the US Federal Reserve kept its interest rate unchanged at 3.75% Market impact: the data is moderately positive for the stock market Fundamental analysis The Federal Reserve’s decision to keep the target range for the federal funds rate at 3.50–3.75% was formally in line with market expectations. However, the statement and the comments from the Fed leadership are more important than the fact that the rate was left unchanged. For the US 30 index, the news is primarily a restraining factor. Keeping the rate unchanged could have supported the market, as companies and investors did not face an immediate further increase in financing costs. RoboForex Market Analysis & Forex Forecasts Attention! Forecasts presented in this section only reflect the author’s private opinion and should not be considered as guidance for trading. RoboForex bears no responsibility for trading results based on trading recommendations described in these analytical reviews. Sincerely, The RoboForex Team -
Gold is too volatile for me for intraday trading, but it does tend to follow seasonal patterns well. I entered a long position on June 29 with a tight stop. The entry was confirmed by a bullish engulfing pattern—a signal that has historically always led to a rise in the price of gold. The 76.4% retracement level at approximately $4,655 should be reached at a minimum; the price might even hit $5,000. However, the price should not drop below $4,000.
-
Market Technical Analysis by RoboForex
RBFX Support replied to RBFX Support's topic in Technical Analysis
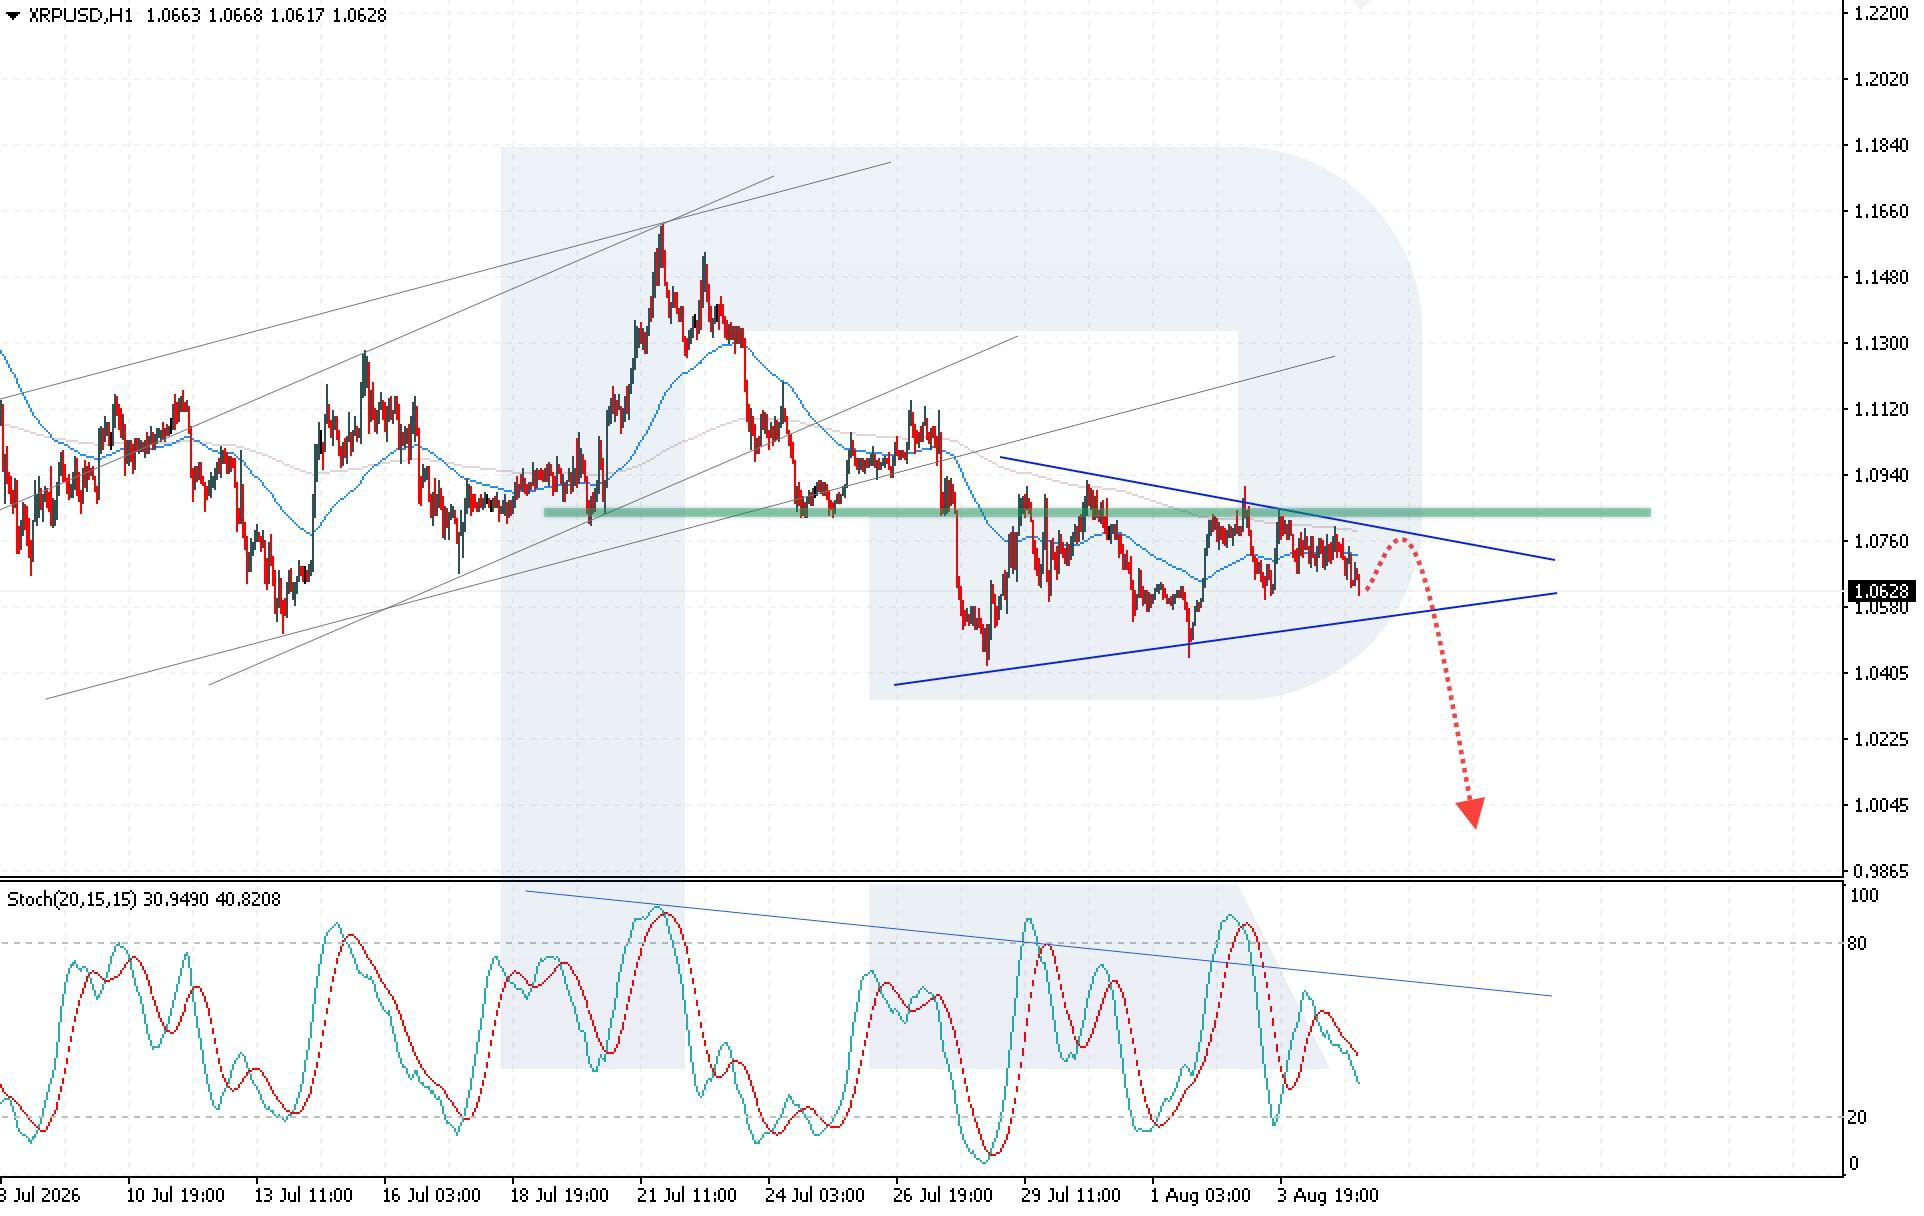
XRPUSD risks further decline as bearish momentum strengthens The XRPUSD price remains under selling pressure after reversing from key resistance levels. The current quote is 1.0628. Technical outlook XRPUSD quotes are declining after rebounding from the upper boundary of the Triangle pattern. Price action analysis indicates that sellers remain in control. Today’s XRPUSD forecast suggests a decline towards 1.0045. Today’s XRPUSD analysis indicates selling pressure following a rebound from the upper boundary of the Triangle pattern. Read more - XRPUSD Forecast Attention! Forecasts presented in this section only reflect the author’s private opinion and should not be considered as guidance for trading. RoboForex bears no responsibility for trading results based on trading recommendations described in these analytical reviews. Sincerely, The RoboForex Team
-
HFMarkets (hfm.com): Market analysis services.
AllForexnews replied to AllForexnews's topic in Fundamental Analysis
Date: 5th August 2026. Stocks Surge as AI Rebounds and Falling Oil Reshapes the Forex Outlook. Asian stock markets rallied sharply on Wednesday as investors returned to technology and semiconductor shares following a record-breaking session on Wall Street. The recovery was supported by three developments that had previously weighed heavily on global risk appetite: oil prices continued to decline, government bond yields moved lower, and strong corporate earnings revived confidence in artificial intelligence-related investment. Japan and South Korea led the advance, while gains in China, Australia, and other regional markets indicated that the improvement in sentiment was not limited to a single country. For forex traders, however, the most important question is whether falling energy prices and bond yields can continue to weaken inflation expectations and reduce pressure on central banks to raise interest rates. The S&P 500 gained approximately 1.8% on Tuesday and closed at a fresh record, while the NASDAQ Composite jumped around 2.6%. NVIDIA, Broadcom, and Micron were among the strongest performers as investors returned to semiconductor shares following the recent technology-sector correction. NVIDIA gained more than 2% after Elon Musk praised the company’s processors and highlighted their potential role in SpaceX’s artificial intelligence and computing plans. The comments reinforced expectations that spending on AI infrastructure, advanced processors, and data centres will continue to expand. Nevertheless, the earnings reaction was far from universally positive. AMD shares fell approximately 8.8% in after-hours trading even though the company reported record quarterly revenue of $11.5 billion, representing an increase of 50% from the previous year. Data centre revenue more than doubled, while AMD forecast third-quarter revenue of approximately $13 billion, plus or minus $300 million. The sell-off suggests that strong growth alone may no longer be enough for highly valued AI companies. Investors increasingly expect earnings, guidance, and margins to exceed already elevated forecasts. SpaceX also dropped around 7.5% following its first quarterly report as a publicly traded company. Concerns that heavy AI and infrastructure investment could consume cash flow overshadowed the company’s operational growth. The next potential volatility event will arrive on Thursday, when up to 912 million shares held by employees and other pre-IPO investors are expected to become eligible for sale. Japan and South Korea Lead the Asian Recovery The positive momentum quickly spread across North Asia. Japan’s Nikkei 225 advanced approximately 3.5%, while South Korea’s KOSPI rose more than 4%. SK Hynix gained nearly 7%, Samsung Electronics climbed around 4% and several Japanese semiconductor and electronic-component companies recorded strong gains. MSCI’s index of Asia-Pacific shares outside Japan rose approximately 2.3%, while Chinese blue-chip stocks added around 1.5%. The Australian S&P/ASX 200 also reached a new record as financial and mining shares supported the index. The regional rally represents a strong rebound from the recent AI-sector sell-off, but it does not necessarily mean that all concerns have disappeared. Investors are still evaluating whether the enormous amounts being invested in AI infrastructure will generate sufficient long-term returns. China also faces an additional source of risk. The Trump administration is reportedly preparing restrictions on imports of new Chinese optical transceivers and other data centre components on national security grounds. Shares of several Chinese optical-equipment manufacturers came under pressure following the reports, partially offsetting the wider semiconductor rally. The most significant macroeconomic support came from oil. Brent crude declined towards $79 per barrel, substantially below its July peak of approximately $102. West Texas Intermediate fell towards $75 as investors reacted to signs of progress in negotiations involving the United States, Iran, and Oman. The proposed arrangement could establish a temporary 60-day system for reopening shipping routes through the Strait of Hormuz. Under the reported plan, inbound vessels would travel through a northern lane near Iran, while outbound vessels would use a southern route through Omani waters. No final agreement had been officially confirmed at the time of writing. Previous negotiations have also collapsed, meaning traders should remain prepared for renewed geopolitical volatility. The Strait of Hormuz is one of the world’s most important energy transit routes. Before the conflict, approximately one-fifth of the world’s oil supply passed through the waterway. A sustained reopening would increase the flow of oil out of the Persian Gulf and reduce the geopolitical risk premium built into crude prices. For forex traders, lower oil prices can have several important consequences: Reduced inflation expectations may decrease pressure on the Federal Reserve and other central banks to tighten monetary policy. Oil-importing economies and currencies may benefit from lower energy costs. Oil-exporting currencies could lose some support if crude prices extend their decline. Improved risk appetite may weaken demand for traditional safe-haven currencies. Lower oil prices have already provided relief to government bond markets. The US 10-year Treasury yield declined to approximately 4.60%, compared with a recent high of around 4.75%. Markets also reduced the estimated probability of a Federal Reserve rate increase in September to approximately 57%, down from 67%. This repricing reflects expectations that lower energy prices could limit the inflationary impact of the Middle East conflict. However, the Fed outlook remains uncertain. Kansas City Fed President Jeff Schmid recently argued that tighter monetary policy may still be necessary to return inflation to the central bank’s 2% target. The combination of lower yields and improving equity sentiment placed modest pressure on the US Dollar. EUR/USD traded close to $1.1540, near its highest level in approximately six weeks. USD/JPY slipped towards 157.60, although intervention risk remains elevated following last week’s rare coordinated Yen-buying operation by Japan and the United States. Comments from US Treasury Secretary Scott Bessent were also interpreted as support for further monetary tightening from the Bank of Japan. Expectations of higher Japanese interest rates could provide additional support for the Yen, particularly if Japanese authorities remain willing to intervene. The New Zealand Dollar underperformed after unemployment rose to 5.6% in the June quarter, its highest level in approximately a decade. The data may strengthen expectations that the Reserve Bank of New Zealand will adopt a more cautious monetary policy stance. Gold gained approximately 1.6% and traded around $4,140 per ounce. Ordinarily, a strong equity rally might reduce demand for defensive assets such as gold. However, the decline in Treasury yields supported the precious metal because gold does not offer interest payments and therefore tends to become relatively more attractive when bond yields fall. A softer US Dollar also made gold less expensive for investors using other currencies. Gold traders must now balance two competing forces. Further diplomatic progress in the Middle East could reduce safe-haven demand, but declining yields and lower expectations of additional Fed tightening could continue to support prices. Attention now turns towards major US economic data that could determine whether the decline in Treasury yields and the US Dollar continues. The July ADP private-employment report is scheduled for 12:15 GMT on Wednesday, followed by the ISM Services PMI at 14:00 GMT. Traders should pay particular attention to the employment and prices components of the ISM report, as these may influence expectations for inflation and Federal Reserve monetary policy. The more influential July nonfarm payrolls report will be released on Friday, 7 August, at 12:30 GMT. A stronger-than-expected labour report could revive rate-hike expectations, push Treasury yields higher, and support the US Dollar. A weaker report could reinforce the recent decline in yields, weigh on the Dollar and provide further support to gold and equity markets. The Asian stock market rally rests on three improving conditions: continued AI investment, falling oil prices, and lower bond yields. For the moment, these factors are supporting equities and reducing demand for the US Dollar. However, the outlook remains vulnerable to sudden reversals. A breakdown in the Hormuz negotiations could send oil prices sharply higher again. Strong US employment or services data could revive expectations of further Fed tightening. Meanwhile, disappointing earnings or rising financing costs could renew concerns about the profitability of AI investment. Forex traders should therefore monitor oil, Treasury yields, and technology shares together. Their interaction is currently shaping movements across USD/JPY, EUR/USD, commodity currencies, and gold more than any single market in isolation. Always trade with strict risk management. Your capital is the single most important aspect of your trading business. Please note that times displayed based on local time zone and are from time of writing this report. Click HERE to access the full HFM Economic calendar. Want to learn to trade and analyse the markets? Join our webinars and get analysis and trading ideas combined with better understanding of how markets work. Click HERE to register for FREE! Click HERE to READ more Market news. Andria Pichidi HFMarkets Disclaimer: This material is provided as a general marketing communication for information purposes only and does not constitute an independent investment research. Nothing in this communication contains, or should be considered as containing, an investment advice or an investment recommendation or a solicitation for the purpose of buying or selling of any financial instrument. All information provided is gathered from reputable sources and any information containing an indication of past performance is not a guarantee or reliable indicator of future performance. Users acknowledge that any investment in Leveraged Products is characterized by a certain degree of uncertainty and that any investment of this nature involves a high level of risk for which the users are solely responsible and liable. We assume no liability for any loss arising from any investment made based on the information provided in this communication. This communication must not be reproduced or further distributed without our prior written permission. -
 Market Fundamental Analysis for August 5, 2026 USDJPY Event to watch today: 15:15 EET. USD – ADP Employment Change 17:00 EET. USD – ISM Services PMI USDJPY: The yen is receiving fresh fundamental support following the release of the minutes from the Bank of Japan’s June meeting. The document showed that policymakers were paying increased attention to inflation risks and considering the possibility of further rate increases. Additional support came from data showing that real wages rose by 1.6% in June, marking a sixth consecutive monthly increase and strengthening the case for monetary policy normalization. Only for our readers: mention the one-time promo code GIFT20 in the support chat and get +20% on your next deposit of any amount. The maximum bonus amount is $500. Only one promo code can be applied to a deposit at a time. Pressure on USDJPY is also being reinforced by the recent joint intervention by the United States and Japan in support of the yen. Officials indicated that they were prepared to act again, while the US side publicly backed Tokyo’s efforts. At the same time, lower US Treasury yields and a reduced probability of another Federal Reserve rate increase are diminishing the appeal of interest rate differential trades. Slower growth in Japan’s services sector remains a limiting factor, meaning that sustained yen appreciation is not guaranteed. Strong US ADP or ISM data could also restore demand for the dollar. Nevertheless, the combination of a weaker dollar impulse, expectations of further Bank of Japan action, and the risk of renewed official measures makes a decline in USDJPY the more resilient base-case scenario. Trading idea: SELL 157.50, SL 158.15, TP 155.90
-
 dvc joined the community
 -
I am the owner of astrogann.com I want to sale this site including all of code astro indicator on that site.
-
 Polako joined the community
 - Last week
-
 Emzl30 joined the community
 -
 jerry joined the community
 -
 marketz joined the community
 -
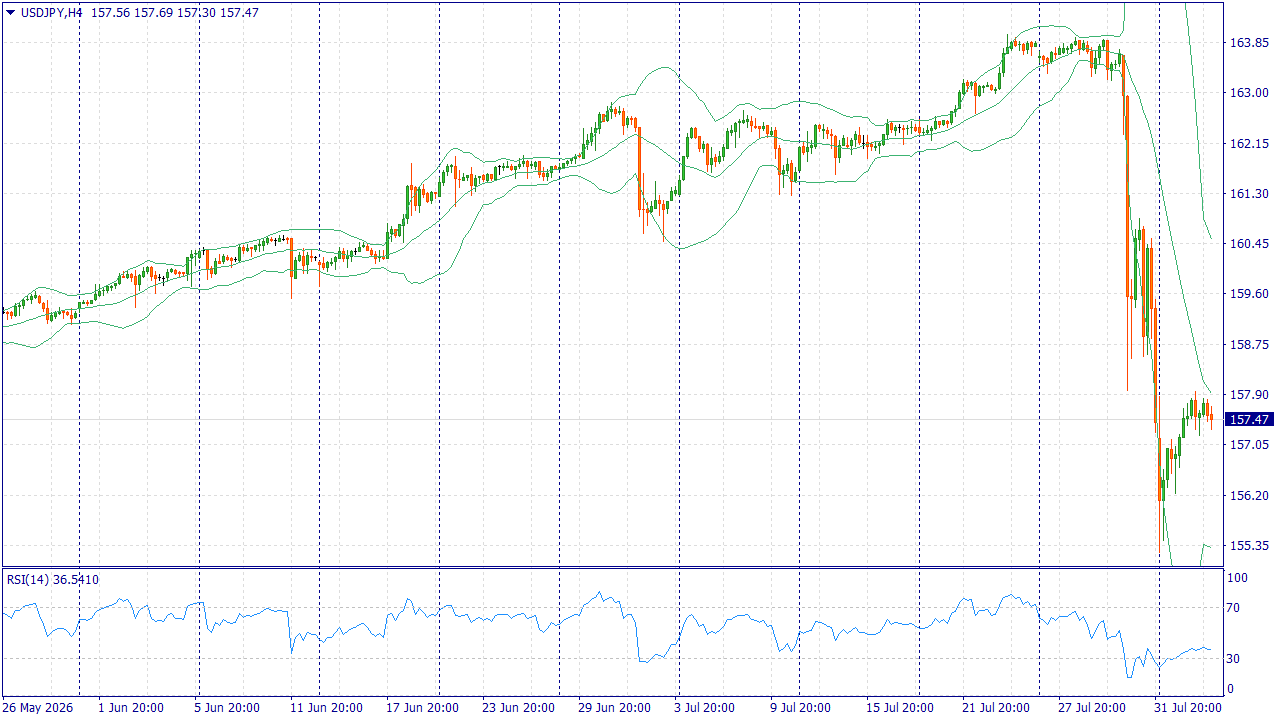
USDJPY Reverses from 40-Year High The USDJPY pair retreated from multi-decade highs following a rare joint intervention by the United States and Japan. In July, quotes climbed to 163.99 — the highest level in around 40 years — but by August 4, they had declined to the 157.7 area. At the peak of yen strengthening, the pair dropped to 155.20. A similar situation occurred in July 2024, when the pair rose to 161.9 and then fell to 139.7 over the following months. Japan’s Ministry of Finance confirmed that on July 31 it bought yen jointly with the U.S. Treasury. According to Reuters, the U.S. side used euros rather than dollars for the operation. This approach helped support the Japanese currency without creating the impression that Washington was aiming to weaken the dollar. Factors behind yen strengthening: Joint intervention. U.S. participation significantly amplified the impact of the operation and increased market confidence in authorities’ determination to halt the yen’s decline. For traders, this signaled that further USDJPY growth could face not only Japan’s actions but also support from Washington. Threat of further action. Japanese authorities stated they are ready to intervene again if yen weakness becomes excessively rapid. The risk of sudden intervention makes market participants more cautious about opening new positions against the yen. Closing speculative positions. The sharp drop in USDJPY forced traders to take profits on bets against the yen. The mass closing of such positions accelerated the pair’s decline and boosted short-term demand for the Japanese currency. At the same time, fundamental pressure on the yen has not disappeared. Interest rates in Japan remain lower than in the U.S., so the dollar still holds a yield advantage. Without further tightening by the Bank of Japan, the effect of the intervention may gradually fade. In the near term, key levels for USDJPY are 155 and 160. A move below 155 could strengthen the yen further, while a return above 160 would indicate that the impact of the intervention is weakening. According to FreshForex analysts, the risk of sharp USDJPY movements remains high. Traders should closely monitor statements from Japanese and U.S. authorities, Bank of Japan decisions, and U.S. labor market data. The possibility of another intervention creates trading opportunities but also increases the risk of sudden reversals. FreshForex offers over 250 trading instruments, including major currency pairs. Use USDJPY volatility to find trading opportunities and profit! Only for our readers: mention the one-time promo code GIFT20 in the support chat and get +20% on your next deposit of any amount. The maximum bonus amount is $500. Only one promo code can be applied to a deposit at a time.
-
 Feel_good joined the community
 -
Market Technical Analysis by RoboForex
RBFX Support replied to RBFX Support's topic in Technical Analysis
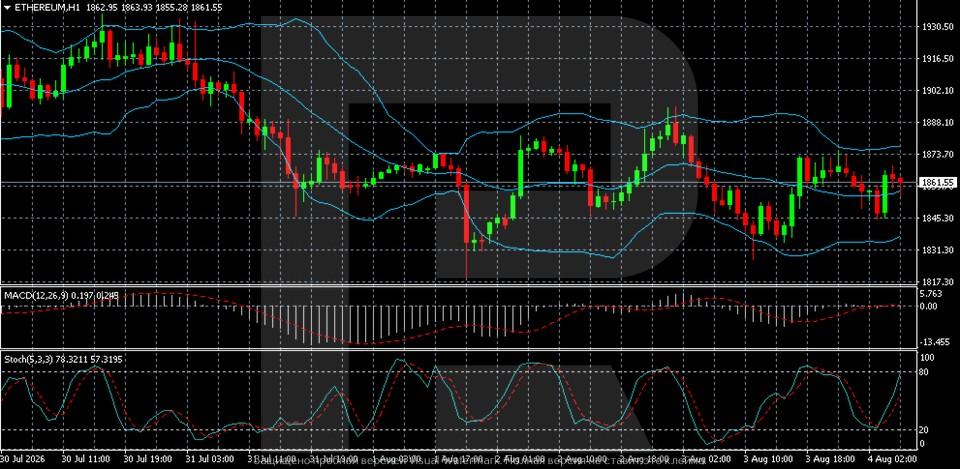
Ethereum (ETHUSD) is well positioned and only needs momentum Ethereum (ETHUSD) is trading near 1,861 USD on Tuesday. Tokenisation could provide support for ETH. Technical outlook On the H1 chart, Ethereum (ETHUSD) is trading near 1,862 and remains range-bound after recovering from the 1,831–1,840 area. The price is hovering near the middle Bollinger Band, while the indicator’s boundaries are gradually narrowing, indicating lower volatility and the absence of sustained directional momentum. The Ethereum price has entered a range, while fundamental support is strengthening. Read more - ETHUSD Forecast Attention! Forecasts presented in this section only reflect the author’s private opinion and should not be considered as guidance for trading. RoboForex bears no responsibility for trading results based on trading recommendations described in these analytical reviews. Sincerely, The RoboForex Team
-
roboforex Market Fundamental Analysis by RoboForex
RBFX Support replied to RBFX Support's topic in Fundamental Analysis
US 500 forecast: index approaches upper channel boundary The US 500 index is testing the resistance level again. A breakout could resume the uptrend. The US 500 forecast for today is positive. US 500 forecast: key takeaways Recent data: the US Federal Reserve held its interest rate steady at 3.75% Market impact: the data is moderately positive for the stock market Fundamental analysis The Federal Reserve’s decision to keep the interest rate within the 3.50–3.75% range was not a surprise to the market. However, the statement and the Federal Reserve chairman’s comments were far more important than the decision to leave the rate unchanged. For the US 500 index, the news is primarily negative in the short term. Initially, keeping the rate unchanged could have been viewed positively, as the regulator refrained from immediately raising borrowing costs further. RoboForex Market Analysis & Forex Forecasts Attention! Forecasts presented in this section only reflect the author’s private opinion and should not be considered as guidance for trading. RoboForex bears no responsibility for trading results based on trading recommendations described in these analytical reviews. Sincerely, The RoboForex Team -
Weekly Overview: XAUUSD, #SP500, #BRENT | 07 August 2026 XAUUSD: BUY 4060.00, SL 4020.00, TP 4160.00 Gold begins the week with moderate support as a weaker US dollar and a sharp decline in oil prices ease concerns about renewed inflationary pressure. However, the Federal Reserve’s decision to keep interest rates unchanged, alongside support from some policymakers for a rate increase, is keeping US Treasury yields elevated and limiting demand for the metal. The main test will come from the US labor market data. Weak figures could reduce expectations of a rate increase and strengthen interest in XAUUSD, while a strong report may restore pressure. If the US dollar remains subdued and oil market conditions stay stable, the base-case scenario allows for further gains in gold. Trading idea: BUY 4060.00, SL 4020.00, TP 4160.00 #SP500: BUY 7540, SL 7480, TP 7670 The #SP500 is receiving support from lower oil prices, which reduce the risk of renewed pressure on corporate costs and consumer demand. The earnings season also remains a source of resilience, although the market’s response to technology sector results is becoming more selective. This week, the index’s direction will be shaped by employment data and further corporate earnings reports. A strong labor market could revive expectations of a Federal Reserve rate increase and intensify pressure from elevated yields. For now, the decline in the energy risk premium is supporting demand for equities, leaving a cautious upside scenario as the base case. Trading idea: BUY 7540, SL 7480, TP 7670 #BRENT: SELL 83.50, SL 86.00, TP 78.50 Brent begins the week with a sharp decline after the United States cancelled new strikes against Iran and hopes for renewed negotiations increased. The restoration of traffic through the Strait of Hormuz could reduce the risk premium, while higher OPEC+ production quotas from September are reinforcing expectations of more abundant supply. Negotiations could still break down, while regional supplies remain constrained, meaning the decline in oil prices may not be one-sided. Nevertheless, part of the geopolitical premium has already been removed, while demand forecasts remain restrained. If the diplomatic scenario remains intact, the priority stays with further downside in #BRENT. Trading idea: SELL 83.50, SL 86.00, TP 78.50 Only for our readers: mention the one-time promo code GIFT20 in the support chat and get +20% on your next deposit of any amount. The maximum bonus amount is $500. Only one promo code can be applied to a deposit at a time.