⤴️-Paid Ad- Check advertising disclaimer here. Add your banner here.🔥
All Activity
- Past hour
-
Hi! Could someone edu this addon? Thank you @Minigems, @kimsam TQTOOL_V1.9.10.zip
-
 ⭐ nadjib reacted to a post in a topic:
Rithmic Data Isn't Working
⭐ nadjib reacted to a post in a topic:
Rithmic Data Isn't Working
- Today
-
 ⭐ option trader reacted to a post in a topic:
AFLWiz.exe for Amibroker registration.
⭐ option trader reacted to a post in a topic:
AFLWiz.exe for Amibroker registration.
-

roboforex Market Fundamental Analysis by RoboForex
RBFX Support replied to RBFX Support's topic in Fundamental Analysis
US 500 forecast: the index resumed growth on positive expectations from the Iran–US talks The US 500 index formed an uptrend due to the start of talks between the US and Iran, but the threat of the US blocking the Strait of Hormuz triggered a corrective decline. The US 500 forecast for today is negative. US 500 forecast: key takeaways Recent data: US CPI in March came in at 3.3% year-on-year Market impact: the data is positive for the stock market Fundamental analysis US inflation data showing annual consumer price growth at 3.3% versus a 3.4% forecast appears moderately positive for the US 500 at first glance, as the actual figure came in slightly below market expectations. For investors, this suggests price pressure was not as strong as previously feared. However, it is also important to note that the previous reading was notably lower at 2.4%, meaning inflation still accelerated compared to the previous period. Overall, this data creates a mixed but rather supportive backdrop for the US 500. The positive aspect is that inflation did not exceed the forecast, so the pressure on the Federal Reserve’s monetary policy may be somewhat lower than it would have been with a higher reading. RoboForex Market Analysis & Forex Forecasts Attention! Forecasts presented in this section only reflect the author’s private opinion and should not be considered as guidance for trading. RoboForex bears no responsibility for trading results based on trading recommendations described in these analytical reviews. Sincerely, The RoboForex Team -
@pygmalion5000 - From watching his latest videos, these 3 indicators seem to make up most of his active trading strategy: https://whop.com/mmtstore/mmt-polarity-indicator/ https://whop.com/mmtstore/mmt-fluxometer/ https://whop.com/mmtstore/mmt-god-mode/ Flow stack is just order flow stats & percentages above and below the candles. The candles color based on order flow and imbalances and track multiple instruments (i.e. - NQ, ES, etc.) so you are seeing market alignment. I believe the fluxometer and polarity confirm entry signals/exit signals. It seems like a really unique system. This is the video where he explains his current strategy using his indicators and is what got me interested: I have searched this website for those indicators but unfortunatly they are not posted.
-
Market Technical Analysis by RoboForex
RBFX Support replied to RBFX Support's topic in Technical Analysis
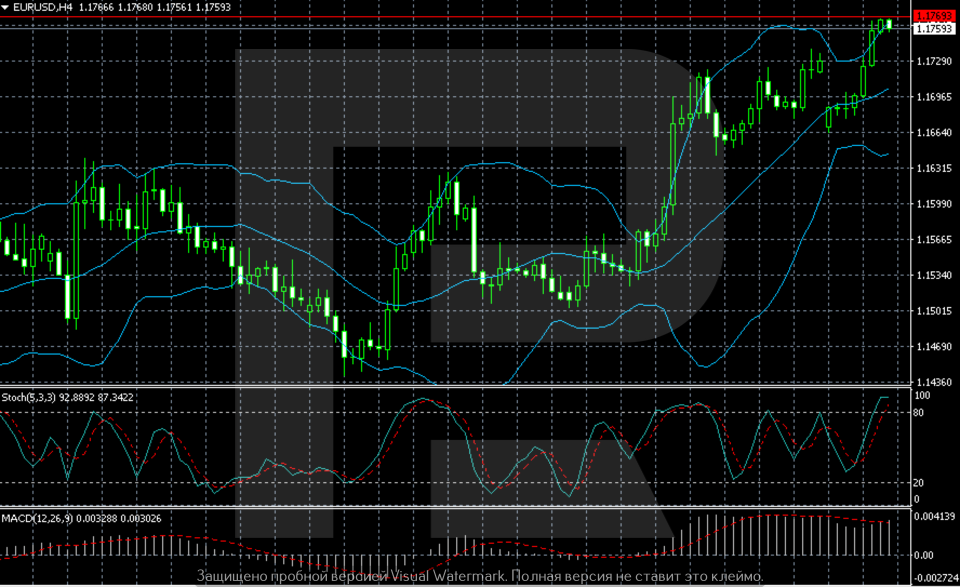
EURUSD is strengthening rapidly: a glimmer of positivity added momentum The EURUSD pair climbed to a six-week peak at 1.1769. Investors are watching a local improvement in the external environment. Discover more in our analysis for 14 April 2026. Technical outlook The EURUSD H4 chart shows that after the decline in late March, the market formed a solid base and began to move upwards. The latest upward momentum was fairly strong, with the price breaking above several local resistance levels and moving into the 1.1750–1.1770 zone, where it is now testing the upper boundary of the range. The EURUSD pair is rising, confirming technical momentum. Read more - EURUSD Forecast Attention! Forecasts presented in this section only reflect the author’s private opinion and should not be considered as guidance for trading. RoboForex bears no responsibility for trading results based on trading recommendations described in these analytical reviews. Sincerely, The RoboForex Team
-
I think it's worth a try; this one presents a very robust rationale....
-
⭐ ralph kabota reacted to a post in a topic:
AFLWiz.exe for Amibroker registration.
-
Bump
-
Omg my buddy made one like a year ago. In this market it wont do good
-
Ze_Pequeno reacted to a post in a topic:
Grid BOT need EDU
-
Ze_Pequeno reacted to a post in a topic:
Grid BOT need EDU
-
Puzzle reacted to a post in a topic:
AFLWiz.exe for Amibroker registration.
-
Help us @apmoo @kimsam @Minigemas
-
yc1 reacted to a post in a topic:
AFLWiz.exe for Amibroker registration.
-
https://www.mooretechllc.com/ninjatrader-downloads/grid-master-ninjatrader-add-on/ Hello! Please help us unlock this system, thank you. GridMaster202.zip
-
AFLWiz.exe registration. Apply user name and key in the file reg.txt. https://workupload.com/file/GF3PKp34q7p Thank you to shb.
-
- 4
-
-
-

HFMarkets (hfm.com): Market analysis services.
AllForexnews replied to AllForexnews's topic in Fundamental Analysis
Date: 14th April 2026. Markets Rally on Fragile US-Iran Peace Hopes as Oil Volatility Signals Ongoing Risk. Global financial markets are once again being driven by geopolitics, as the conflict involving the United States, Iran, and Israel enters its seventh week. Despite a clear escalation, including a US naval blockade of the Strait of Hormuz, investor sentiment has turned surprisingly optimistic. This has created a notable divergence across asset classes, where equities are rallying on hopes of diplomacy, while energy markets continue to reflect real supply risks. Equities Rally as Markets Look Beyond the Conflict US equity futures remained relatively stable following a strong rally, with the broader market showing clear resilience. Most notably, the S&P 500 has now erased all losses triggered by the Iran conflict, signalling a shift in investor mindset. This move comes despite failed negotiations over the weekend. Instead of reacting to the breakdown in talks, markets are focusing on forward-looking signals. US President Donald Trump stated that Iran had reached out to negotiate, while Tehran confirmed its willingness to continue discussions under international frameworks. The key driver is simple: markets are pricing the probability of a diplomatic resolution rather than the current escalation. Oil Remains the Pressure Point Energy markets are telling a more cautious story. Oil prices initially surged following the US decision to impose a blockade, reflecting immediate concerns over supply disruptions. West Texas Intermediate approached $99 per barrel Brent Crude briefly traded above $99 Prices later pulled back toward the mid-$90s range as optimism around renewed talks emerged. However, the underlying risks have not disappeared. The Strait of Hormuz remains one of the world’s most critical energy chokepoints, and any sustained disruption continues to threaten global supply. This explains why fuel prices are already rising sharply across major economies, even as headline oil prices fluctuate. Inflation and Central Bank Caution The surge in energy costs is beginning to filter into inflation data. US price growth accelerated in March, largely driven by higher oil and gas prices, although core inflation remained relatively stable. US Treasury Secretary Scott Bessent emphasised that the Federal Reserve should remain patient. Policymakers are adopting a “wait and see” approach as they assess whether energy-driven inflation will persist or fade. This places central banks in a delicate position, balancing: Slowing global growth due to geopolitical uncertainty Rising energy-driven inflation pressures Market expectations for eventual rate cuts Bitcoin Follows Risk Sentiment Cryptocurrencies are once again behaving like traditional risk assets. Bitcoin climbed to a four-week high near $75,000, while Ethereum posted strong gains. The move reflects improving sentiment across broader markets rather than safe-haven demand. In fact, Bitcoin has outperformed many traditional assets since the conflict began, reinforcing its growing correlation with equities. Bonds Signal Underlying Caution While equities are rallying, bond markets continue to reflect a more cautious outlook. Strong demand for long-term government bonds, particularly in Japan, highlights ongoing uncertainty around the economic impact of the conflict. Yields have edged lower as investors position for: Potential slowing of growth Controlled inflation over the medium term A more cautious approach from central banks This divergence between equities and bonds suggests that markets are not fully aligned on the outlook. Commodities and Credit Markets Rebound Industrial metals have moved higher, supported by optimism that tensions may ease and economic activity will stabilise.Copper and aluminium prices have both advanced, reflecting improved sentiment. At the same time, global credit markets are showing signs of recovery. Borrowers, particularly in Asia, are returning to debt markets after weeks of subdued activity, taking advantage of a temporary window of stability. Bond issuance activity is at its busiest in over three months Credit spreads are tightening, signalling improving investor confidence A Market Driven by Expectations, Not Reality At the centre of the current market dynamic is a clear disconnect. Geopolitical risks remain elevated, yet financial markets are increasingly focused on the potential for de-escalation. The US blockade of the Strait of Hormuz is a significant escalation, designed to increase pressure on Iran. However, markets are also interpreting it as a strategic move to force negotiations rather than prolong the conflict. This explains why risk assets continue to rise even as tensions remain unresolved. What Comes Next Markets are now entering a phase where short-term direction will be dictated by headlines rather than fundamentals. Key areas to watch include: Progress in US-Iran negotiations Oil price stability and supply flows through the Strait of Hormuz Corporate earnings from major banks such as JPMorgan Chase and Morgan Stanley Signals from central banks regarding interest rate policy Final Thoughts Financial markets are currently pricing in a scenario where diplomacy ultimately prevails. However, this optimism remains fragile and highly sensitive to developments on the ground. As long as the Strait of Hormuz remains under pressure and negotiations are uncertain, volatility is likely to persist across all major asset classes. The current environment highlights a key reality: markets are not reacting to what is happening now; they are reacting to what they believe will happen next. Always trade with strict risk management. Your capital is the single most important aspect of your trading business. Please note that times displayed based on local time zone and are from time of writing this report. Click HERE to access the full HFM Economic calendar. Want to learn to trade and analyse the markets? Join our webinars and get analysis and trading ideas combined with better understanding of how markets work. Click HERE to register for FREE! Click HERE to READ more Market news. Andria Pichidi HFMarkets Disclaimer: This material is provided as a general marketing communication for information purposes only and does not constitute an independent investment research. Nothing in this communication contains, or should be considered as containing, an investment advice or an investment recommendation or a solicitation for the purpose of buying or selling of any financial instrument. All information provided is gathered from reputable sources and any information containing an indication of past performance is not a guarantee or reliable indicator of future performance. Users acknowledge that any investment in Leveraged Products is characterized by a certain degree of uncertainty and that any investment of this nature involves a high level of risk for which the users are solely responsible and liable. We assume no liability for any loss arising from any investment made based on the information provided in this communication. This communication must not be reproduced or further distributed without our prior written permission. -
⭐ ajeet reacted to a post in a topic:
Algobox pro latest version
-
babeonidi reacted to a post in a topic:
Elliott Wave for Amibroker 64 bit.
-
Did you try the VWAPAddOn one? Or, one from Ninza?
-
There are a whole lots of these out there, same thing, why dont you use them so you aren't bothered by that logo? Pretty much all the edu and fixed and posted indicator packages, somewhat come with this same VWAP indicator. BTW, did you look in its setting and see if it has an option, a box to check or uncheck for logo to appear or disappear? Many indicators have this option in their settings.
-
Thank you.
-
Latest disco pub🤗
-

automated-trading ICT Concepts Indicator[Advanced] Ver 1.5.0.2
Ninja_On_The_Roof replied to nanop's topic in Ninja Trader 8
Didn't the folks at LuxAlgo already make all these? BTW, these files above are not yet fixed or educated. You would have a message popping up on the bottom left corner asking for license. -
Here they are. That is all I have. For now. Once again, these are not typical templates that you would copy and paste into your NT8 Template folder. If you do that, you won't see them. Gotta import them via your Fusion control panel. Then you will see them in the box. Click whichever one you need but gotta close down the box right after, come back in then you will see your chosen template in the upper right corner. https://limewire.com/d/Wmb7F#dvD1uhn646 Dont waste too much of your energy, precious time on this Fusion stuff. You probably will have more success with just 2 moving averages cross.🤗 Anybody who has success with this Fusion or the Analyzer, please do come out and raise your hands🤪Let us know how you have managed to pull in profits each trading day.
-
Thanks sir
-
⭐ option trader reacted to a post in a topic:
Elliott Wave for Amibroker 64 bit.
-
I didnt mean to discourage anyone but that was just my own view. I mean, even if you have a bunch of great indicators or strats or bots but if your main platform is crappy, frozen on you left and right or, your connection also is unreliable, dropped off on you in the middle of your trading...Or during or any moments for that matter. Then it is all a big disaster and disappointment for you. Not to mention, losing your hard earned money. In trading, accuracy & fast execution is very crucial. It is truly a matter of winning or losing even. In... mili-seconds.
-
our pride RE's & somebodys will look into it,
-
h**ps://w*w.mediafire.com/file/38fzipnnqsoevoh/E_W.rar/file
-
please upload in other uploading site,
-
@N9T can you please re-upload the edu version. Old link is dead.
-
Pivot_Point_STRAT proptradingindicatorscom
Ninja_On_The_Roof replied to TRADER's topic in Ninja Trader 8
So what is the difference? Despite all the hypes. Out of curiosity, I put in the Supertrend, the Ninza Nova RK, a bit of a tweak of the ATR numbers on the chart with this Pivot Point thingie, they are all the same to me. Nova shows where the Trend starts with the "Trend" signals. The Supertrend also shows the same spots. As for the Pivot Point, the same as well. Changes green, changes red, where Nova and ST appear. -

NQ Ultra - Futures Trading Bot // https://tradegreater.com/
TickHunter replied to luludulu's topic in Ninja Trader 8
Latest version, needs EDU. @Minigems https://workupload.com/file/ReNTWvwkDWy