

⤴️-Paid Ad- Check advertising disclaimer here. Add your banner here.🔥
All Activity
- Past hour
-
 Sergiy23 reacted to a post in a topic:
Timingsolution & Nifty Updates - 3
Sergiy23 reacted to a post in a topic:
Timingsolution & Nifty Updates - 3
- Today
-
Welcome to Indo-Investasi.com. Please feel free to browse around and get to know the others. If you have any questions please don't hesitate to ask.
-
 The AI race is going into debt: the market starts counting the cost The US stock market remains close to record levels, but one of its key growth drivers is beginning to create a new problem. The massive construction of data centers and purchases of artificial intelligence equipment are increasingly being financed not with companies’ available cash, but through new borrowing. In the current session, #NQ100 is trading around 31,118 points, following a recent rise above 31,200, while #SP500 is trading near 7,794 points, retreating from levels above 7,830. So far, the move looks more like a minor correction after a strong rally. However, the increase in corporate debt has coincided with US Treasury yields remaining near multi-year highs. Want to protect yourself from a stop-out? If you lose your deposit, FreshForex will compensate 50% of your insured funds! Learn more $25 for a risk-free start! Register, complete verification, enter promo code INDOINVEST10 in your Personal Area, and get a trading bonus with no deposit required. Why Is AI Becoming More Expensive? Technology companies are increasingly borrowing money. Over the past year, Alphabet, Amazon, Meta, Microsoft, and Oracle have issued around $220 billion in bonds, directing a significant portion of the capital toward data centers, computing capacity, and other AI infrastructure. Debt is starting to compete for investors’ money. At the same time, the US government is issuing huge amounts of debt. The more new securities enter the market, the higher the yields that need to be offered to investors, making it more expensive to finance further growth. High yields are already weighing on stock indices. Rising borrowing costs are particularly sensitive for technology companies, whose valuations are largely based on future earnings. As a result, #NQ100 is becoming increasingly dependent on whether the debt market can stabilize. #Oracle Shows the Other Side of the AI Boom Oracle (#Oracle) is a good example of how the market has started to assess not only the prospects of artificial intelligence, but also the cost of financing them. The company is aggressively expanding its cloud infrastructure and data centers, but this requires it to significantly increase borrowing and long-term financial obligations. At the beginning of September, #Oracle shares rose above $165, before pulling back and now trading at around $143.59. This means that despite strong demand for computing capacity, the stock is approximately 13–14% below its recent high. For traders, this is a telling signal: the market is no longer willing to automatically reward every new AI investment if it comes with rapidly rising debt. The situation becomes particularly important against the backdrop of high interest rates. The yield on 10-year US government bonds remains above 5%, while the technology sector’s enormous capital requirements are putting additional pressure on financing costs. According to FreshForex analysts, in the short term, increased pressure on US indices is more likely than another rapid move higher. #NQ100 has so far failed to firmly break above the 31,200–31,300 area, while #SP500 has retreated from levels above 7,830. If borrowing costs continue to rise, #NQ100 could correct toward 30,700–30,900, while #SP500 could move toward 7,700–7,750. The performance of #Oracle around $143.59 further shows that investors are already becoming more selective when it comes to companies financing their AI expansion through debt. Our trading terminal offers 250+ instruments, including CFDs on stocks, indices, and crypto assets. Follow the trends and seize the opportunities! Profit from the AI race
 -
 NARAYNA118 joined the community
 -

roboforex Market Fundamental Analysis by RoboForex
RBFX Support replied to RBFX Support's topic in Fundamental Analysis
US Tech rises as expectations of a Federal Reserve rate hike decline The US Tech index maintains its upward momentum, supported by declining expectations of a Federal Reserve rate hike. The price currently stands at 31,016. US Tech forecast: key takeaways The yield on 30-year US Treasuries reached 5.618%, the highest level since 2000 The US services PMI stood at 58.8 Fundamental analysis The published services PMI data indicates that the US economy continues to expand at a strong pace. The actual reading came in at 58.8 points versus the forecast of 58.7 points and the same reading in the previous period. The index remains well above the 50-point threshold that separates expansion in economic activity from contraction. Yesterday, the US Treasury placed 30-year Treasury bonds worth a total of 22 billion USD. The auction yield reached 5.618%, the highest level since August 2000. RoboForex Market Analysis & Forex Forecasts Attention! Forecasts presented in this section only reflect the author’s private opinion and should not be considered as guidance for trading. RoboForex bears no responsibility for trading results based on trading recommendations described in these analytical reviews. Sincerely, The RoboForex Team -

HFMarkets (hfm.com): Market analysis services.
AllForexnews replied to AllForexnews's topic in Fundamental Analysis
[B]Date: 9th October 2026.[/B] [B]Gold and S&P 500 Rebound: Can the Rally Continue?[/B] The market risk appetite is improving on Friday as President Trump indicates that the US will not strike Iran before the midterms. The US blockade of the Strait of Hormuz will remain intact but the US military is likely to remain inactive unless serious threats arise. Political experts say the White House will look to lower oil prices as the US midterms approach. This would be three weeks of possible calm in the Middle East. As a result, oil prices, along with bond yields, are falling slightly, allowing for ‘risk-on’ market conditions. The best-performing assets of the day are currently metals and the stock market. In addition, a key factor is earnings season, which is only a few days away. Earnings Season - OpenAI Eyes $70 Billion in Revenue by Year End The quarter’s earnings season will start on Tuesday 13 October, with major US banks and the healthcare sector announcing their reports. On Tuesday, JPMorgan, Goldman Sachs, Johnson & Johnson, and UnitedHealth Group will make their third-quarter reports public. The release will mainly impact the S&P 500 and Dow Jones, but could also affect other stocks. The S&P 500 and Dow Jones are more exposed to these sectors, but the results can impact investor sentiment in general. As a result, all global indices could experience volatility and new trends. The technology sector will start releasing quarterly earnings reports on October 21 October with Tesla and Lam Research Corporation. The three main US indices, the NASDAQ, S&P 500, and Dow Jones have struggled in the past two days, but are quickly rebounding as earnings expectations boost demand. Of particular interest are OpenAI’s latest statements regarding its revenue expectations. OpenAI expects its annualised revenue to reach or exceed $70 billion this year, compared with approximately $50 billion at the end of September. The change represents a potential 40% increase. This growth is expected to be driven primarily by rising demand for its enterprise AI services as businesses increasingly adopt artificial intelligence. The company is also reportedly seeking to raise $30 billion in new funding at a valuation of $1.4 trillion. The announcement follows concerns over OpenAI’s revenue figures, which contributed to selling pressure across technology and AI-related stocks. Despite these concerns, the latest projections highlight the rapid expansion of the AI industry and its growing importance to investor sentiment. S&P 500 Rebounds As Earnings Edge Closer The S&P 500 is trading close to 0.30% higher during this morning’s Asian session, but is still forming lower lows and lower highs. For this reason, investors will be cautious about the index’s direction and market signals. Currently, all indices are trading higher with the Nikkei 225 and NASDAQ seeing the strongest gains, while the Dow Jones is recording the weakest increase. The fact that gains can be seen across all global indices remains a positive indication. The VIX Index is trading 1.30% lower, while index components are trading higher in pre-market trading. These factors indicate a possible rebound, however, the put-call ratio and McClellan Volume Summation Index are indicating weakness in market demand. For this reason, the short-term indications remain positive, but medium-term risks remain. The medium-term outlook will also largely depend on earnings reports. If earnings fail to impress, the index could fall, particularly as its trading very close to all-time highs. HFM - S&P 500 15-Minutes Charts In the 5-minute timeframe, the price is trading above the VWAP and the moving average. This is providing a bullish indication, however, if the price falls below $7,781.50, these signals will fade. Gold Rebounds, but Will It Be Limited? Gold is seeing a strong rebound after declining on Wednesday to the lowest price since 4 August. Slightly lower bond yields and weaker US Dollar are allowing Gold to rise. However, investors should note that both the Dollar and bond yields remain extremely high, which may limit the bullish trend unless market conditions change. According to the September FOMC minutes published yesterday, all 19 Fed policymakers supported an interest rate increase, with over 60% anticipating another hike this year. The probability of a year-end hike reached 69.3%, its highest level this year. The likelihood of rates remaining unchanged in October stands at 81.2%. However, most economists believe nothing has changed in the longer-term interest-rate outlook. As the price rose 2% on Friday, Gold is now trading at a key resistance level. However, as Gold rises, the US Dollar Index is not continuing to fall. If the US Dollar Index remains above 101.80, Gold may struggle to continue the current trend. HFM - Gold 15-Minute Chart Key Takeaways: Reduced geopolitical tensions in the Middle East, alongside lower oil prices and bond yields, are supporting risk appetite. Major US banks and healthcare companies begin reporting on 13 October, with results expected to influence broader market sentiment. Global indices are recovering, supported by earnings expectations and OpenAI’s projected $70 billion annualised revenue. However, medium-term risks remain. Gold is rising 2% as bond yields and the US Dollar weaken. However, expectations of another Fed rate hike and key technical resistance could limit further gains. [B]Always trade with strict risk management. Your capital is the single most important aspect of your trading business.[/B] [B]Please note that times displayed based on local time zone and are from time of writing this report.[/B] Click [URL='https://www.hfm.com/hf/en/trading-tools/economic-calendar.html'][B]HERE[/B][/URL] to access the full HFM Economic calendar. Want to learn to trade and analyse the markets? Join our webinars and get analysis and trading ideas combined with better understanding of how markets work. Click [URL='https://www.hfm.com/en/trading-tools/trading-webinars.html'][B]HERE[/B][/URL] to register for FREE! [URL='https://analysis.hfm.com/'][B]Click HERE to READ more Market news.[/B][/URL] [B]Michalis Efthymiou HFMarkets[/B] [B]Disclaimer:[/B] This material is provided as a general marketing communication for information purposes only and does not constitute an independent investment research. Nothing in this communication contains, or should be considered as containing, an investment advice or an investment recommendation or a solicitation for the purpose of buying or selling of any financial instrument. All information provided is gathered from reputable sources and any information containing an indication of past performance is not a guarantee or reliable indicator of future performance. Users acknowledge that any investment in Leveraged Products is characterized by a certain degree of uncertainty and that any investment of this nature involves a high level of risk for which the users are solely responsible and liable. We assume no liability for any loss arising from any investment made based on the information provided in this communication. This communication must not be reproduced or further distributed without our prior written permission. -

VIP Membership - FREE upgrade for OLD and ACTIVE Members
TraderRazorsEdge replied to MrAdmin's topic in Announcements
Thanks for this great community! -
Market Technical Analysis by RoboForex
RBFX Support replied to RBFX Support's topic in Technical Analysis
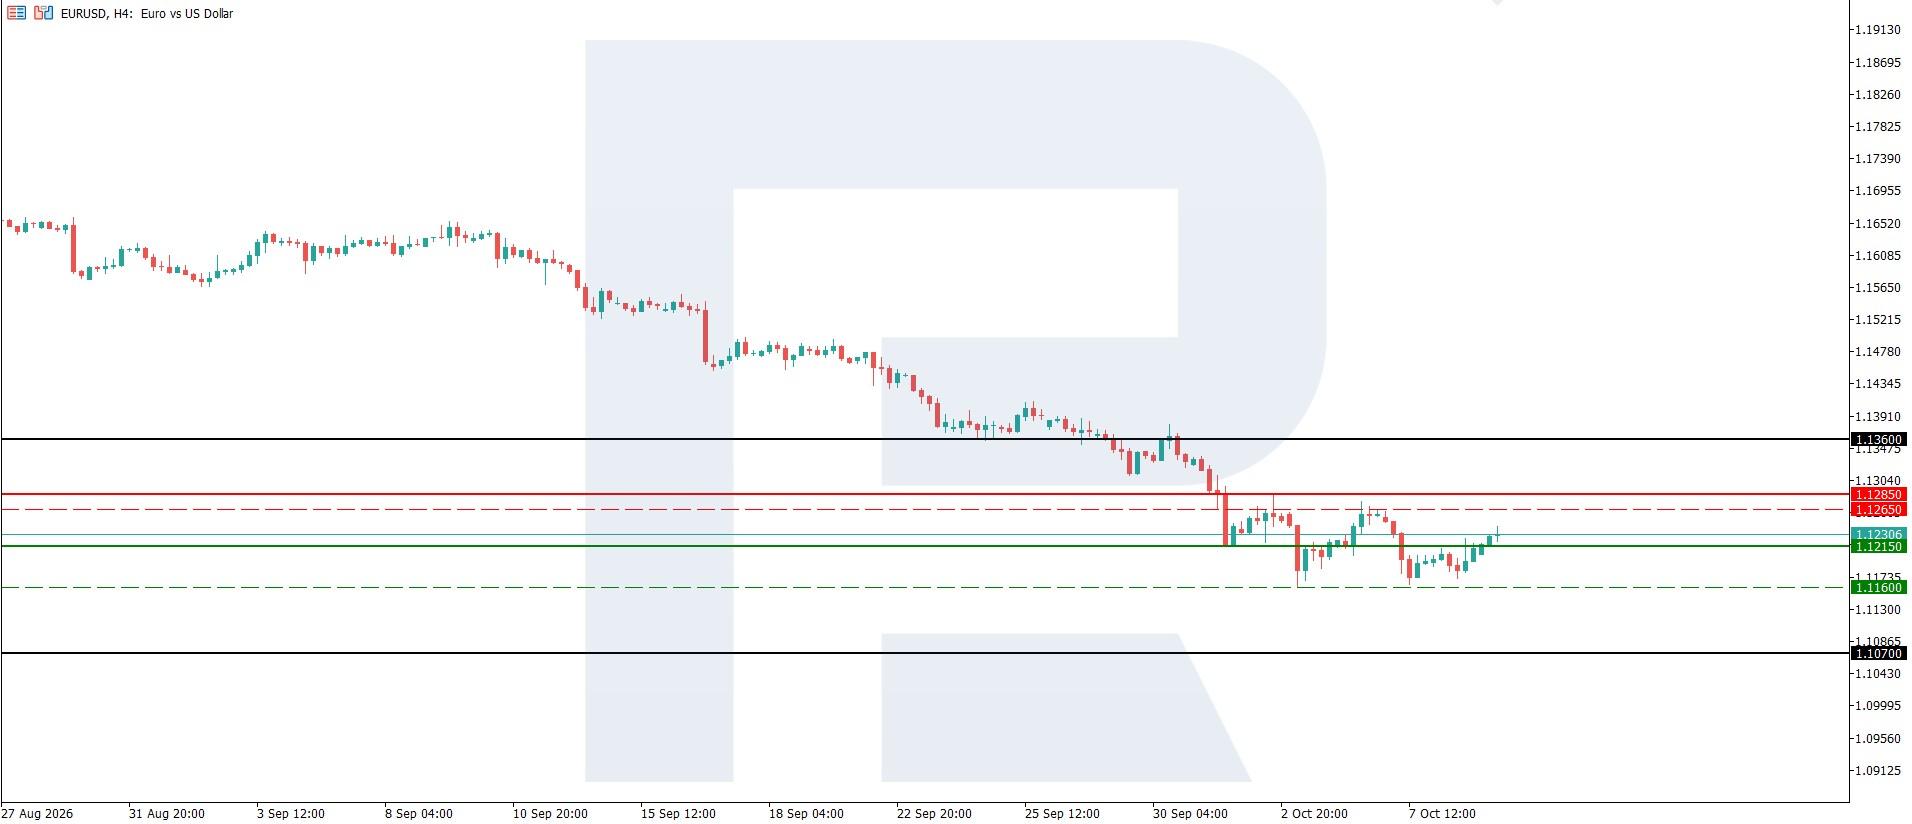
EURUSD stabilises as US bond yields hit new highs and problems in France and Germany intensify The euro has stabilised, with a sideways trend forming ahead of a further decline. The EURUSD rate is currently trading at 1.1230. Technical outlook On the H4 chart, the EURUSD pair maintains a downward trajectory. The nearest support level has formed at 1.1160, while key resistance lies around 1.1265. On the daily D1 timeframe, the technical picture also indicates prevailing bearish sentiment. The fundamental outlook for the EURUSD pair remains predominantly bearish. Read more - EURUSD Forecast Attention! Forecasts presented in this section only reflect the author’s private opinion and should not be considered as guidance for trading. RoboForex bears no responsibility for trading results based on trading recommendations described in these analytical reviews. Sincerely, The RoboForex Team
-
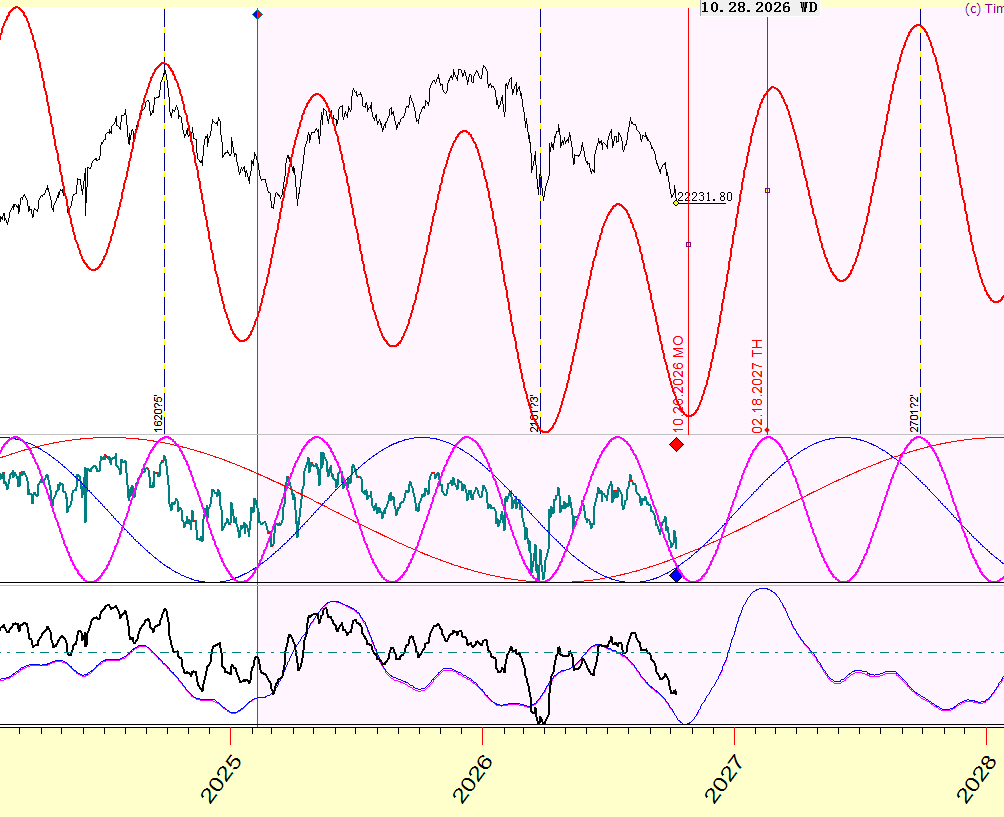
which cycle analysis do you use in this graph?
-
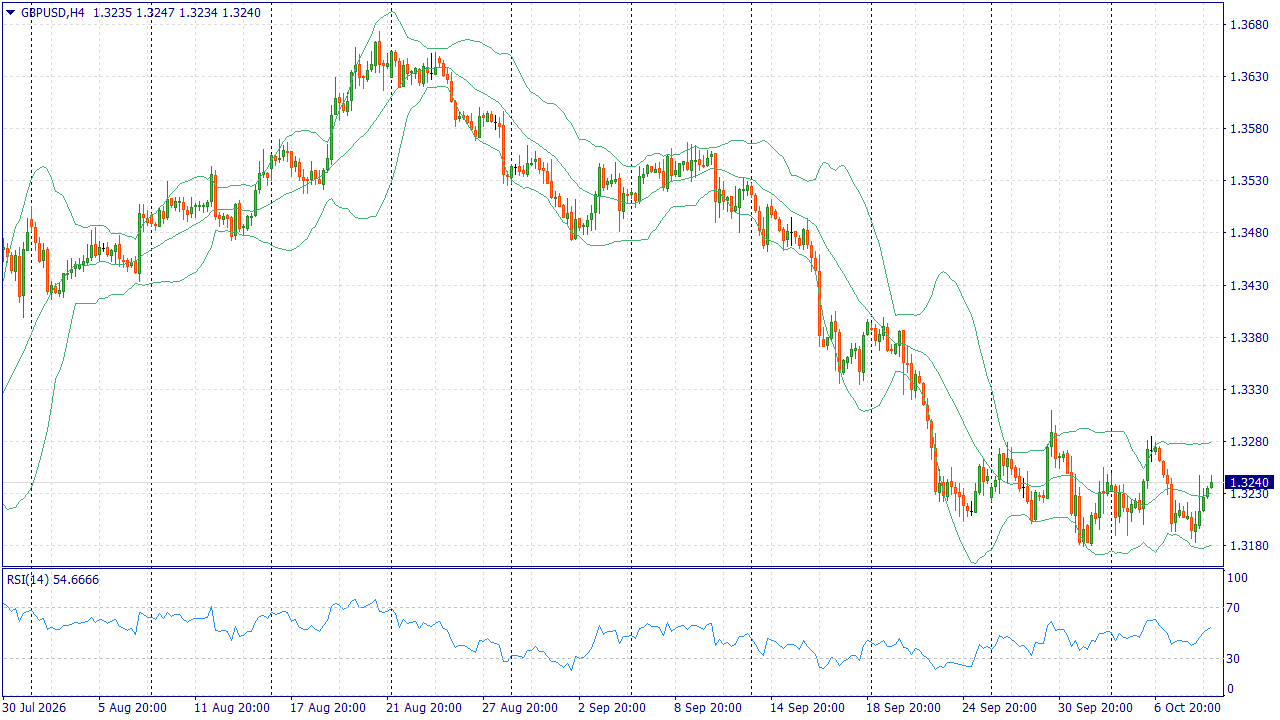
Fundamental Market Analysis for October 9, 2026 GBPUSD 17:30 EET. USD - University of Michigan Consumer Sentiment Index GBPUSD: $25 for a risk-free start! Register, complete verification, enter promo code INDOINVEST10 in your Personal Area, and get a trading bonus with no deposit required. The Bank of England remains focused on inflation: yesterday, Chief Economist Hugh Pill emphasized the need to curb price growth. At the September meeting, he and two other participants advocated for a rate hike. For the pound, this supports expectations of policy tightening, although the majority's decision to hold rates shows that the next step is not yet predetermined. UK budgetary risks limit the strength of this argument. Andrew Bailey highlighted the importance of credible fiscal policy amid stress in debt markets. Rising bond yields may reflect an increased risk premium rather than improved prospects for the pound. Therefore, confidence in funding government spending is crucial for sustained currency growth. In the current session, the pound is aided by a slowdown in dollar strengthening as US yields decline. The University of Michigan report could amplify this effect if it confirms deteriorating consumer sentiment. Conversely, a strong result alongside rising inflation expectations would support the dollar. With the US interest rate momentum weakening, BoE expectations provide grounds for moderate GBPUSD growth. Trading idea: BUY 1.3240, SL 1.3210, TP 1.3315 Our company provides the opportunity to earn income not only from your trading. By attracting clients within the affiliate program, you can earn up to $30 per lot! You can find more analytical information on our website.
-
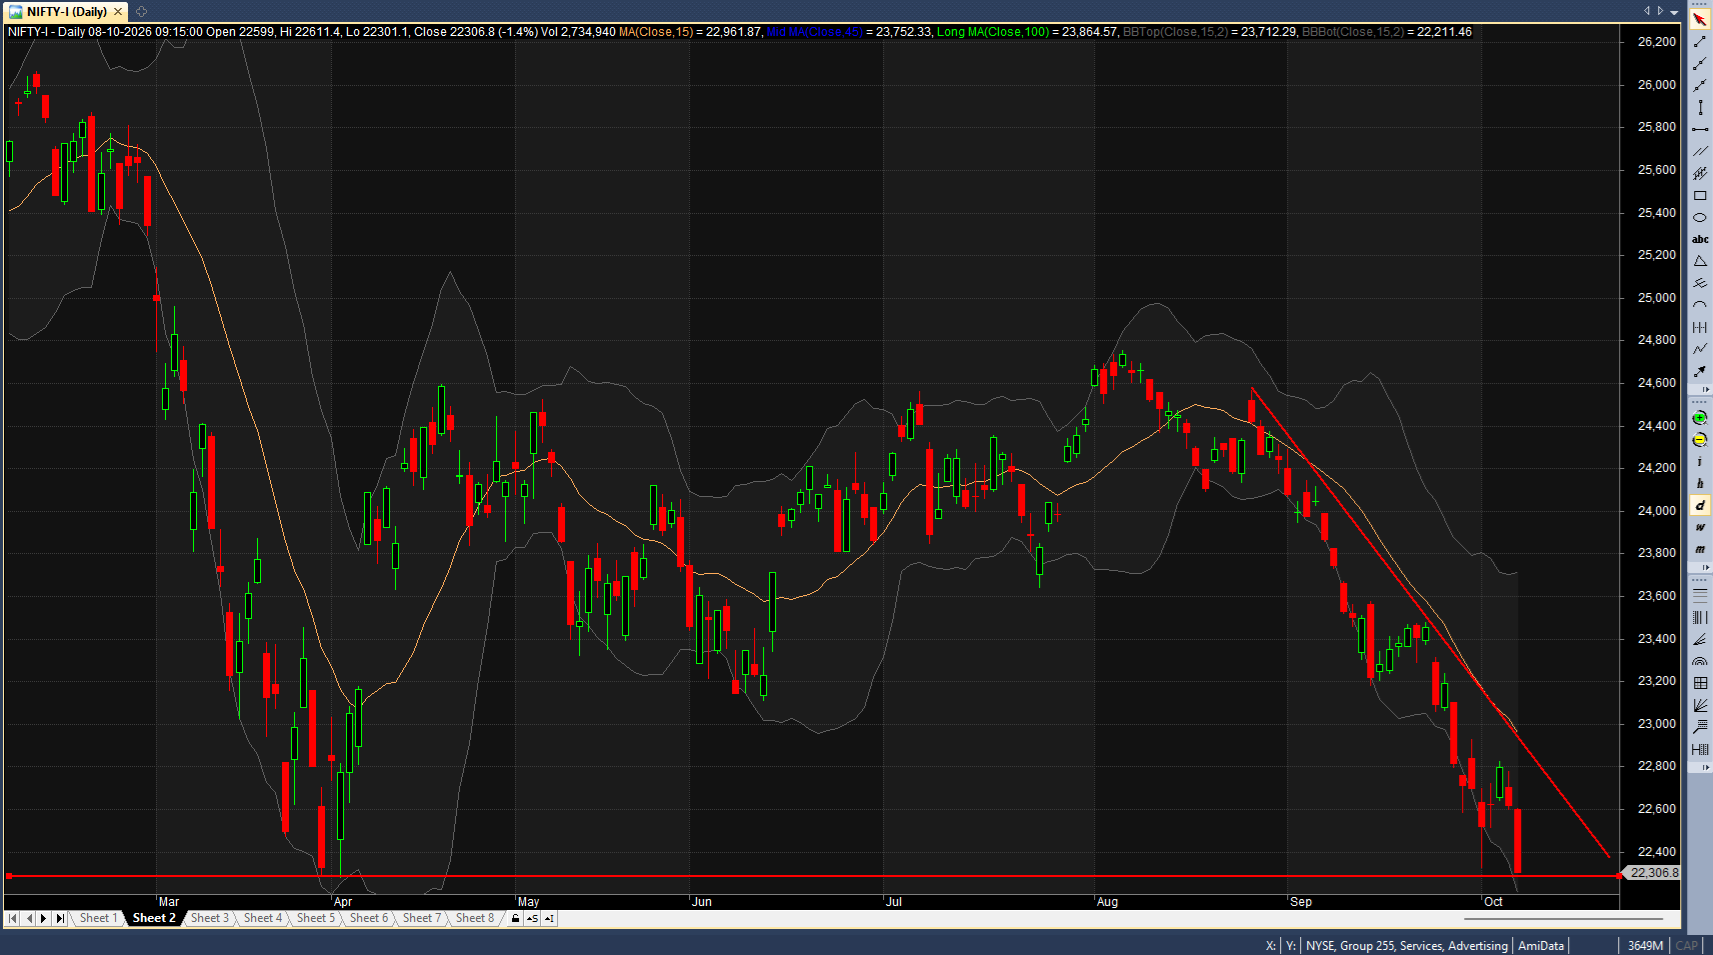
I don't trade Nifty; I just did a quick analysis
-
 sotona joined the community
 - Yesterday
-
I don't trade Nifty and this is the first time I am seeing a Nifty chart. A little surprised that it has many price gaps. I have traded Chart Patterns about 15 years ago and was only mildly successful. But this chart is interesting. Here are my comments purely from a Chart Pattern trading point of view. PLEASE NOTE THAT I AM NOT AN EXPERT NOR DO I CLAIM TO BE. THE FOLLOWING ARE JUST MY COMMENTS. The Double Bottom (DB) is still in a pending state as the price can go down further although it appears to have reached a S&D zone. It is a M shaped DB instead of a W shaped DB. Increases the possibilities of some Harmonic Patterns forming that will provide some confluence for the turning point. If the price does go down lower than the left trough and then goes up again and then form another pivot, it shows possibility of stop loss and sell stop hunting. (liquidity sweep?). This shows the possibility of Smart Money is in play and increases the possibility of Smart Money will bring the price up. The last downward wave shows a possible Elliott Wave 5 wave Impulse. Wave 5 of this 5 wave Impulse also shows that it has its internal 5 wave near completion (5 wave of 5). To test the completion of Wave 5, you can check (using the daily chart) if there is a divergence between price and indicator, possibly using an ElliottWave Osc or any Oscillator ie Stochastic. Because of the existence of this 5 wave Impulse wave, it might be preferable to trade from a Elliott Wave methodology while having the knowledge that Double Bottom is providing some support to the price movement. If Harmonic pattern is also detected, it increases the potential of a possible reversal. If Wave 5 is deemed to have completed (via a divergence), trader may choose to enter (per AdancedGET style), a Linear Regression channel is plotted for the last wave. Enter when price crosses over the Linear Regression upper band. To find tune entry, go to the H4 or H1 to enter. This reduces the risk and increase the R:R SL is set as below the trough and 1xR is calculated from SL to Entry (on Daily chart). Money and risk management is dependent of the trader's personal preference.
-
Welcome to Indo-Investasi.com. Please feel free to browse around and get to know the others. If you have any questions please don't hesitate to ask.
-
Welcome to Indo-Investasi.com. Please feel free to browse around and get to know the others. If you have any questions please don't hesitate to ask.
-
 quantinsider joined the community
 -
 Fsampaio joined the community
 -
 DaBuyShallBuy joined the community
 -
HFMarkets (hfm.com): Market analysis services.
AllForexnews replied to AllForexnews's topic in Fundamental Analysis
[B]Date: 8th October 2026.[/B] [B]Stock Market Today: German Exports Drop, Oil Tops $102[/B] Key takeaways German exports unexpectedly fell 0.8% in August, with shipments to the US down 6.3%. Brent crude jumped above $102 on reports of possible US strikes on Iran and Hurricane Isaias. Fed minutes show most officials expect another rate hike before year-end. The 10-year Treasury yield hit 5.36%, its highest since 2002. Asian stocks fell across the board after the S&P 500 slipped from its record. Global stocks slipped further from their record highs on Thursday, October 8, 2026, as oil prices jumped above $102 a barrel, Federal Reserve minutes pointed to another rate hike this year, and fresh data showed German exports unexpectedly shrinking in August. The pullback began on Wall Street on Wednesday, when the S&P 500 fell 0.2% a day after closing at an all-time high. Thursday's oil spike, driven by a report that the White House is weighing new strikes on Iran, revived inflation fears and kept the 10-year Treasury yield near its highest level since 2002. In Europe, a surprise drop in German exports, led by a sharp fall in shipments to the United States, added to concerns about the region's growth as the euro hovers near its weakest level in over a year. German Exports Fall Unexpectedly as US Shipments Drop 6.3% German exports fell 0.8% in August compared with July, according to data released Thursday by Germany's federal statistics office, Destatis. Economists polled by Reuters had expected a 0.6% increase, making the miss a notable setback for Europe's largest economy. The biggest drag came from the United States, Germany's most important export market. Shipments to the US fell 6.3% from the previous month. Exports to other EU countries slipped 0.6%, while sales to countries outside the EU declined 1.1%. There were some bright spots. Exports to the United Kingdom jumped 16.7%, and shipments to China rose 4.7%. However, imports from China surged 11%, far outpacing export growth. Overall imports rose 0.9% on a calendar- and seasonally adjusted basis. As a result, Germany's trade surplus narrowed to €19.5 billion ($21.82 billion) in August from €21.6 billion in July. The data adds to pressure on an economy already facing a European energy shock, rising borrowing costs and fiscal stress in neighboring France. A weaker euro would normally help German exporters, but August's figures suggest that soft demand in the US is outweighing any currency advantage for now. Oil Prices Jump Above $102 on Iran Strike Report and Hurricane Isaias Brent crude climbed more than 2% early Thursday to around $102.50 a barrel, while US benchmark West Texas Intermediate rose to about $90. Both benchmarks reversed the declines seen earlier in the week, when signs of recovering Middle East exports and coordinated G7 stock releases had eased supply worries. The main trigger was a report by The Atlantic, citing unnamed officials, that the White House asked the Pentagon to prepare options for strikes on Iranian targets ahead of the November 3 US midterm elections. According to the report, the scope of the strikes is still under discussion, and a larger operation could follow the vote. Several other supply risks added to the move: Tanker attacks: Iran has stepped up strikes on vessels in the Strait of Hormuz. Houthis: Yemen's Houthis denied reports that they had lost key territory. Hurricane Isaias: More than 500,000 barrels a day of Gulf of Mexico output has been shut ahead of the storm. Low inventories: Saudi Aramco warned that global oil stocks are dangerously low and could take two years to rebuild. On the policy side, the International Energy Agency said its members back faster releases of the emergency stocks pledged in March, prioritizing diesel where possible. Fed Minutes Signal Another Rate Hike; 10-Year Yield Near 2002 High Minutes from the Federal Reserve's September meeting, released Wednesday, showed that all 19 officials supported last month's quarter-point hike, which lifted the federal funds rate to a range of 3.75% to 4% and was the Fed's first increase since July 2023. Most officials also judged that another hike would likely be appropriate before the end of the year, with many citing the risk of building price pressures. Analysts said the minutes made a further move hard to dismiss, even if the Fed waits for more data first. Adding to the concern, the New York Fed reported that consumers' one-year inflation expectations have climbed to a three-year high. The 10-year Treasury yield touched about 5.36% on Wednesday, its highest since 2002, before easing after solid demand at a $39 billion 10-year note auction.It closed near 5.28% and was trading around 5.31% to 5.32% on Thursday. A 30-year bond auction later today will provide another test of investor appetite for long-dated US debt. Bank of America strategist Savita Subramanian noted that, for the first time in decades, bonds now offer genuine competition for equities. She also warned that elevated investor optimism leaves stocks more vulnerable to disappointment. Wall Street Retreats From Records; Asian Stocks Fall Across the Board On Wednesday, the S&P 500 and Nasdaq both slipped 0.2% from their record highs, while the Dow Jones Industrial Average fell 0.7%. The MSCI World Index lost 0.5%. Tech shares cooled ahead of next week's earnings season, as investors focus on whether massive AI spending will justify high valuations. Asian markets followed Wall Street lower on Thursday, with declines in nearly every major market: Japan: The Nikkei 225 fell 0.9% to 69,438.77, slipping back below 70,000. South Korea: The Kospi lost 0.8% to 6,750.25. Hong Kong: The Hang Seng dipped 0.2% to 24,072.98. China: The Shanghai Composite edged down 0.1% to 3,840.03 as mainland markets reopened after the holiday. Australia: The S&P/ASX 200 fell 0.6% to 8,677.20. Taiwan: The Taiex dropped 0.7%. Samsung Electronics shares fell even after the company estimated a 782.5% surge in third-quarter operating profit to 107.4 trillion won, driven by higher memory chip prices. The reaction suggests that much of the good news was already priced in. US stock futures were mixed. Euro Near 16-Month Low as France's Fiscal Worries Linger The euro fell 0.6% on Wednesday to about $1.1194 and was trading near $1.12 on Thursday, close to its weakest level since mid-2025. Pressure is coming from France, where worries about high debt and deficits have pushed the 10-year bond yield to around 4.89%, compared with 3.48% for Germany. Investors have also built up record bets against the single currency. France's finance ministry said it will not change its bond-issuance strategy. The UK was not spared either. Britain's 10-year gilt yield rose 7 basis points to 5.44%, and the pound slipped to about $1.32. The dollar strengthened, with the Bloomberg Dollar Spot Index up 0.3% on Wednesday, while the yen held around 158 per dollar. In other assets, gold fell 1.4% on Wednesday to about $4,104 an ounce before recovering to around $4,144 on Thursday. Bitcoin dropped 2.5% to roughly $83,460, and ether fell 4.6% to about $2,574. Corporate News: Deere Slides, SpaceX Debt Talks, Wells Fargo Probe Shares of Deere & Co. and other farm-equipment makers fell after the Federal Trade Commission and the US Department of Agriculture launched an inquiry into industry practices, including possible anti-competitive behavior. SpaceX is in talks with banks and investors to raise $40 billion to buy Nvidia chips, which would rank among the largest debt deals tied to the AI buildout. Microsoft revealed pricing for a new flagship laptop powered by Nvidia chips, claiming it beats a comparable Apple model on certain AI tasks. Wells Fargo is under investigation by the Department of Housing and Urban Development over whether it broke fair-lending laws in a program aimed at boosting homeownership among Black Americans. In a separate incident, China reportedly obtained F-35 fighter jet parts after a UPS employee missed an email warning not to route the shipment through Hong Kong. What to Watch Today Investors will focus on today's 30-year Treasury auction, any further news on possible US action against Iran, and the path of Hurricane Isaias through the Gulf of Mexico. With oil above $102, yields near 24-year highs and the Fed leaning toward another hike, the stock market's record run faces its toughest test yet just days before third-quarter earnings season begins. [B]Always trade with strict risk management. Your capital is the single most important aspect of your trading business.[/B] [B]Please note that times displayed based on local time zone and are from time of writing this report.[/B] Click [URL='https://www.hfm.com/hf/en/trading-tools/economic-calendar.html'][B]HERE[/B][/URL] to access the full HFM Economic calendar. Want to learn to trade and analyse the markets? Join our webinars and get analysis and trading ideas combined with better understanding of how markets work. Click [URL='https://www.hfm.com/en/trading-tools/trading-webinars.html'][B]HERE[/B][/URL] to register for FREE! [URL='https://analysis.hfm.com/'][B]Click HERE to READ more Market news.[/B][/URL] [B]Andria Pichidi HFMarkets[/B] [B]Disclaimer:[/B] This material is provided as a general marketing communication for information purposes only and does not constitute an independent investment research. Nothing in this communication contains, or should be considered as containing, an investment advice or an investment recommendation or a solicitation for the purpose of buying or selling of any financial instrument. All information provided is gathered from reputable sources and any information containing an indication of past performance is not a guarantee or reliable indicator of future performance. Users acknowledge that any investment in Leveraged Products is characterized by a certain degree of uncertainty and that any investment of this nature involves a high level of risk for which the users are solely responsible and liable. We assume no liability for any loss arising from any investment made based on the information provided in this communication. This communication must not be reproduced or further distributed without our prior written permission. -
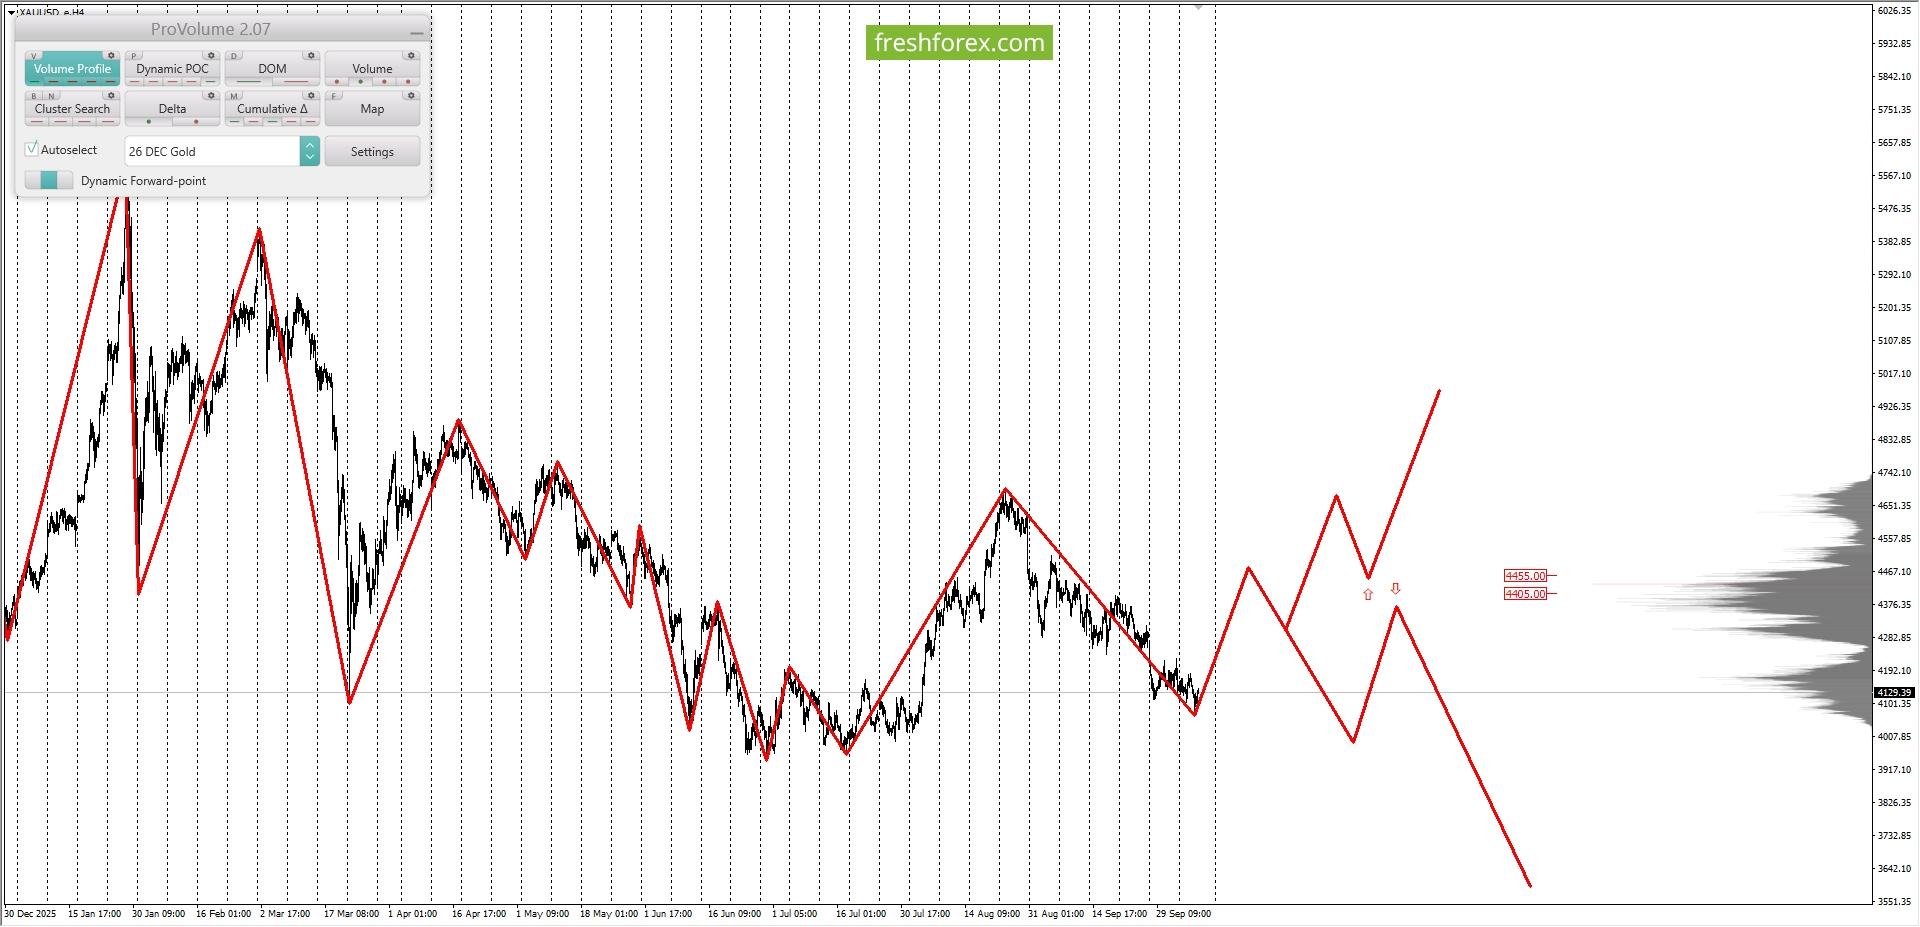
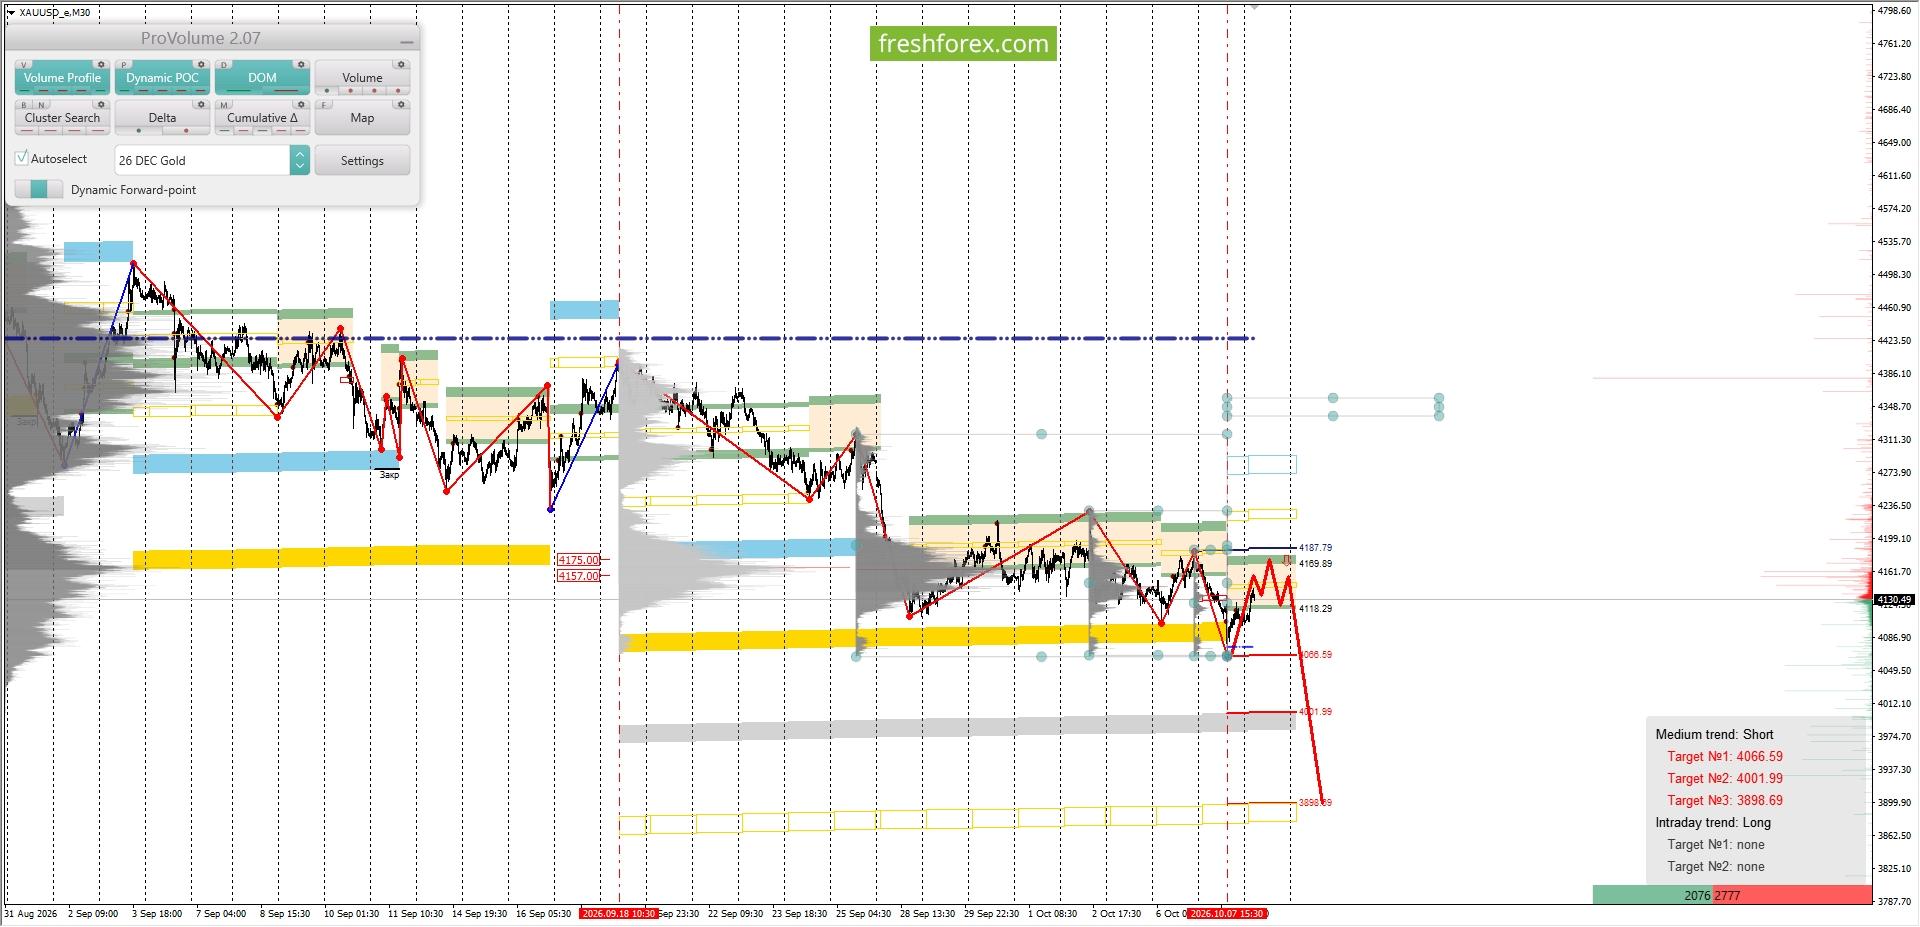
Analysis of margin levels for October 8, 2026 XAUUSD XAUUSD: SELL 4118.29-4169.89, TP1-4066.59, TP2-3898.69. $25 for a risk-free start! Register, complete verification, enter promo code INDOINVEST10 in your Personal Area, and get a trading bonus with no deposit required. Long-term trend: long. The maximum accumulation of volumes for the current contract is located in the range with quotes 4405.00–4455.00. Currently, investment operations on XAUUSD are being conducted below this range, indicating weakness among buyers. Medium-term trend: short. The maximum accumulation of volumes for the medium-term trend is located in the range with quotes 4157.00-4175.00. Currently, investment operations on XAUUSD are being conducted below this range, indicating strength among sellers. The area of favorable prices for selling from the perspective of margin support is located between zones 1/4 and 1/2 built from the minimum of 07.10.2026. Quote for the lower boundary of zone 1/4–4118.29. Quote for the lower boundary of zone 1/2–4169.89. Intraday targets: update of the minimums from 07.10.2026–4066.59. Medium-term targets: test of the lower boundary of GWCZ-3898.69. Trading recommendations: sell from the range of favorable prices when a reversal pattern forms. Sell: 4118.29-4169.89, Take Profit 1–4066.59, Take Profit 2–3898.69. FreshForex offers a wonderful bonus 300% on every deposit from $100, providing an opportunity to increase trading volumes! You can find more analytical information on our website.
-
roboforex Market Fundamental Analysis by RoboForex
RBFX Support replied to RBFX Support's topic in Fundamental Analysis
XAUUSD edges lower despite demand from global central banks XAUUSD quotes could hit a new all-time low set this summer, currently trading at 4,126 USD. XAUUSD forecast: key takeaways Demand for gold from central banks worldwide remains strong US government bond yields continue to rise XAUUSD forecast for 8 October 2026: 3,995 Fundamental analysis The main negative factor for gold at present is the sharp rise in US government bond yields. Long-term US Treasury yields have climbed to their highest levels in roughly two decades. Central banks worldwide continued to increase their gold reserves in August, with net purchases totalling 39 tonnes. RoboForex Market Analysis & Forex Forecasts Attention! Forecasts presented in this section only reflect the author’s private opinion and should not be considered as guidance for trading. RoboForex bears no responsibility for trading results based on trading recommendations described in these analytical reviews. Sincerely, The RoboForex Team -
Market Technical Analysis by RoboForex
RBFX Support replied to RBFX Support's topic in Technical Analysis
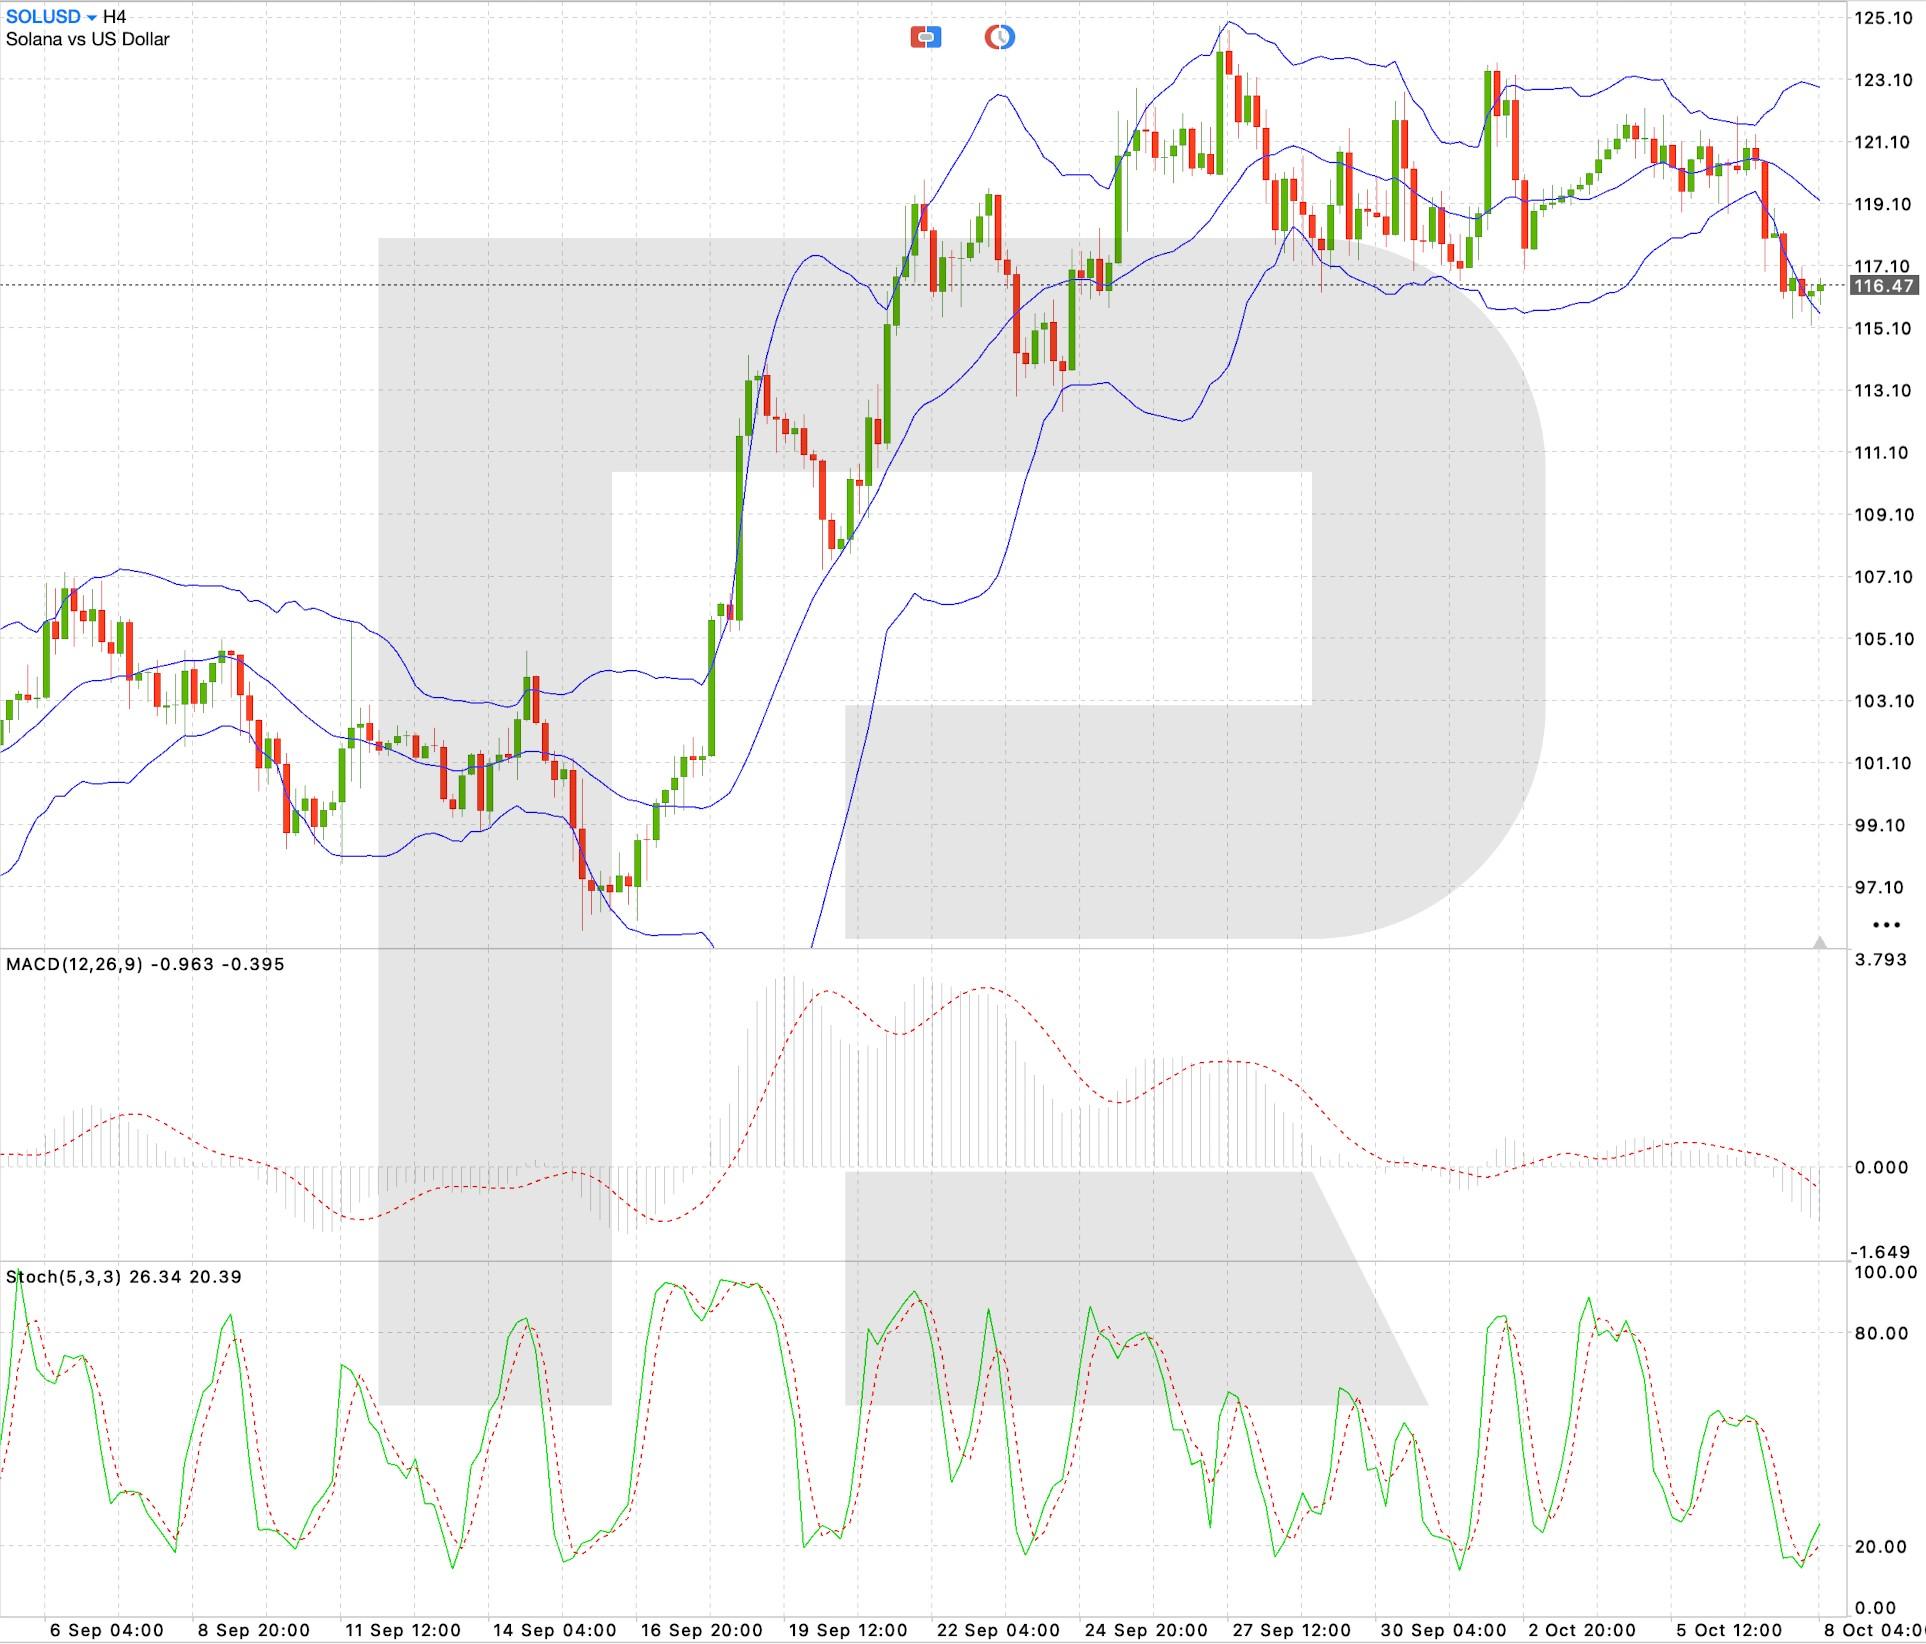
Users flock to Solana: SOL aims to reclaim 119 USD SOLUSD is hovering around 116.47 after correcting from its October highs. Meanwhile, the fundamental backdrop remains positive: the number of new addresses on the Solana network has risen by 33% since the beginning of September, significantly outpacing Ethereum and Chainlink. Technical outlook On the H4 timeframe, SOLUSD is correcting after a failed attempt to consolidate above the 121.00–123.00 area. The price dropped below the middle Bollinger Band and tested the lower boundary of the range near 115.10, after which the first signs of a recovery emerged. SOLUSD is correcting after a strong rally, but the rapid expansion of Solana’s user base supports a positive medium-term backdrop. Read more - SOLUSD Forecast Attention! Forecasts presented in this section only reflect the author’s private opinion and should not be considered as guidance for trading. RoboForex bears no responsibility for trading results based on trading recommendations described in these analytical reviews. Sincerely, The RoboForex Team
-
NIFTY has reached a double bottom as per my view in Futures. Can this be relied for new purchases? Pls share your views and opinions.
-
Thank you Kesk and Banker2882 for always helping this community. ❤️👏 👏 👏
-
Thank you kesk and banker2882
-
hxxps://workupload.com/file/bN4nUpEAQZQ
- Last week
-
 test123 joined the community
 -
roboforex Market Fundamental Analysis by RoboForex
RBFX Support replied to RBFX Support's topic in Fundamental Analysis
Tech rally drives Wall Street higher: US 30 at the trendline The US 30 index is hovering around 51,512.20 after US indices rose in the previous session. A pause in rising yields and strong performance in the technology sector are supporting the market; however, the index has approached a key descending resistance trendline. US 30 forecast: key takeaways The S&P 500 and Nasdaq reached new record highs in the previous session, while the Dow gained 0.49% amid strong demand for technology stocks A pause in the rise in Treasury yields eased pressure on the market, but investors are still awaiting the minutes of the latest Federal Reserve meeting US 30 forecast for 7 October 2026: 52,073.50 Fundamental analysis US stock index futures are little changed on Wednesday after a strong previous session. On Tuesday, the S&P 500 rose 0.58%, the Nasdaq Composite gained 0.45%, with both indices closing at record highs. The Dow Jones added 0.49%. The technology sector was once again the main driver of the rally. Among semiconductor companies, AMD rose 2.8%, Marvell Technology gained 5.8%, and Broadcom advanced 3.7%. RoboForex Market Analysis & Forex Forecasts Attention! Forecasts presented in this section only reflect the author’s private opinion and should not be considered as guidance for trading. RoboForex bears no responsibility for trading results based on trading recommendations described in these analytical reviews. Sincerely, The RoboForex Team -
HFMarkets (hfm.com): Market analysis services.
AllForexnews replied to AllForexnews's topic in Fundamental Analysis
[B]Date: 7th October 2026.[/B] [B]Why Is Gold Falling Despite Weak US Jobs Data & a Potential October Pause?[/B] Gold is failing to gain bullish momentum, despite the Federal Reserve’s next move is likely being a pause. Last week’s Non-Farm Payrolls figure and the broader employment picture were weaker than expected. Traditionally, the weaker data would result in lower rate-hike expectations, a weaker US Dollar, and an upward trend in Gold. However, the market reaction was very different. Here, we will explore the reasons behind this response. US Employment Data & Market Reaction In October, four key employment figures gained market attention: JOLTS job openings, non-farm payrolls, average hourly earnings and the US unemployment rate. JOLTS job openings - 7.08 million vs 7.23 million expected (weaker than expected) Non-farm payrolls - 29,000 VS 89,000 expected (weaker than previous predictions) Average hourly earnings - 0.1% VS 0.3% expected (weaker than previous predictions) US unemployment rate - 4.2% VS 4.2% million expected (weaker than previous predictions) The latest US employment figures do not indicate a deterioration, but they point to a clear cooling. The employment sector remains resilient and is not necessarily pressuring the Fed to adopt a more supportive monetary policy. However, the figures are clearly coming under pressure from high inflation and geopolitical issues, which may prompt the Fed to take a stronger stance. Due to the above figures, the market now expects the Federal Reserve to pause in October and delay a rate hike until December. This would traditionally support Gold, but investors believe that the overall longer-term picture remains unchanged. For this reason, Gold remains under pressure. The Stronger Dollar and Yields One of the primary reasons Gold is struggling is the stronger US Dollar and higher bond yields. The Federal Reserve can influence short-term yields, but longer-term yields are driven by inflation, fiscal policy, and investor sentiment. For this reason, weaker employment data, combined with expectations of an October pause, is providing little support for Gold, as the longer-term yields continue to rise. Markets continue to believe that inflation will remain above 2% for years to come and that governments around the world will struggle to bring their budgets under control. Traders are also still expecting the Fed to keep hiking, despite a potential pause in October. In addition, markets also expect the geopolitical tensions to worsen after the US midterm elections. These developments are increasing investor demand for the US Dollar. The US Dollar Index is currently trading 0.45% higher and recently rose to a 78-week high. The currency has also recently overtaken the Australian Dollar as the best-performing currency of 2026. The Dollar is also finding support from the weakness in the Euro and Japanese Yen. The Euro is coming under pressure from domestic budget disagreements, while the Yen is under pressure from dovish monetary policy. While the US Dollar continues to rise, further weakness in Gold prices remains possible. Pressure on Gold Remains We can see from the above that despite weaker employment data and expectations of an October pause, Gold continues to decline. The key reasons for the weakness are higher bond yields, a stronger Dollar, and expectations for future rate hikes. In terms of price analysis, Gold remains under short-term bearish pressure after failing to sustain Tuesday’s recovery towards the $4,180.00 area. The price has slipped back towards $4,130, with the stronger US dollar and persistently elevated Treasury yields limiting upside momentum. Technically, $4,110.00 is the key immediate support zone. A convincing break below this area could expose $4,050, followed by the psychologically important $4,000 level. Currently, Gold’s price is trading below all moving averages and the day’s VWAP. At the same time, the price is trading comfortably in the RSI’s sell-zone while avoiding the oversold area for now. However, if the price rises above $4,148 in the short term or $4,170.00 in the medium term, sell signals could be erased. Tonight’s FOMC meeting minutes are likely to trigger high volatility for the US Dollar and, as a result, also impact Gold. The more hawkish the Fed’s meeting minutes sound, the more they may pressure Gold. In addition to the meeting minutes, FOMC member Mr Waller, will also speak tomorrow morning at an Istanbul economic forum. These will be the first comments from a Fed member following the weak employment data and the release of the Fed’s meeting minutes. Key Takeaways: Weak US employment data points to an October Fed pause, but not a dovish shift. Higher Treasury yields are keeping pressure on Gold despite softer labour data. A stronger US Dollar is adding further downside pressure to Gold prices. Gold remains technically bearish, with $4,110 as key support and 4,148–4,170 as resistance. The FOMC minutes and Waller’s comments could trigger the next major move in Gold. [B]Always trade with strict risk management. Your capital is the single most important aspect of your trading business.[/B] [B]Please note that times displayed based on local time zone and are from time of writing this report.[/B] Click [URL='https://www.hfm.com/hf/en/trading-tools/economic-calendar.html'][B]HERE[/B][/URL] to access the full HFM Economic calendar. Want to learn to trade and analyse the markets? Join our webinars and get analysis and trading ideas combined with better understanding of how markets work. Click [URL='https://www.hfm.com/en/trading-tools/trading-webinars.html'][B]HERE[/B][/URL] to register for FREE! [URL='https://analysis.hfm.com/'][B]Click HERE to READ more Market news.[/B][/URL] [B]Michalis Efthymiou HFMarkets[/B] [B]Disclaimer:[/B] This material is provided as a general marketing communication for information purposes only and does not constitute an independent investment research. Nothing in this communication contains, or should be considered as containing, an investment advice or an investment recommendation or a solicitation for the purpose of buying or selling of any financial instrument. All information provided is gathered from reputable sources and any information containing an indication of past performance is not a guarantee or reliable indicator of future performance. Users acknowledge that any investment in Leveraged Products is characterized by a certain degree of uncertainty and that any investment of this nature involves a high level of risk for which the users are solely responsible and liable. We assume no liability for any loss arising from any investment made based on the information provided in this communication. This communication must not be reproduced or further distributed without our prior written permission.