⤴️-Paid Ad- Check advertising disclaimer here. Add your banner here.🔥
All Activity
- Past hour
-
Sorry the link no work
-
i trade vah and lows, def would be intered in this too.
- Today
-
Do you have it.?
-
please share this cloud indicator
-
Hi Team, Anyone with good templates for Axios? or the latest template for this strategy? Thank you
-
Looks good on backtest results. Comments anyone? https://renkokings.com/entropy-voltex
-
Hi, anyone used this indicator before? looks promising. https://ninza.co/product/gravity-orbitx
-
🎯Pressure Sensitivity Levels 📊 Trade Entry Signal ⚡Momentum Strength Filter 🏷️POC Filter Δ Delta Confirmation & Divergence 📐Visual Signal Zones POC Movement Multi-Time Frame Analysis https://www.orderflows.com/pressure/
-
The newly introduced Pre$$ure Indi is a top-notch, wen can we get that, even via group buy?
-

Market Technical Analysis by RoboForex
RBFX Support replied to RBFX Support's topic in Technical Analysis
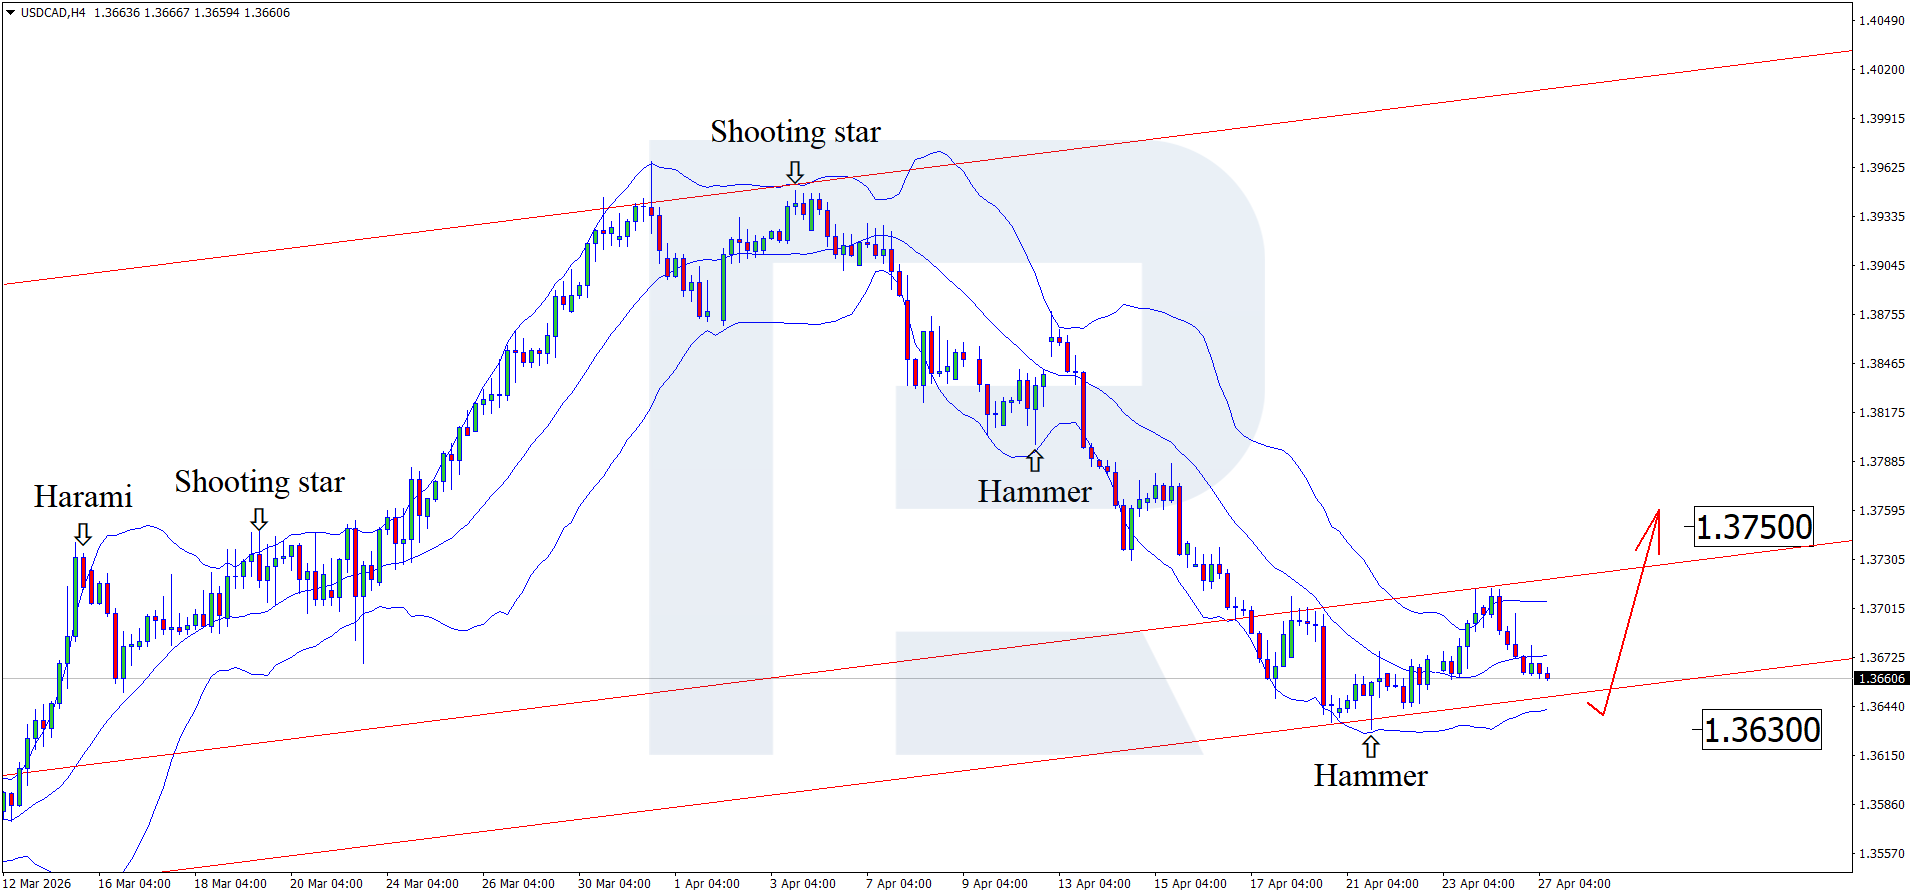
USDCAD frozen before the storm: the market is waiting for a single signal to break loose Rising oil prices continue to support the CAD, with the USDCAD rate testing the 1.3660 level. Discover more in our analysis for 27 April 2026. Technical outlook On the H4 chart, the USDCAD pair formed a Hammer reversal pattern near the lower Bollinger Band. At this stage, following the correction, it may continue the upward wave as the signal plays out. The market is awaiting the release of US inflation (PCE) data, which will bring some clarity to the Fed’s future decisions. Read more - USDCAD Forecast Attention! Forecasts presented in this section only reflect the author’s private opinion and should not be considered as guidance for trading. RoboForex bears no responsibility for trading results based on trading recommendations described in these analytical reviews. Sincerely, The RoboForex Team
-
roboforex Market Fundamental Analysis by RoboForex
RBFX Support replied to RBFX Support's topic in Fundamental Analysis
DE 40 forecast: the index is correcting, but the overall upward bias remains The uptrend in the DE 40 stock index may become medium-term if the correction ends within the next few trading sessions. The DE 40 forecast for today is positive. DE 40 forecast: key takeaways Recent data: Germany’s preliminary ZEW Economic Sentiment Index came in at −17.2 in April Market impact: the data creates a negative backdrop for the German stock market Fundamental analysis The drop in Germany’s ZEW Economic Sentiment Index to −17.2, below the forecast of −5.9 and the previous reading of −0.5, is a negative signal for the DE 40 index. The data suggests a significant deterioration in expectations among investors and analysts regarding the outlook for the German economy. This release could put short-term pressure on the DE 40 index. Companies that depend on domestic demand, the industrial cycle, and export orders look particularly vulnerable. RoboForex Market Analysis & Forex Forecasts Attention! Forecasts presented in this section only reflect the author’s private opinion and should not be considered as guidance for trading. RoboForex bears no responsibility for trading results based on trading recommendations described in these analytical reviews. Sincerely, The RoboForex Team -
Its what was posted originally in the thread.
-
 ⭐ osijek1289 reacted to a post in a topic:
https://www.dtbtraders.com/
⭐ osijek1289 reacted to a post in a topic:
https://www.dtbtraders.com/
-
fxtrader99 reacted to a post in a topic:
M.V's 4 Indicators
-
The bars come from Trading123.net. And yes, I did have some other indies on the chart, just to play around and see which signals should be taken and which signals should be ignored, as with many other indies out there. And also yes, as I did mention in my original first post, thêse indies give arrows for buy/sell. Seems like you didnt read carefully.
-
Everything is Xmas tree. Doesn't matter which you try or have tried. Unless of course, you know how to take advantage of them and use them correctly. In the end, they are all just a guide, simply a tool. In trading, nothing is certain nor 100%. Gotta find your ways, your edge and make it your own. Nobody, no gurus, no strats, no indicators, no bots can print you money.
-
 Ninja_On_The_Roof reacted to a post in a topic:
KWIKPOP Try Again
Ninja_On_The_Roof reacted to a post in a topic:
KWIKPOP Try Again
-
hi @Ninja_On_The_Roof can you plz reupload? Looks interesting. TIA
-
this may be useful: https://drive.google.com/drive/folders/1NE4PQ9OTD7qc1TUH_hEONKhfNCKvu-p5 https://www.youtube.com/@DTBTradersNinjaTrader8
-
⭐ ralph kabota reacted to a post in a topic:
KWIKPOP Try Again
-
⭐ RichardGere reacted to a post in a topic:
Timingsolution & Nifty Updates - 3
-
All thanks, appreciation, and respect to you, Mr. kesk, for your continued contributions.👏👏👏🌹 We await Mr. banker2882 to complete the work, and we extend to him our sincere thanks and respect.👏👏👏🌹
-
raock95 reacted to a post in a topic:
KWIKPOP Try Again
-
 Kermit 1981 reacted to a post in a topic:
M.V's 4 Indicators
Kermit 1981 reacted to a post in a topic:
M.V's 4 Indicators
-
https://mega.nz/file/GdBk2BpZ#P9peIfvy4LGaLCZHZaiPokL7r23BI8Q4bhBfJlWUPN0 24 Apr 2026 Terra update
-
best trading system ever
-
this is what I am getting: https://ibb.co/RTgGTZMJ Another Xmas tree.
-
Fair enough. I did some search but couldnt find trading123renko. You also seem to have more indicators on your chart. With those flowedge/powerbar/flowbreak, they just give the arrows up/down and color the bars. The scalper, I cannot find in the strategies somehow. I see, the scalper is an indicator..
-
It says right there on the chart.😂
-
can I ask what renko bars you are using?
-

HFMarkets (hfm.com): Market analysis services.
AllForexnews replied to AllForexnews's topic in Fundamental Analysis
Date: 27th April 2026. This Week’s Big Tech Earnings Could Decide the Market’s Next Move. President Trump’s Secret Service agent may have had their eyes on a violent intruder, but investors have theirs on major earnings reports. The upcoming week will see Alphabet, Microsoft, Amazon, Meta, and Apple release their quarterly earnings reports. These companies are some of the most influential for the stock market and make up 42% of the NASDAQ’s weight. The stocks have been the best-performing assets in the month of April after declining for two straight months. So far the NASDAQ and NIKKEI 225 are the best-performing indices, both increasing almost 15% and trading at all-time highs. Bloomberg's Bull Bear Spread Index has turned positive for the first time since February. However, their upcoming performance will depend largely on the upcoming earnings reports and the price of oil which remains elevated. HFM - NASDAQ Daily Chart Alphabet Quarterly Earnings Report Alphabet is due to release its quarterly earnings reports on Wednesday after market close, with the press conference early during Thursday’s Asian session. The stock has been one of the best performing over the past 12 months with the stock rising more than 110%. Market expectations for earnings are between $106-$107 billion in revenue and $2.62-$2.73 EPS, depending on the source. In addition to the quarterly earnings report, the stock will also be influenced by cloud growth and AI monetisation. Apple Quarterly Earnings Report After Alphabet, Apple’s earnings report will be the most influential of the week as it holds more than a 10% weight. Market expectations are clustered around roughly $1.92-$1.95 EPS and about $109 billion in revenue, depending on the fund manager. If the figures read higher than expected, the stock has the potential to rise. However, the stock will also largely depend on iPhone demand, the Chinese market, and investments in AI. S&P Global notes that analysts expect iPhone sales to have edged higher to around 60 million for the current quarter. If higher, this could further support the stock. Lastly, investors will be focusing on the company’s attempt to regain momentum in China, which is a key market for the company historically. Lastly, Apple is still under pressure to prove its AI roadmap can compete with other mega-cap tech names. Any commentary around Apple Intelligence, Siri improvements, on-device AI, or AI-enabled hardware could influence the stock more than the headline numbers. Microsoft Quarterly Earnings Report Microsoft stocks, even though they are one of the most influential for the stock market, are also one of the struggling stocks over the past year. The stock remains one of the most influential in the market, but it has also been among the underperformers. The stock has only risen 8% in the past 12 months and still remains more than 10% lower in 2026. Market expectations are around $4.04 EPS and roughly $81.3-$81.4 billion in revenue. Azure is the headline metric. Investors will be looking for confirmation that AI workloads are still supporting strong cloud growth. Microsoft’s AI story now needs proof of monetisation, with investors watching Copilot adoption, enterprise demand, and whether AI is driving real revenue growth. Crude Oil - Iran Make New Proposal For Straits HFM - Crude Oil 15-Minute Chart Stock traders monitoring the medium to longer term outlook will also be closely focusing on oil prices and the Middle East. Investors are currently fully pricing an end to the conflict, but not any global or economic repercussions. Negotiations over the weekend did not take place, which had a negative impact on supply. The US has confirmed that the double blockade remains in place. However, on Monday morning, Iran signalled it would accept an interim deal whereby the Strait of Hormuz reopens in exchange for Washington ending its blockade of Iranian ports. However, this is yet to trigger any decline in oil prices. Nonetheless, traders will continue to monitor this development over the upcoming hours. Key Takeaway: Mega-cap earnings will be the main market driver this week, with Alphabet, Microsoft, Amazon, Meta, and Apple in focus. Alphabet and Apple results are key, especially AI, cloud, iPhone demand, and China performance. Microsoft needs to prove AI monetisation, with Azure growth and Copilot adoption under focus. Oil remains a major risk, as Middle East tensions keep prices elevated. Always trade with strict risk management. Your capital is the single most important aspect of your trading business. Please note that times displayed based on local time zone and are from time of writing this report. Click HERE to access the full HFM Economic calendar. Want to learn to trade and analyse the markets? Join our webinars and get analysis and trading ideas combined with better understanding of how markets work. Click HERE to register for FREE! Click HERE to READ more Market news. Michalis Efthymiou HFMarkets Disclaimer: This material is provided as a general marketing communication for information purposes only and does not constitute an independent investment research. Nothing in this communication contains, or should be considered as containing, an investment advice or an investment recommendation or a solicitation for the purpose of buying or selling of any financial instrument. All information provided is gathered from reputable sources and any information containing an indication of past performance is not a guarantee or reliable indicator of future performance. Users acknowledge that any investment in Leveraged Products is characterized by a certain degree of uncertainty and that any investment of this nature involves a high level of risk for which the users are solely responsible and liable. We assume no liability for any loss arising from any investment made based on the information provided in this communication. This communication must not be reproduced or further distributed without our prior written permission. -
No