⤴️-Paid Ad- Check advertising disclaimer here. Add your banner here.🔥
All Activity
- Past hour
-
 ⭐ nadjib reacted to a post in a topic:
LET'S SHARE YOUR STRATS
⭐ nadjib reacted to a post in a topic:
LET'S SHARE YOUR STRATS
-
I should turn on Tick Replay and try again.
-
Eva Grey reacted to a post in a topic:
New template for SMM indicators
-
Eva Grey reacted to a post in a topic:
New template for SMM indicators
-
 LoneWolf78 joined the community
 - Today
-
i am asking about trend rider algo installation files
-
jquiroz75 reacted to a post in a topic:
LET'S SHARE YOUR STRATS
-
RamAli reacted to a post in a topic:
ChartToolBar
-
@N9T hey can you please share
-
Looks amazing... too bad backtesting heikin ashi isn't reliable
-
You know it's not realistic, right? That kind of smooth curve indicates looking into the existing OHLC.
-
⭐ rcarlos1947 reacted to a post in a topic:
ChartToolBar
-
This is simply 50/25 ticks. In the default setting, set Stop Loss Offset to 25 and Target 1 Value to 50.
-

roboforex Market Fundamental Analysis by RoboForex
RBFX Support replied to RBFX Support's topic in Fundamental Analysis
JP 225 forecast: the index has completed its correction The JP 225 stock index has completed its correction after reaching a new all-time high and is poised to climb higher. The JP 225 forecast for today is positive. JP 225 forecast: key takeaways Recent data: Japan’s GDP growth for Q4 2025 came in at 0.2% year-on-year Market impact: the effect on the Japanese equity market is moderately negative Fundamental analysis The published Japanese GDP data, at 0.2% year-on-year, compared to expectations of 1.6%, indicates a significantly weaker economic recovery than the market had anticipated. For the JP 225 index, this typically forms a moderately negative initial signal, as expectations for revenue growth among companies focused on domestic demand deteriorate and investor caution increases regarding the coming quarters. According to Goldman Sachs, hedge funds have purchased the bulk of Asian equities over the past decade. Last week, emerging and developed Asian markets recorded the largest net hedge fund inflows since 2016, supported by optimism surrounding companies involved in artificial intelligence infrastructure. RoboForex Market Analysis & Forex Forecasts Attention! Forecasts presented in this section only reflect the author’s private opinion and should not be considered as guidance for trading. RoboForex bears no responsibility for trading results based on trading recommendations described in these analytical reviews. Sincerely, The RoboForex Team -
Market Technical Analysis by RoboForex
RBFX Support replied to RBFX Support's topic in Technical Analysis
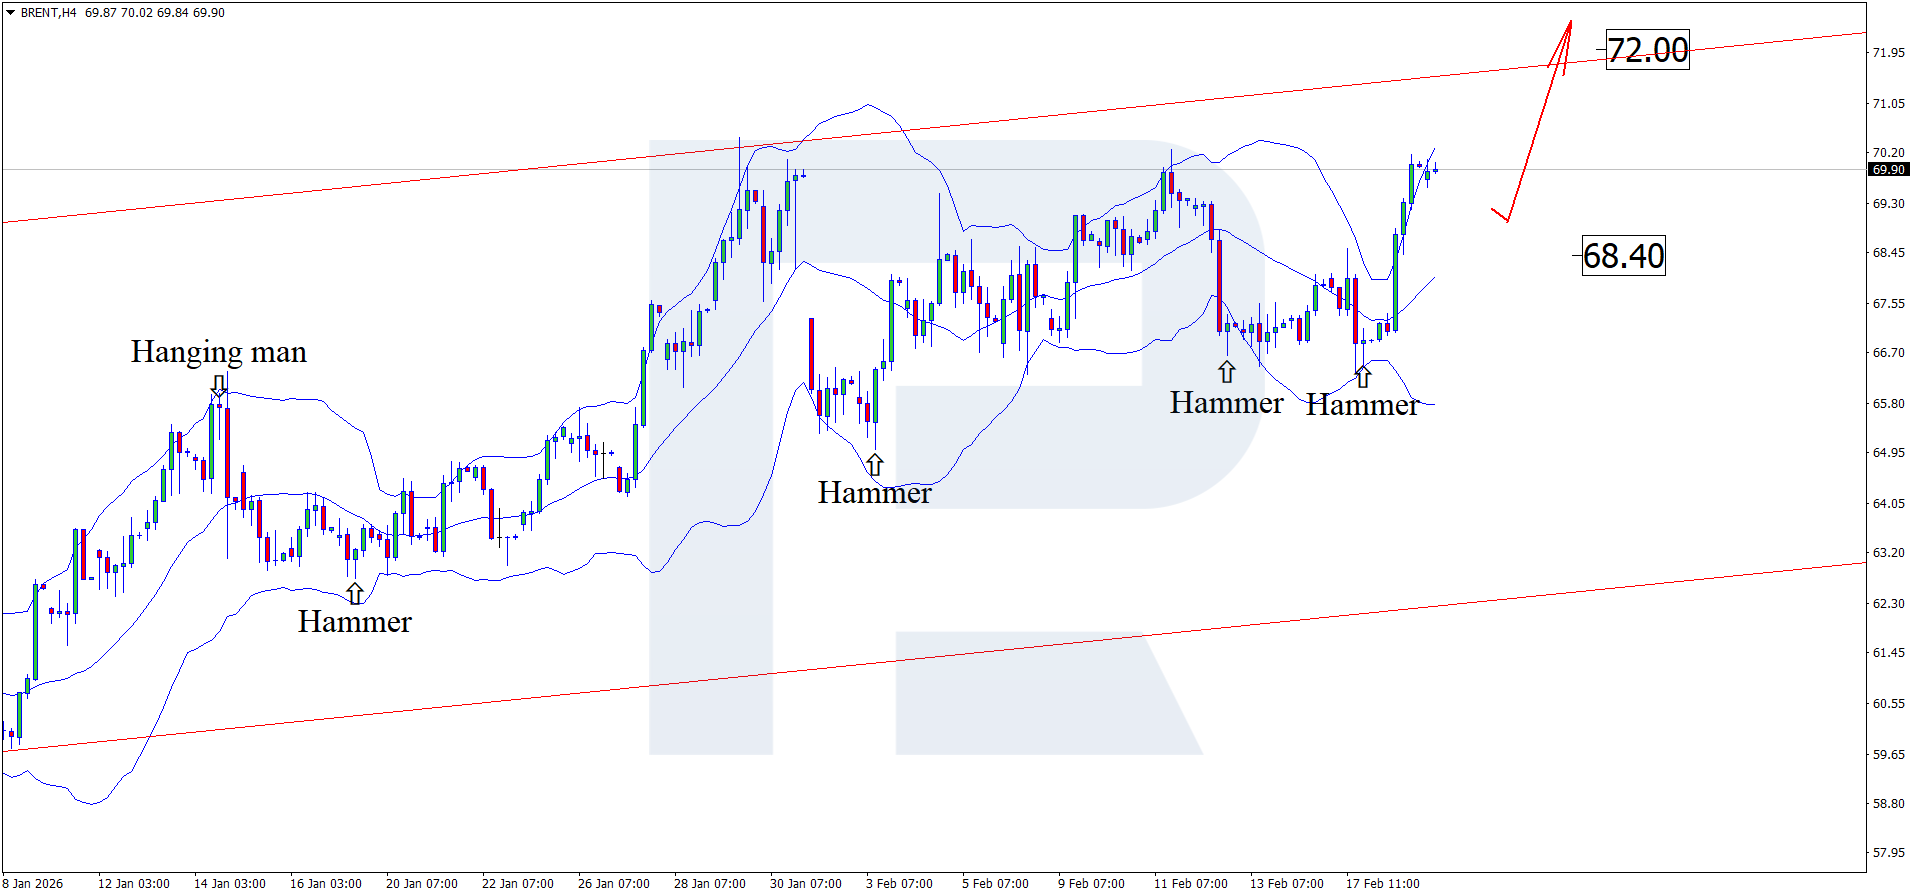
Brent prices on the verge of records: decline in US oil inventories could trigger surge Economic data and a decline in US oil inventories support Brent quotes, which have reached 70.00 USD per barrel. Find out more in our analysis for 19 February 2026. Technical outlook On the H4 chart, Brent quotes formed a Hammer reversal pattern after testing the lower Bollinger Band. At this stage, they continue to develop an upward wave in line with the pattern signal. Amid expectations of US oil inventory data, Brent quotes continue to strengthen. Read more - Brent Forecast Attention! Forecasts presented in this section only reflect the author’s private opinion and should not be considered as guidance for trading. RoboForex bears no responsibility for trading results based on trading recommendations described in these analytical reviews. Sincerely, The RoboForex Team
-
Can u share the trend rider files
-
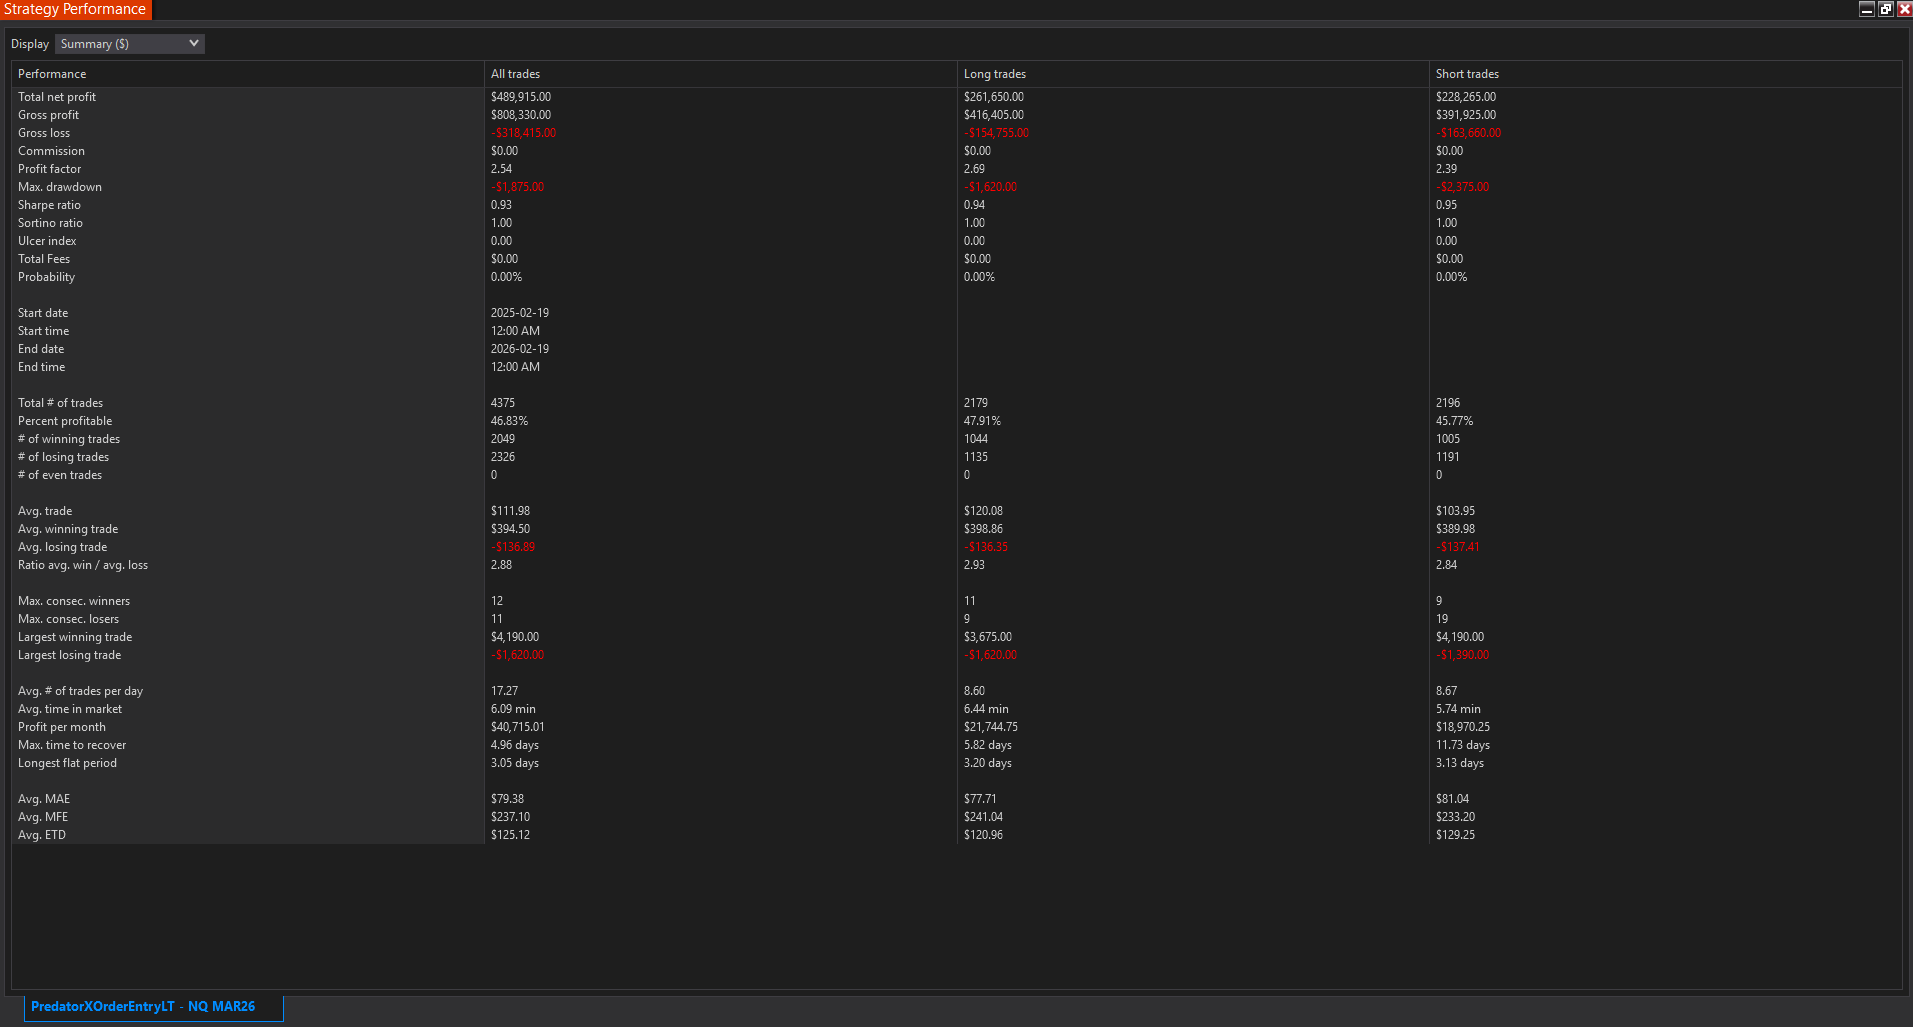
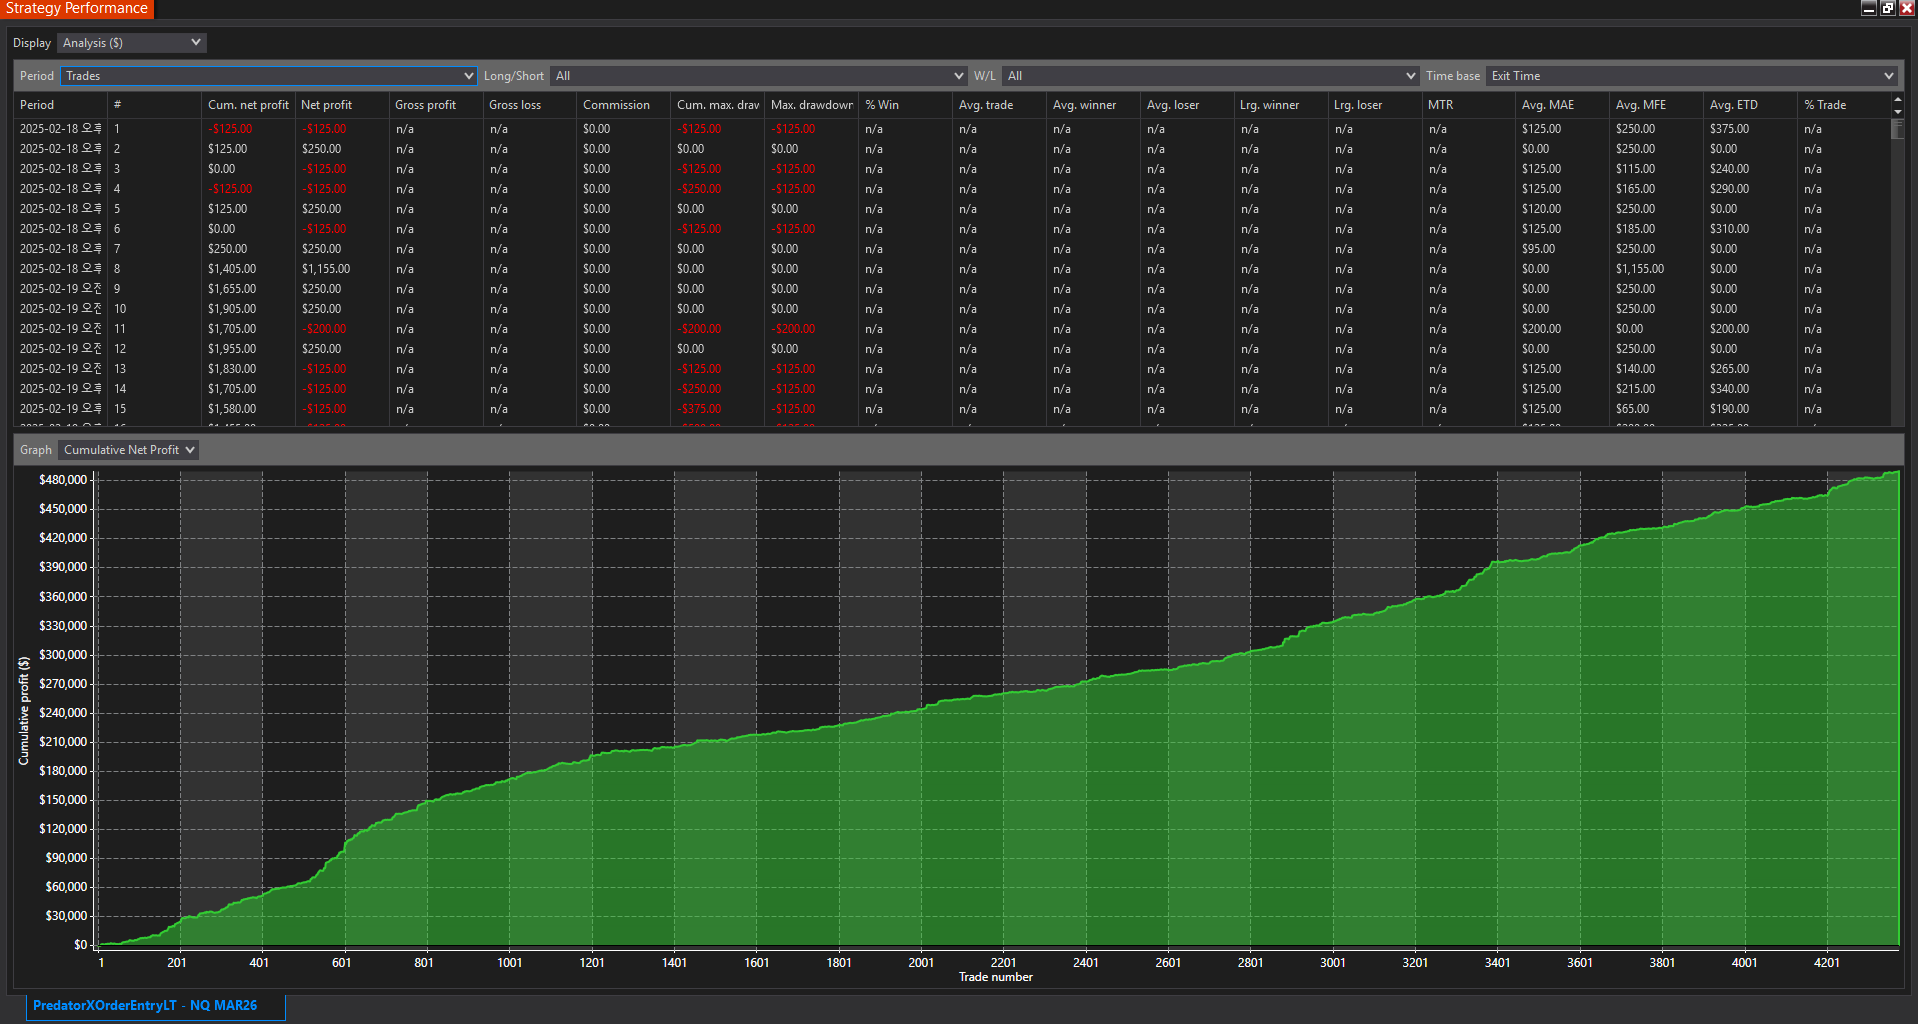
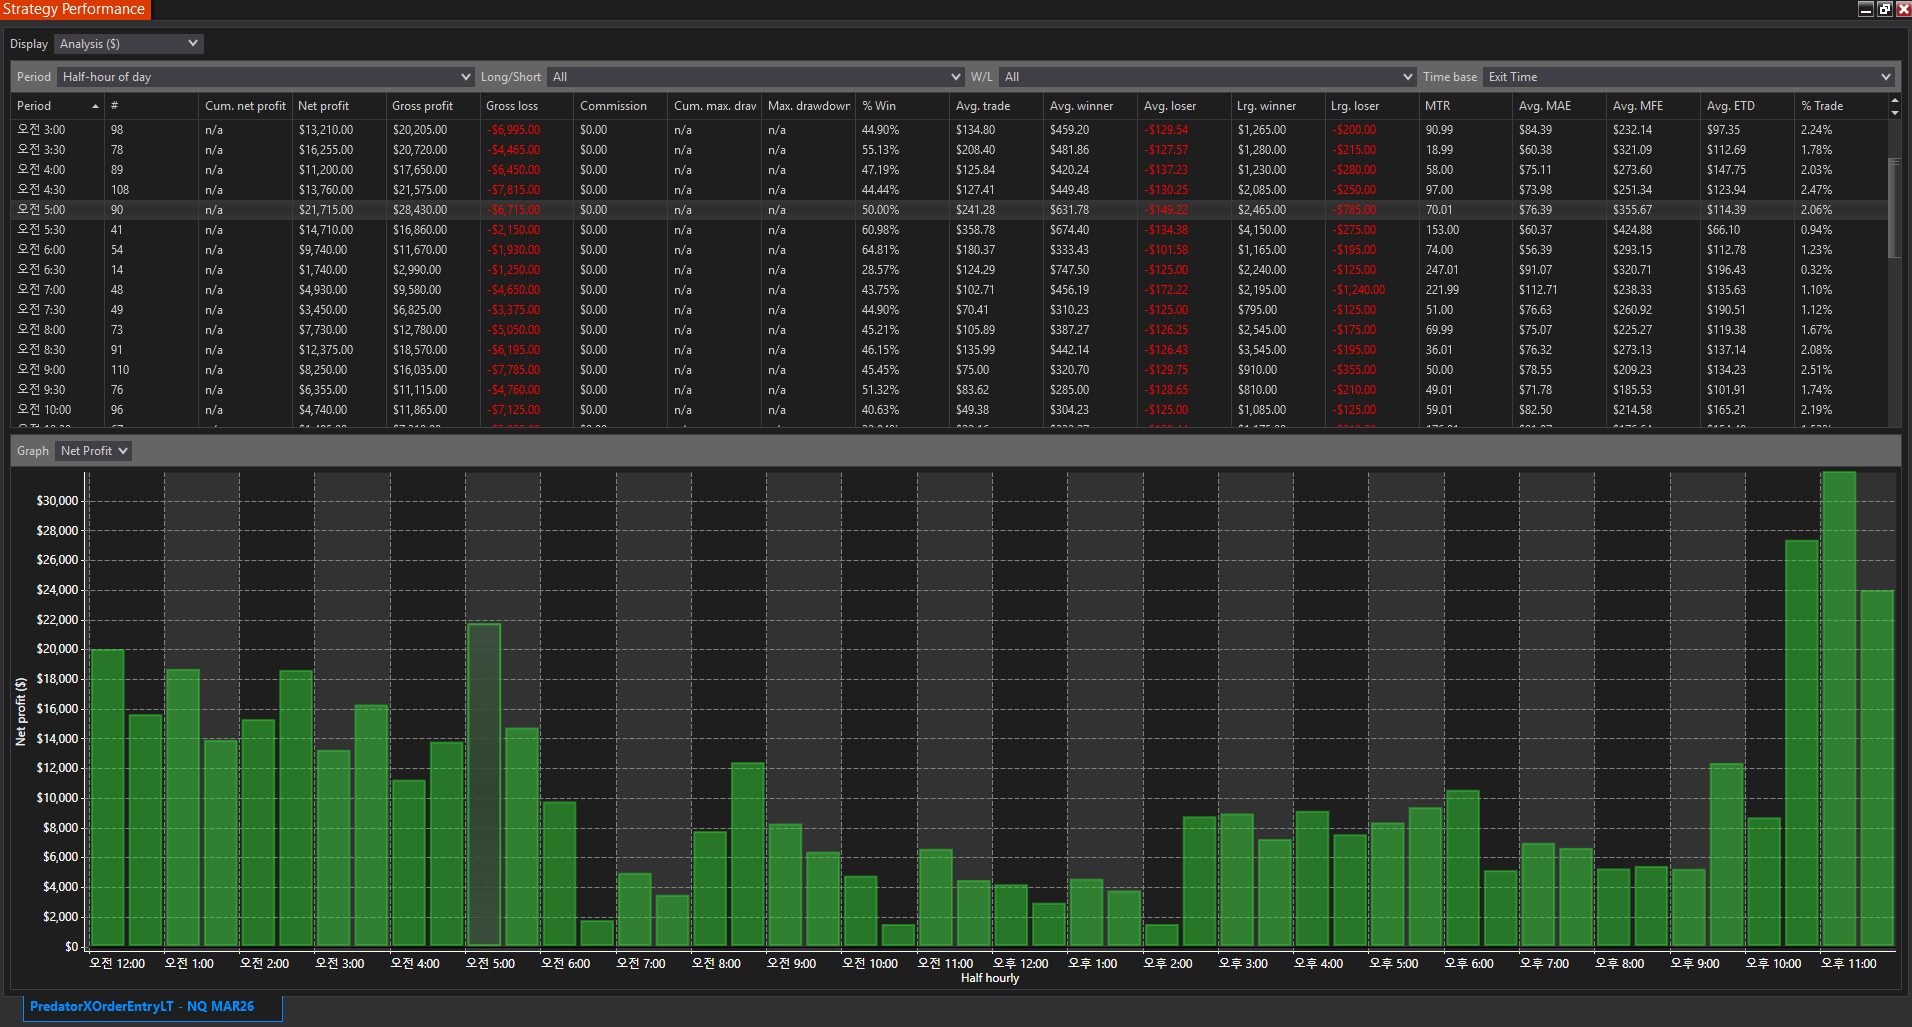
"Trend Rider" (5-minute Heiken-Ashi, NQ, 50/25) earns in New York sessions.
-
RamAli reacted to a post in a topic:
ChartToolBar
-

HFMarkets (hfm.com): Market analysis services.
AllForexnews replied to AllForexnews's topic in Fundamental Analysis
Date: 19th February 2026. Markets Walk a Tightrope: Strong Data Meets Rising Geopolitical Risk. As traders approach the weekend, markets are balancing resilience in US data and corporate earnings against mounting geopolitical uncertainty. While equities have extended gains, underlying caution is becoming more visible, particularly in commodities and safe-haven assets. Geopolitical Risk Returns to the Forefront The key macro driver remains escalating tensions between the United States and Iran. Reports suggesting an increased likelihood of military confrontation have lifted oil sharply, with Brent crude holding above $70 and West Texas Intermediate trading above $65. Any disruption from the Middle East, a region responsible for roughly a third of global oil supply, would have immediate inflation implications. That risk alone is enough to keep traders cautious, particularly ahead of a weekend when headline exposure cannot be managed intraday. Gold has edged higher, while Bitcoin has slipped, a subtle signal that risk appetite remains selective rather than euphoric. Labour Market Stability Keeps the Fed Patient Thursday’s US jobless claims data is the only meaningful release on the calendar. Initial claims are expected at 225K, with continuing claims near 1.86 million. Recent labour market readings have shown gradual stabilisation rather than deterioration, reinforcing the view that the Federal Reserve does not need to rush into rate cuts. Minutes from the January meeting revealed divisions within the central bank. Some officials remain concerned about persistent inflation, while others are open to easing later in the year. Despite hawkish undertones, market pricing still anticipates two rate cuts by year-end. Unless jobless claims deviate significantly from expectations, the data is unlikely to shift that pricing meaningfully. For now, policy expectations remain steady, but sensitive to surprises. Equities Supported by Tech Leadership US futures are hovering near flat after a solid session in which the S&P 500 and Nasdaq Composite both advanced, led by renewed strength in mega-cap technology. Nvidia once again played a central role in lifting sentiment, particularly following AI-related partnership developments with Meta Platforms. Given Nvidia’s heavy index weighting, its performance continues to exert disproportionate influence on broader benchmarks. However, the AI narrative remains double-edged. While it drives index gains, it also fuels volatility in sectors perceived as vulnerable to disruption. Markets have recently shown a tendency toward sharp rotational moves, underscoring how fragile conviction can be beneath the surface. Global Markets and Diverging Policy Paths In Asia, indices such as the Nikkei 225 and Kospi posted gains following Wall Street’s strength. In Europe, the FTSE 100 advanced after inflation data reinforced expectations that the Bank of England may move towards rate cuts. This divergence highlights an important theme for currency traders: monetary cycles are no longer synchronised globally. Relative policy expectations may drive FX volatility more than absolute levels. The Bigger Picture for Traders At the moment, markets are not pricing panic, but they are pricing uncertainty. Strong US data reduces the urgency for rate cuts. Elevated oil prices threaten to reintroduce inflationary pressure. And geopolitical risk adds a layer of unpredictability that can shift sentiment rapidly. This environment typically produces choppy price action, sector rotation, and headline-driven volatility rather than clean, trending moves. As we move towards the weekend, traders may find that disciplined positioning and controlled exposure matter more than directional conviction. Always trade with strict risk management. Your capital is the single most important aspect of your trading business. Please note that times displayed based on local time zone and are from time of writing this report. Click HERE to access the full HFM Economic calendar. Want to learn to trade and analyse the markets? Join our webinars and get analysis and trading ideas combined with better understanding of how markets work. Click HERE to register for FREE! Click HERE to READ more Market news. Andria Pichidi HFMarkets Disclaimer: This material is provided as a general marketing communication for information purposes only and does not constitute an independent investment research. Nothing in this communication contains, or should be considered as containing, an investment advice or an investment recommendation or a solicitation for the purpose of buying or selling of any financial instrument. All information provided is gathered from reputable sources and any information containing an indication of past performance is not a guarantee or reliable indicator of future performance. Users acknowledge that any investment in Leveraged Products is characterized by a certain degree of uncertainty and that any investment of this nature involves a high level of risk for which the users are solely responsible and liable. We assume no liability for any loss arising from any investment made based on the information provided in this communication. This communication must not be reproduced or further distributed without our prior written permission. -
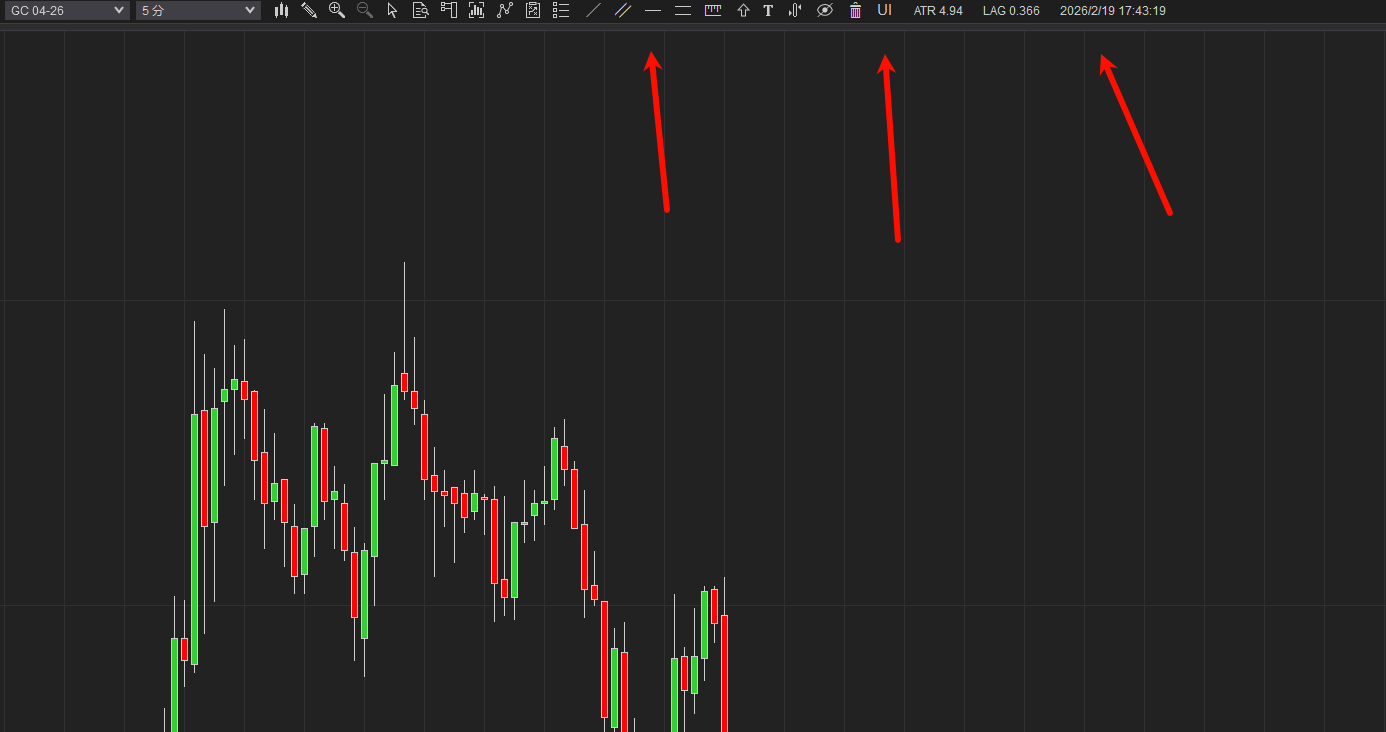
ChartToolBar is a toolbar indicator that centralizes commonly used charting tools and practical functions at the top of the chart, allowing for easy one-click access without having to switch back and forth through menus. It supports one-click switching/hiding of chart objects, batch deletion of charts, one-click management of indicator visibility, and includes built-in ATR volatility value, market latency (Lag), and time display. It also provides enhanced user experience features such as left-click free-dragging (Panning) and scroll wheel zooming. ChartToolBar.zip
- 1 reply
-
- 2
-
-
dex reacted to a post in a topic:
New template for SMM indicators
-
it's this : https://tradedevils-indicators.com/products/orderflow-footprint-trader?selling_plan=2855207111&variant=46156336332999
-

Bot that makes cryptos free without investing anything
CRYPTOHUSTLER replied to indo909's topic in Cryptocurrencies
No genuine bot can generate free cryptocurrency with zero risk or effort. Promises of “free crypto” tools are usually scams meant to steal funds, keys, or personal data. Legit ways to earn include learning rewards, testnet programs, bounties, verified airdrops, and paid Web3 work. Always verify projects carefully and avoid anything guaranteeing effortless profits. -
Building wealth by blending crypto with e-gaming works best when you focus on projects with real utility, healthy in-game economies, and genuine player demand. Gaming brings engagement and usage, while blockchain adds ownership, rewards, and global reach. Results improve by selecting teams with active communities, balanced token models, and long-term roadmaps, then managing risk through diversification and realistic goals.
-
Ethereum has bounced back from recent pullbacks with buyers stepping in around the $2,500 area, creating a new support base and lifting near-term sentiment. Sustained volume and a series of higher lows could fuel a move toward resistance. Monitor macro signals and on-chain activity for validation. Pairing majors with growth plays like the LMGX token can help balance risk.
-
Ninja_On_The_Roof reacted to a post in a topic:
ABLESYS - WINTICK
-
Ali is the man behind Volume Tools
-
Klar, hier ist es freundlich formuliert: Could someone please upload the software again? Thank you in advance!
-
fxzero.dark reacted to a post in a topic:
LET'S SHARE YOUR STRATS
-
No, I haven't seen it. Is it based on something similar?
-
Can anyone share the updated version copy. Thanks
-
Everything has been posted. The TWST and the Ninza Infinity. The TWST isnt the actual Scalper stand-alone one. I think they just separate it out and sell it as on its own. It does come with a long list of different strats you can pick but yes, TWST Store one has been posted somewhere, including some templates. The Ninza Infinity has also been posted. I was just playing around with it but certainly, it doesnt have to be Infinity. Can just be anything else from Ninza.
-
Have you tried the Trend Rider from TDU?
-
Have you tried the Trend Rider from TDU?
-
its a great tool for trending markets not for a choppy sideways areas. its not bad at all, you should keep it on the side of your screen so you can make sure you are at the right side of the market. its also a wonderful tool for scalping depends what time frame you are using. obviously they only show you the nice section of a chart where you could even trade just with a moving average lol. if you try to use it on a sideways section you will lose your butt because by the time you enter- the market already changed direction. but again- i think its a very good tool and if you combine it with mpace and xpace of mbox ( you can get it from brokey ) then you have an amazing little system. just my 7 cents lol Traderbeauty Jane