⤴️-Paid Ad- Check advertising disclaimer here. Add your banner here.🔥
All Activity
- Past hour
-
 ⭐ goldeneagle1 reacted to a post in a topic:
Orderflow Labs
⭐ goldeneagle1 reacted to a post in a topic:
Orderflow Labs
-
⭐ goldeneagle1 reacted to a post in a topic:
Orderflow Labs
-

A very profitable Amibroker indicator to be educated
⭐ nevergiveup replied to Jony's topic in Amibroker
I am using Amibroker 6.93 professional 64-bit version, paid and registered. How do I test this? - Today
-
True, I believe thats right. But I started with the version 1.0 and got used to it.. in fact, I have bulit some of my strageies around it.. would be cool to teu the newer versions. Try forexshop outlet.. he sells for cheap and they night have the newer versions.. i like the market profile from TDU combined with the volume profile too and market correlation indicator.. a big thumbs up for their footprint delta candles indicator really comes around.
-
 ⭐ rcarlos1947 reacted to a post in a topic:
TDU 2025 indicators
⭐ rcarlos1947 reacted to a post in a topic:
TDU 2025 indicators
-
@fchot33, Thank you for this contribution. In your comments I assume "mexer" was meant to say "never". Anyway, the 1.0.17 version is val's fix. But in my humble opinion, v1.0 is like riding a tricycle while the many features in the latest versions would be like riding a Harley Davidson. The shame is that no one to my knowledge has been able to crack the newer versions. If they could, one would be able to create very advanced strategies using not only TDU indicators, but any of the purchased indicators in your arsenal. Again, just my thoughts on the subject.
-

Market Technical Analysis by RoboForex
RBFX Support replied to RBFX Support's topic in Technical Analysis
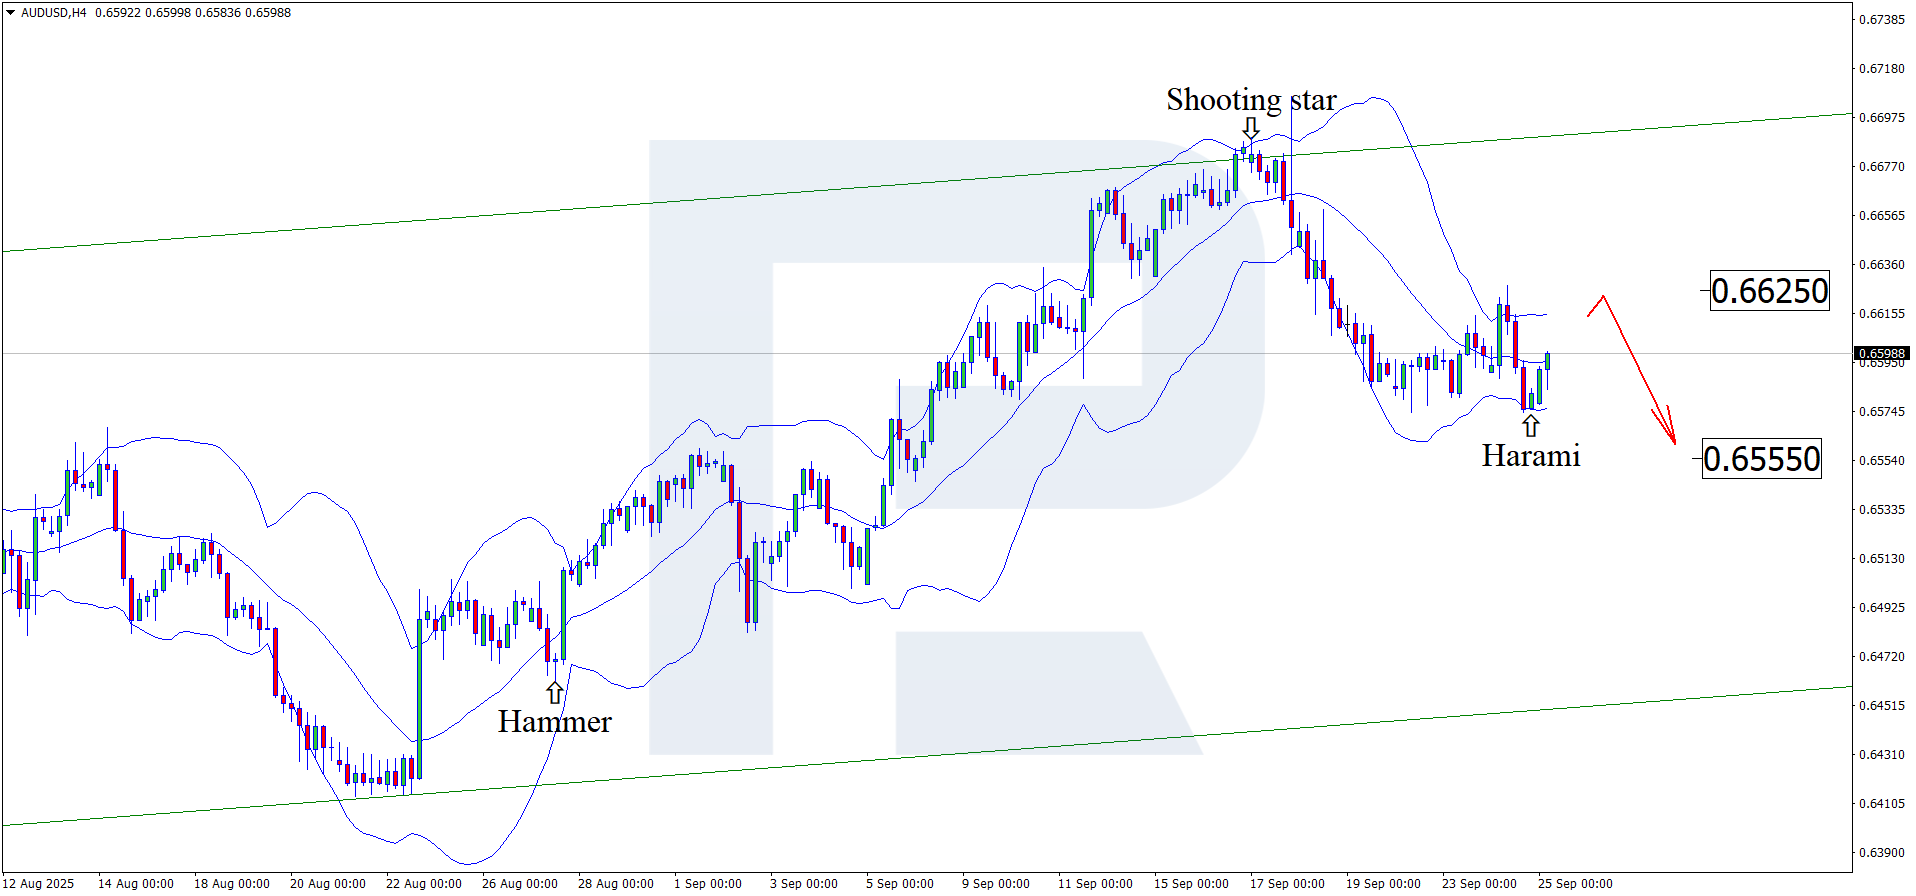
Stagnation or growth? US GDP will decide the fate of the AUDUSD rate Amid expectations of US GDP data, AUDUSD quotes may continue to decline towards 0.6555. Find out more in our analysis for 25 September 2025. AUDUSD technical analysis Having tested the lower Bollinger Band, the AUDUSD pair formed a Harami reversal pattern on the H4 chart. At this stage, it continues to develop a corrective wave following the signal received. The target for the pullback may be at the 0.6625 resistance level. The USD continues to pressure the Australian dollar ahead of key US economic data. Read more - AUDUSD Forecast Attention! Forecasts presented in this section only reflect the author’s private opinion and should not be considered as guidance for trading. RoboForex bears no responsibility for trading results based on trading recommendations described in these analytical reviews. Sincerely, The RoboForex Team
-
roboforex Market Fundamental Analysis by RoboForex
RBFX Support replied to RBFX Support's topic in Fundamental Analysis
JP 225 forecast: the index approached the upper boundary of the ascending channel and hit new all-time high The JP 225 stock index continues to rise within the ascending channel. The JP 225 forecast for today is positive. JP 225 forecast: key trading points Recent data: the Bank of Japan policy rate remains at 0.50% Market impact: the effect on the Japanese stock market is moderately positive Fundamental analysis The Bank of Japan kept its benchmark interest rate at 0.50%, in line with forecasts and the previous level. This decision signals continued cautious normalisation of monetary conditions without additional tightening that could significantly increase capital costs for corporations. Short-term uncertainty declines, and the risk premium on Japanese equities generally remains stable. For the JP 225, the impact can be described as neutral to positive. The decision was widely expected, which supports investor appetite for risk assets and allows markets to focus on corporate earnings and global demand. The yen remains a key factor: a stable or weaker currency boosts export revenue conversion, traditionally providing support for the index. RoboForex Market Analysis & Forex Forecasts Attention! Forecasts presented in this section only reflect the author’s private opinion and should not be considered as guidance for trading. RoboForex bears no responsibility for trading results based on trading recommendations described in these analytical reviews. Sincerely, The RoboForex Team -
Never tried since I have the 1.0 version and works pretty fine, só mexer had a chance to test the 1.02 version. The auto trader on the other hand seems that for some people worked and others no luck. I never tried the auto trader , my main internet is the market profile and a he volume profile one along with some little features like the market correlation tool they have.
-

HFMarkets (hfm.com): Market analysis services.
AllForexnews replied to AllForexnews's topic in Fundamental Analysis
[B]Date: 25th September 2025.[/B] [B]What Can Revive The NASDAQ?[/B] US indices continue to form bearish price patterns after Monday’s bullish spike set off pending orders and profit-taking. The bullish movement from the past weeks is largely due to projections for rate cuts as well as AI developments. However, the NASDAQ is up almost 14% in 2025 and trading close to all-time highs. For this reason, profit-taking is likely to occur. What Can Prompt The Continuation Of the Upward Trend? While the NASDAQ remains at all-time highs, investors will only be comfortable purchasing with confirmation of new, concrete price drivers. The main downside risk to the stock market is the lack of interest rate cuts from the Fed, the weakening employment sector and geopolitical tensions. Therefore, in order for demand to regain momentum and continue to push to all-time highs, investors would like to see these 3 factors not materialise. The first requirement that investors would like to see is interest rate cuts for October and December. According to Wall Street Strategist, the NASDAQ and the general stock market are not likely to continue their current trend if we do not see a minimum of 2 rate adjustments. Currently, there is a 91% chance of a 0.25% cut in October and a 74% chance for December. If economic data, such as higher inflation or a higher PCE Price Index, lowers the possibility of rate cuts, the NASDAQ is likely to retrace lower. Upcoming US News For this reason, the upcoming US Gross Domestic Product, Unemployment Claims and Durable Goods Orders are likely to be key. Ideally, investors would like to see the GDP figure read as expected, slightly higher Durable Goods and weaker Unemployment Claims. This would prompt investors to continue to believe the Federal Reserve will cut rates, but the economy is not at significant risk of a recession. The week’s main announcement will be tomorrow’s Core PCE Price Index at 12:30 GMT. Analysts expect the PCE Price Index to remain at 2.9%, but traders looking to speculate upward price movement would prefer the figure to read lower. If the PCE Price Index falls to 2.8% the NASDAQ is likely to see bullish price movement return. However, if the PCE Price Index rises to 3.00%, the decline is potentially likely to continue. The Federal Reserve In terms of commentary from the Federal Open Market Committee, most members are providing a slightly dovish tone. The latest being San Francisco’s Mary Daly, who told journalists on Wednesday, 24th, that rate cuts are likely. However, the Chairman is less convinced. The Chairman (Jerome Powell) stressed a cautious approach to monetary policy, noting the need to weigh risks from both a cooling labour market and rising inflation. He said the current 4.0–4.25% rate is high enough to contain price pressures while leaving room for quick adjustments. Earnings Reports and Fundamental Indications Lastly, October will see the start of the 3rd quarter’s quarterly earnings reports. The first earnings report which will directly influence the NASDAQ is Netflix, which is due to release its report on October 21st. Tesla will release its report the day after. Tesla is currently the 7th most influential company on the NASDAQ, while Netflix is the 9th. The results of the quarterly reports from the technology sector will be key for the NASDAQ, but it is not likely to start influencing investors until October 6th. NASDAQ (USA100) 1-Hour Chart In terms of Indications from Fundamental factors, the signals remain neutral with a slight bias towards a bullish trend. The VIX is trading lower this morning, but is still higher every week. The lower VIX is positive for the day, but only if the VIX continues to decline. Lastly, the Put to Call Order Ratio is slightly higher and moved away from its recent low. This is positive as the extremely low Ratio tends to indicate an overbought price for the NASDAQ. The High Low Index for the NASDAQ has also slightly retraced, but remains high, which also provides a bullish bias for the long-term. Key Takeaways: The NASDAQ’s rally is driven by AI optimism and expected Fed rate cuts. However, profit-taking pressures have driven the price lower. Sustained upward momentum depends on at least two Fed rate cuts, with markets pricing in October and December moves. Upcoming US economic data, especially the Core PCE Price Index, will be critical for confirming future market direction. If the PCE falls to 2.8% the NASDAQ may rebound, but a rise to 3.0% could extend declines. Tech earnings season, starting with Netflix and Tesla, will play a key role in shaping NASDAQ sentiment in October. [B]Always trade with strict risk management. Your capital is the single most important aspect of your trading business.[/B] [B]Please note that times displayed based on local time zone and are from time of writing this report.[/B] Click [URL='https://www.hfm.com/hf/en/trading-tools/economic-calendar.html'][B]HERE[/B][/URL] to access the full HFM Economic calendar. Want to learn to trade and analyse the markets? Join our webinars and get analysis and trading ideas combined with better understanding of how markets work. Click [URL='https://www.hfm.com/en/trading-tools/trading-webinars.html'][B]HERE[/B][/URL] to register for FREE! [URL='https://analysis.hfm.com/'][B]Click HERE to READ more Market news.[/B][/URL] [B]Michalis Efthymiou HFMarkets[/B] [B]Disclaimer:[/B] This material is provided as a general marketing communication for information purposes only and does not constitute an independent investment research. Nothing in this communication contains, or should be considered as containing, an investment advice or an investment recommendation or a solicitation for the purpose of buying or selling of any financial instrument. All information provided is gathered from reputable sources and any information containing an indication of past performance is not a guarantee or reliable indicator of future performance. Users acknowledge that any investment in Leveraged Products is characterized by a certain degree of uncertainty and that any investment of this nature involves a high level of risk for which the users are solely responsible and liable. We assume no liability for any loss arising from any investment made based on the information provided in this communication. This communication must not be reproduced or further distributed without our prior written permission. -
Oana SSS reacted to a post in a topic:
Edge Runner Auto (from Pro Edge Trading)
-
⭐ laser1000it reacted to a post in a topic:
S M M - NT8
-
you're lucky it doesn't work, at least you don't lose your money by seeing its inds 🙂
-
Oana SSS reacted to a post in a topic:
SBS Autotrader latest Version
-
TDUAlgoStudioProv1.2.0.0 - This version is not working and returns errors. Is it just me? Could someone please confirm. Thanks.
-
mooblar reacted to a post in a topic:
TDU 2025 indicators
-

Bayer's Cycle :Welcome for discussion and any ideas.
setare replied to setare's topic in Ask For Help
UP to see -
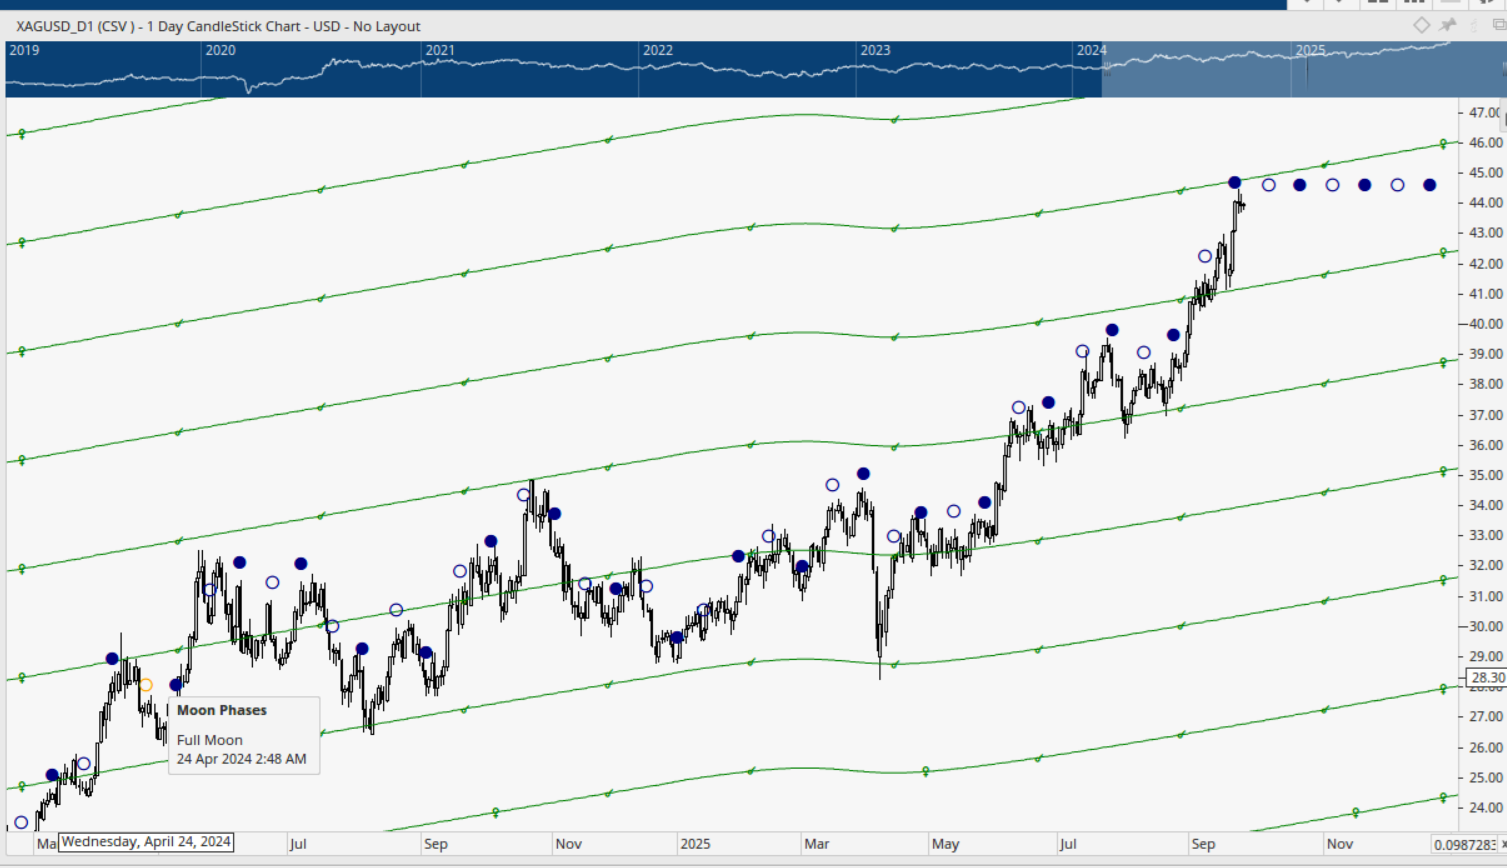
Dear FFRT , I did it, I didn't understand anything special about it. Do you understand anything from the chart? The new moon is in blue and the full moon is in a white circle.
-
setare reacted to a post in a topic:
Gann planetary lines For Silver (XAGUSD) in Optuma
-
This was his mistake
-
The definition of the word "Orderflow" includes and implies buyers and sellers. That can be pulled from a datafeed that has level 2 buying and selling quantity, and is displayed in a cumulative delta indicator, footprint chart or DOM. MT4 & MT5 datafeeds don't have that ability: they just stream the price, time & volume and plot it on your chart. The volume you are streamed contains no information about the buys or sells or who the aggressor is. Also, to have a proper view of orderflow, it needs to be a centralized exchange, meaning, exactly one exchange that all the transactions flow through - that's why having the CME/Nymex/Comex to show orderflow of ES/CL/GC works to show a complete picture of all the buying or selling. Forex transactions do not occur on a centralized exchange: there are banks and datafeeds that show a good amount of transactions that they do, but there are clearing houses and exchanges all over the major financial centers of the world, and there's no good way to have a complete picture of how much EURUSD was bought or sold at a specific price. (There are datafeeds that bring various major bank's forex data into one feed, but this gets costly, and, displaying very large actual dollar transactional volume at every pip becomes unfeasible, and generally isn't practical.)
-
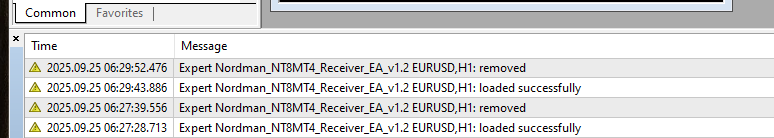
MT4 log
-
fxtrader99 reacted to a post in a topic:
TDU 2025 indicators
-
The CPI and NFP news always create high volatility. Sometimes it is better to stay out and watch the market first. I usually wait for the first reaction, then decide if I should trade. This reduces the chance of big losses. Many brokers cannot handle the fast moves. HFM still gives me good fills but I always use small lots in news time.
-
Yes. That is what I meant.
-
i dont have working version of Optuma, but you can tweak with Venus, Full and New Moon.
-
can you please calrify what you mean by "Install them on separate drives." Say 1.6 version on D drive and 2.2 on other say E drive ?
-
⭐ FFRT reacted to a post in a topic:
Optuma 2.2 requires crack
-
this is not 2025 version, old 2024 files
-
Hello friends... This indicator file is for NinjaTrader right ? Can i get one for MT4 ? Iam looking for orderflow indicator to trade XAUusd ( gold ) & Forex pairs... I have used them in NT8 when i was trading regular financial markets... But not that, i stick to Commodity & Forex markets... Iam looking for OrderFlow solution for MT4 or MT5 as I currently use MT4/MT5 for trading these pairs... please guide ... Respects & thank you
- Yesterday
-
Thank you sir. Will have a look at it
-
This a version fixed by @apmoo in march. I don't know if this is what you're looking for. orderflowlabs.com.zip
-
My bad. Try either 12345 or 123456 either one of them 2. Apologies
-
the sender ninjatrader file works well, but the mt4 ea no way, any help with this will be holy grail for me
-
Can I download it and add it to Ami Broker? It's protected.