⤴️-Paid Ad- Check advertising disclaimer here. Add your banner here.🔥
All Activity
- Past hour
-
 Kermit 1981 reacted to a post in a topic:
House Of Live Trades
Kermit 1981 reacted to a post in a topic:
House Of Live Trades
-
What I provided there is a starting point to modify. I provided the prop firm I use. The complete rules and figures for the exact account. My risk/reward for my trading and symbol. It gave very detailed pages of info. Try it on various AI's and compare the results.
-
⭐ zbear reacted to a post in a topic:
Pack 205 NinZa Indicators
-
Thank you so much @Ninja_On_The_Roof. I really appreciate your clear explanations and the time you always take to help everyone here. Your posts and clarifications are consistently useful, and all the contributions you’ve made to this forum have helped a lot of people. Thanks again for sharing your knowledge and for always pointing people in the right direction 💓
-

A new diamond in the rough- a very good educator
⭐ rcarlos1947 replied to Traderbeauty's topic in Ninja Trader 8
My experience with brokey has been excellent. I have only bought a single product from him which worked flawlessly from the start. When changes occurred in my environment that I could not resolve, He worked with Me to find a solution, sometimes my issue, sometimes his product. Each time He was respectful, methodical, and professional. It may take a couple of days for him to establish contact, but He is just a Ping away. Again, that has been my experience. -
 Eva Grey reacted to a post in a topic:
Pack 205 NinZa Indicators
Eva Grey reacted to a post in a topic:
Pack 205 NinZa Indicators
-
⭐ RichardGere reacted to a post in a topic:
Pack 205 NinZa Indicators
-
⭐ RichardGere reacted to a post in a topic:
Pack 205 NinZa Indicators
-
 @kimsam @apmoo HEKLLP IS INDICATO?
 - Today
-

roboforex Market Fundamental Analysis by RoboForex
RBFX Support replied to RBFX Support's topic in Fundamental Analysis
US 500 forecast: the index is correcting after the sell-off Amid escalating tensions in the Middle East, the US 500 plunged by 4.5% and is now undergoing a correction. The US 500 forecast for today is negative. US 500 forecast: key takeaways Recent data: US Nonfarm Payrolls came in at -92 thousand in February 2026 Market impact: the impact on the equity market is neutral Fundamental analysis The release of US Nonfarm Payrolls at -92 thousand, below a forecast of a 58 thousand gain, is a clearly negative signal for the equity market. This result means the US economy did not add jobs; on the contrary, employment declined. For the US 500 index, this typically implies stronger short-term pressure, as investors start pricing in weaker economic growth prospects, more cautious corporate guidance, and an increased risk of deteriorating company financial performance in the coming quarters. In this situation, mixed price action is most likely. Pressure may emerge first in cyclical industries whose results directly depend on the pace of economic growth. These include industrials, consumer discretionary (durable goods), transportation, financials, and parts of the materials/commodities segment. The market may begin to price in weaker revenues and slower profit growth specifically in these sectors RoboForex Market Analysis & Forex Forecasts Attention! Forecasts presented in this section only reflect the author’s private opinion and should not be considered as guidance for trading. RoboForex bears no responsibility for trading results based on trading recommendations described in these analytical reviews. Sincerely, The RoboForex Team -
omni69 reacted to a post in a topic:
DTTW - Atlas Line
-
fxtrader99 reacted to a post in a topic:
ninjastrategyloader.com
-
⭐ RichardGere reacted to a post in a topic:
DTTW - Atlas Line
-
RedVenom reacted to a post in a topic:
maverickindicators.com
-
⭐ rcarlos1947 reacted to a post in a topic:
ninjastrategyloader.com
-
I know this one is not for live trade streaming but I think this couple is pretty great. Some folks might find this helpful, educational and informative.
-
https://quaderr.com/downloads/trend-absorption/ https://quaderr.com/money-flow/ This Both are interesting someone have please share
-
It is true so, I also noticed.😂 Gross yes! But hey, if whoever, whatever could give me an edge to bring in some extra incomes, I am willing to hear him fart or burp all day and I wouldn't care much.😂
-
As for the AtlasLine, I recall that I posted it days ago somewhere. If you still need it, please let me know. I do not use it personally but hey, it is a good tool to inform you to stay with the same direction of the move. The ATO is just pretty much ORB strategy. When I first started out trading many years ago, I did buy the course. They didnt have the indicator for it back then. Just a PDF course that shows you in details how to trade it. If I recall it correctly, at 06:30AM (my Pacific time zone, for you, might be 09:30AM), you draw a vertical line at this time then at 06:52AM, you draw another vertical line at this time. Draw a horizon line for the high and the low from these two time zone. You then sit and wait for price to break out from either sides, high or low level. Then place a limit order at the exact level where price broke out, or just a tick or two from the levels. The idea here is to have price to pull back and fill you with your limit order. Target and stop, for DTTW, has always been the ATR. They set it at 4, instead of the default of 14. Round up the number a tad. Let's say, the ATR show 2.45. You would say, it is 2 points and a half. The point here is, if the ATR tells you the anticipated move is about 2 and a half point, but you decide to have your target for 5 points, then you might not see or reach that. Same idea for stop. The anticipated move, up or down is 2 and a half points but you place your stoploss for only 1 and a half point. Then you might just get whacked in the head. Regardless, to trade it correctly with DTTW stuff, when it comes to their stoplosses, they have a few different types of them. Such as time based stop. Once you are in a trade, your trade goes nowhere and there are already 5 candles or more from your entry point, it might just be time to exit for a break even or a small loss. They want to be in and out as quickly as possible. There is also another called "catastrophic stop" and more... Do watch many of their videos on YouTube to get the overall ideas so you can trade effectively.🥰 As far as for the Scalper. If you look to the left of your chart, you will see why the signals are fired. It is a break out of your left. Whether it is a support or a resistance.
-
As I have mentioned in the past. If you already have a bunch of Ninza indicators that are working perfectly for you right now, before you install any new Ninza indicator. Do go into your document/bin/custom and look for the resource file(s), copy and save it somewhere on your PC. This step is to just ensure that, if for whatever reason, you happen to screw up or to kill some of your favorite Ninza indicators from working, then you can always go back in reverse, by just copy and paste the previous saved resource file(s) back into your bin/custom folder. Instead of being stressed out and uninstalling your whole NT8 and then reinstalling it all over again and again...Saves you a whole lot of time. Eve's pack contains most of the common indicators which were previously packaged just like from N9T and Luke SteelWolf and myself recently. With the exception of some paid versions of Jumpboo$t, Captain Optimus, OmniScan, QuantumDelta... Keep in mind that, some specific Ninza indicators do need Tick data to work or to show up correctly on your charts. So before saying they do not work, make sure you enable or check that Tick data box.🤗 They should all work fine without issues with the included resource file. I wanna take a moment to once again, thank you all of them for taking the time and energy putting them altogether and sharing with us all. Great dedication and contribution! Kudos to them!🤗
-

HFMarkets (hfm.com): Market analysis services.
AllForexnews replied to AllForexnews's topic in Fundamental Analysis
Date: 10th March 2026. Gold Climbs: Will Gold Stay Within Its Current Trading Range? President Trump’s comments regarding a possible end to the Middle East conflict have calmed investors. Crude oil prices fell back to similar prices seen on Friday ($85) and the stock market rose close to last week’s highs. Investors are positively reacting to G7 nations advising that they will release part of their oil reserves to boost supply. Market sentiment also found support from Trump's comments about the Strait of Hormuz becoming operational again. However, investors are concentrating on Trump’s comments regarding the conflict ending ‘very soon’. Analysts advise that the US administration is attempting to find a way out of the conflict. Gold Prices Re-Establish Clear Correlation with the US Dollar The price of Gold rose 1.70% over the past 24 hours due to the value of the US Dollar declining. The need for safe-haven assets remains as investor confidence has not returned to healthy levels. At the same time markets do not trust any guidance given by the US President though it has been enough to create a change in trend amongst most asset categories. The price of the US Dollar is supporting higher Gold prices as are Silver and other metals. The US Dollar Index has fallen 1.23% and Silver was one of the first leading indicators signalling Gold could rebound at the $5,000 psychological price. On Monday, while Gold was declining Silver was maintaining its value and rose thereafter, indicating Gold may rebound. The decline in the US Dollar Index further validated this indicating upward price movement which has indeed materialised. Silver remains key for the analysis of Gold due to its strong correlation. According to the Silver Institute, the global silver market has entered its sixth consecutive year of structural deficit. Analysts project a 67M-ounce shortfall for 2026, while the cumulative deficit from 2021–2025 has already exceeded 800M ounces, roughly one year of global mine production. Investment demand remains the key growth driver. Physical coin and bar demand may rise 20% to 227M ounces, a three-year high. Returning Western investors and steady demand from India are supporting this growth. Meanwhile, industrial demand may fall about 2% to 650M ounces, a four-year low. Higher silver prices, often $25–$30 per ounce, are weighing on demand. Manufacturers are optimising usage and reducing silver content without affecting product performance. The correlation between Gold and the Dollar is indicating a slight risk. Gold is maintaining range-bound trading conditions staying within the $5,000 to $5,199 range. However, the US Dollar has formed a bearish breakout falling below its previous range. Therefore, there is a slight sense of divergence and limitation to Gold’s bullish possibilities in the short term. This may also indicate that the US Dollar is oversold. Like Silver, higher prices are making investors more cautious, but tomorrow’s US Consumer Price Index will be a key price driver nonetheless. For this reason, investors need to stay vigilant as the price rises to $5,200. Though according to the 200-Bar SMA, buy signals will remain as long as the price remains above $5,145. HFM - XAUUSD 1-Hour Chart The US Dollar Index The US Dollar Index is witnessing a strong decline as investors are reacting to Trump’s comments regarding an end to the conflict, but also to the improvement in the market’s risk appetite. The Dollar is the worst performing currency of the day, while the best performing is the Australian Dollar and Euro. The price of the US Dollar is partially tied to the developments in the Middle East, however, this week’s calendar also has multiple price drivers. Tomorrow’s US Consumer Price Index (inflation) can create volatility as can Thursday’s Core PCE Price Index and quarterly GDP. These figures will not include aspects of the current conflict as they reflect February’s data, but they can still create volatility and trends. If these three releases read higher than expectations, the price of the Dollar can find further support. HFM - USDX 1-Hour Chart Key Takeaways: Markets rise after President Trump signals the Middle East conflict could end soon, improving global investor sentiment. Oil prices fall toward $85 as G7 nations plan to release reserves and supply concerns ease. Gold gains 1.7% as the US dollar weakens and investors maintain demand for safe-haven assets. The Silver market remains in structural deficit, with a projected 67M-ounce shortfall in 2026. Upcoming US CPI data may drive volatility in the dollar, gold, and broader financial markets. Always trade with strict risk management. Your capital is the single most important aspect of your trading business. Please note that times displayed based on local time zone and are from time of writing this report. Click HERE to access the full HFM Economic calendar. Want to learn to trade and analyse the markets? Join our webinars and get analysis and trading ideas combined with better understanding of how markets work. Click HERE to register for FREE! Click HERE to READ more Market news. Michalis Efthymiou HFMarkets Disclaimer: This material is provided as a general marketing communication for information purposes only and does not constitute an independent investment research. Nothing in this communication contains, or should be considered as containing, an investment advice or an investment recommendation or a solicitation for the purpose of buying or selling of any financial instrument. All information provided is gathered from reputable sources and any information containing an indication of past performance is not a guarantee or reliable indicator of future performance. Users acknowledge that any investment in Leveraged Products is characterized by a certain degree of uncertainty and that any investment of this nature involves a high level of risk for which the users are solely responsible and liable. We assume no liability for any loss arising from any investment made based on the information provided in this communication. This communication must not be reproduced or further distributed without our prior written permission. -
I think the Radar indicator released for NT8 last night? Anyone have it and can share?
-
Go Eva go Eva! Thank you for the at
-
Thankyou so much brother thanks a lot
-
 Alpafore joined the community
 -
Market Technical Analysis by RoboForex
RBFX Support replied to RBFX Support's topic in Technical Analysis
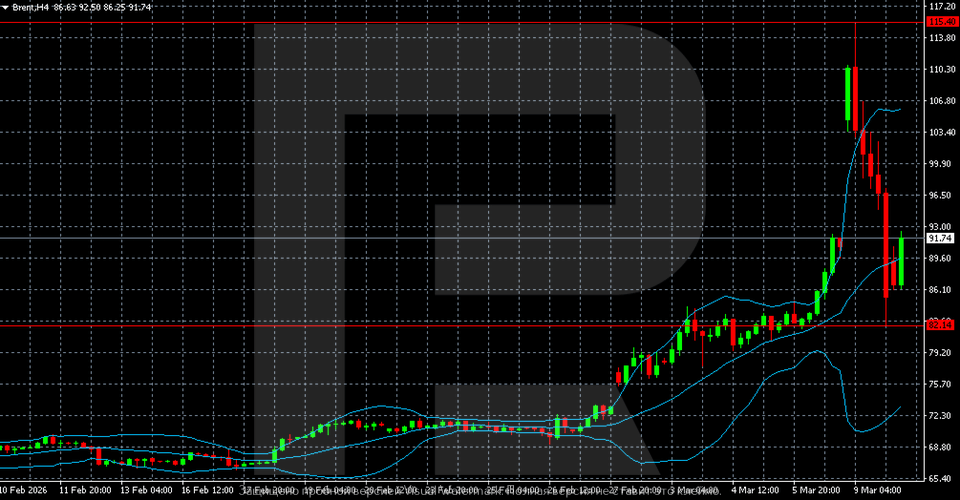
Brent retreated from the peak: all eyes on the Middle East Brent prices are falling amid geopolitical tensions, with the market watching US rhetoric on Iran. Find out more in our analysis for 10 March 2026. Technical outlook The Brent H4 chart shows a sharp increase in bullish momentum in early March. Prior to this, the market had been trading sideways around 70–74 USD per barrel, but then prices surged higher, breaking above the 82.14 level and, over several sessions, reaching an extreme near 115.40. Brent has declined and pulled back from the local high. Read more - Brent Forecast Attention! Forecasts presented in this section only reflect the author’s private opinion and should not be considered as guidance for trading. RoboForex bears no responsibility for trading results based on trading recommendations described in these analytical reviews. Sincerely, The RoboForex Team
-
RIPS may be a great trader, but I never learnt a thing from him. Also, the constant burping on his streams really puts me off. Matt’s streams (rocketscooter) are way more insightful—someone here already recommended him earlier in the thread
-
thanks eva
-
@Minigems please
-
Here you go. Cheers: https://workupload.com/archive/58UXLRJNrC
-
Woah! What a pack! Thank you! Edit: Would the resources have to be reinstalled if you installed more indicators to test out? Example: install indicator > install resources > install more indicators > reinstall resources... ?
- Yesterday
-
Here are the edu ones. Roadmap, Scalper and News. https://workupload.com/archive/t5w5Aj85S3
-
Can you share bro