⤴️-Paid Ad- Check advertising disclaimer here. Add your banner here.🔥
All Activity
- Past hour
-

HFMarkets (hfm.com): Market analysis services.
AllForexnews replied to AllForexnews's topic in Fundamental Analysis
Date: 22nd December 2025. Gold Climbs to All-Time High After Extreme Bullish Momentum. Gold’s price has witnessed one of its strongest recent gains, rising by almost 2% in a short period of time. Gold now trades at an all-time high and has broken above its key resistance level at $4,353.70. All metals trade higher on Monday a few days before Christmas including the best-performing metal, Palladium. Why is Gold’s price increasing at such speed and is the trend likely to continue in January 2026? HFM - Gold 1-Hour Chart The Federal Reserve and Interest Rates Gold has at times seen bullish impulse waves during the previous week but has been unable to maintain momentum. However, the recent inflation data and economists expecting rate cuts in 2026 are fuelling stronger momentum during today’s Asian session. The Federal Reserve in December opted for a ‘hawkish cut’, meaning they chose to cut by 0.25% but stay relatively hawkish in their guidance. The Federal Reserve gave the impression that they believe it would be appropriate to cut on one to two occasions in 2026. However, market participants are expecting a minimum of two cuts, with many pricing in three cuts. The dovish outcome has strengthened as the US inflation rate fell from 3.00% to 2.7%, the lowest since the summer. In addition, analysts forecast the Core Consumer Price Index to fall from 3.0% to 2.6%. This continues to allow the Federal Reserve more room to maneuver. Gold and Geopolitics According to analysts, the most recent demand for Gold is not derived from Central Banks and governments due to global risks. Reports indicate Gold’s demand is largely coming from large funds and institutions. Nonetheless, the geopolitical sphere is a key element further driving investors to Gold. The war between Russia and Ukraine is still actively ongoing, even though there has been nearly a month of fairly intense negotiations involving the US, EU, Ukraine, and Russia. However, a recent important factor is developments in Venezuela. Last week, US President Donald Trump labelled the Venezuelan government a ‘terrorist organization’ and announced a full naval blockade of oil tankers travelling to or from the country. A day earlier, reports said US ships were tracking another vessel, marking the third such incident in recent days. While experts do not rule out ground operations or airstrikes, Trump does not appear eager to further escalate the situation. That said, since September, the US has targeted more than 20 ships in the Caribbean Sea suspected of drug trafficking. Meanwhile, volatility in the precious metals market has declined again. Data from the Chicago Mercantile Exchange (CME Group) shows that on Friday, investors held 181.09 thousand gold futures contracts and 84.84 thousand options contracts. This compares with last week’s average levels of 217.50 thousand futures contracts and 72.00 thousand options contracts. The US Dollar - A Key Risk For Gold? Even though Gold’s trend is in line with most analysts’ guidance and expectations, key risks do remain. The US Dollar and Gold are known to be inversely correlated. However, the price of the US Dollar is not necessarily declining enough in order to warrant such a large price movement for Gold. The US Dollar is witnessing a slight decline on Monday, however, it remains higher than last week’s market open price. In addition, the global stock market remains strong which again does not warrant such high demand for safe-haven assets. For this reason, even though the trend cannot be ignored or denied, caution regarding retracements and corrections is advisable, according to most analysts. If the price is to correct, price action points towards a potential decline to the range between $4,356.40 and $4,474.80. Key Takeaway Points: Gold hit record highs, rising nearly 2% and breaking key resistance at $4,353.70, with other metals also advancing. Falling inflation and expected 2026 rate cuts are strengthening gold’s momentum despite the Fed’s relatively hawkish guidance. Geopolitical tensions, especially Ukraine and Venezuela developments, are increasing safe-haven demand from large funds and institutions. Correction risks remain, as the US Dollar stays firm and equities remain strong. If a retracement is to form, potential pullbacks could aim for the $4,356-$4,475 range. Always trade with strict risk management. Your capital is the single most important aspect of your trading business. Please note that times displayed based on local time zone and are from time of writing this report. Click HERE to access the full HFM Economic calendar. Want to learn to trade and analyse the markets? Join our webinars and get analysis and trading ideas combined with better understanding of how markets work. Click HERE to register for FREE! Click HERE to READ more Market news. Michalis Efthymiou HFMarkets Disclaimer: This material is provided as a general marketing communication for information purposes only and does not constitute an independent investment research. Nothing in this communication contains, or should be considered as containing, an investment advice or an investment recommendation or a solicitation for the purpose of buying or selling of any financial instrument. All information provided is gathered from reputable sources and any information containing an indication of past performance is not a guarantee or reliable indicator of future performance. Users acknowledge that any investment in Leveraged Products is characterized by a certain degree of uncertainty and that any investment of this nature involves a high level of risk for which the users are solely responsible and liable. We assume no liability for any loss arising from any investment made based on the information provided in this communication. This communication must not be reproduced or further distributed without our prior written permission. -

Anyone can convert these pinescript to ninjascript please
david replied to TRADER's topic in Ninja Trader 8
#region Using declarations using System; using System.Collections.Generic; using System.ComponentModel; using System.ComponentModel.DataAnnotations; using System.Linq; using System.Text; using System.Threading.Tasks; using System.Windows; using System.Windows.Input; using System.Windows.Media; using System.Xml.Serialization; using NinjaTrader.Cbi; using NinjaTrader.Gui; using NinjaTrader.Gui.Chart; using NinjaTrader.Gui.SuperDom; using NinjaTrader.Gui.Tools; using NinjaTrader.Data; using NinjaTrader.NinjaScript; using NinjaTrader.Core.FloatingPoint; using NinjaTrader.NinjaScript.DrawingTools; #endregion // Définition des Enums dans l'espace global pour éviter les erreurs CS0246 namespace NinjaTrader.NinjaScript.Indicators { public enum RSIPivotBreaks_MaType { SMA, EMA, SMMA, WMA } public enum RSIPivotBreaks_Source { RSI, MA_RSI } } namespace NinjaTrader.NinjaScript.Indicators { public class RSIPivotBreaks : Indicator { #region Internal Classes private class ActiveLine { public string Tag; public double Level; public bool IsHighPivot; public int StartBarIndex; public bool IsAlive; } #endregion #region Variables private RSI _rsi; private Series<double> _maSeries; private Series<double> _srcSeries; private List<ActiveLine> _activeLines = new List<ActiveLine>(); private int _lineCounter = 0; // Visual Brushes private Brush _bullishHighlightBrush; private Brush _bearishHighlightBrush; private Brush _rsiBullBrush; private Brush _rsiBearBrush; private Brush _obGradientBrush; private Brush _osGradientBrush; #endregion #region Properties (Inputs) [Range(1, int.MaxValue), NinjaScriptProperty] [Display(Name = "RSI Length", GroupName = "Inputs", Order = 1)] public int RsiLength { get; set; } [Range(1, int.MaxValue), NinjaScriptProperty] [Display(Name = "MA Length", GroupName = "Inputs", Order = 2)] public int MaLen { get; set; } [NinjaScriptProperty] [Display(Name = "MA Type", GroupName = "Inputs", Order = 3)] public NinjaTrader.NinjaScript.Indicators.RSIPivotBreaks_MaType MaType { get; set; } [NinjaScriptProperty] [Display(Name = "Pivot Source", GroupName = "Inputs", Order = 4)] public NinjaTrader.NinjaScript.Indicators.RSIPivotBreaks_Source PivotSourceOpt { get; set; } [Range(1, int.MaxValue), NinjaScriptProperty] [Display(Name = "Pivot Left", GroupName = "Pivot Settings", Order = 1)] public int PivotLeft { get; set; } [Range(1, int.MaxValue), NinjaScriptProperty] [Display(Name = "Pivot Right", GroupName = "Pivot Settings", Order = 2)] public int PivotRight { get; set; } [Range(0, 100), NinjaScriptProperty] [Display(Name = "Pivot High Min", GroupName = "Pivot Filters", Order = 1)] public int HiFilterMin { get; set; } [Range(0, 100), NinjaScriptProperty] [Display(Name = "Pivot High Max", GroupName = "Pivot Filters", Order = 2)] public int HiFilterMax { get; set; } [Range(0, 100), NinjaScriptProperty] [Display(Name = "Pivot Low Min", GroupName = "Pivot Filters", Order = 3)] public int LoFilterMin { get; set; } [Range(0, 100), NinjaScriptProperty] [Display(Name = "Pivot Low Max", GroupName = "Pivot Filters", Order = 4)] public int LoFilterMax { get; set; } [Range(0, 100), NinjaScriptProperty] [Display(Name = "OB Level", GroupName = "Levels", Order = 1)] public int ObLevel { get; set; } [Range(0, 100), NinjaScriptProperty] [Display(Name = "OS Level", GroupName = "Levels", Order = 2)] public int OsLevel { get; set; } [NinjaScriptProperty] [Display(Name = "Show RSI Signal Color", GroupName = "Visuals", Order = 1)] public bool ShowRsiSignal { get; set; } [NinjaScriptProperty] [Display(Name = "Show MA", GroupName = "Visuals", Order = 2)] public bool ShowMaRsi { get; set; } [NinjaScriptProperty] [Display(Name = "Use Gradient Regions", GroupName = "Visuals", Order = 3)] public bool UseGradient { get; set; } [XmlIgnore] [Display(Name = "Bullish Highlight", GroupName = "Colors", Order = 1)] public Brush BullishColor { get; set; } [Browsable(false)] public string BullishColorSerial { get { return Serialize.BrushToString(BullishColor); } set { BullishColor = Serialize.StringToBrush(value); } } [XmlIgnore] [Display(Name = "Bearish Highlight", GroupName = "Colors", Order = 2)] public Brush BearishColor { get; set; } [Browsable(false)] public string BearishColorSerial { get { return Serialize.BrushToString(BearishColor); } set { BearishColor = Serialize.StringToBrush(value); } } [XmlIgnore] [Display(Name = "RSI Bull Color", GroupName = "Colors", Order = 3)] public Brush RsiBullCol { get; set; } [Browsable(false)] public string RsiBullColSerial { get { return Serialize.BrushToString(RsiBullCol); } set { RsiBullCol = Serialize.StringToBrush(value); } } [XmlIgnore] [Display(Name = "RSI Bear Color", GroupName = "Colors", Order = 4)] public Brush RsiBearCol { get; set; } [Browsable(false)] public string RsiBearColSerial { get { return Serialize.BrushToString(RsiBearCol); } set { RsiBearCol = Serialize.StringToBrush(value); } } [XmlIgnore] [Display(Name = "Pivot High Line Color", GroupName = "Colors", Order = 5)] public Brush ObLineColor { get; set; } [Browsable(false)] public string ObLineColorSerial { get { return Serialize.BrushToString(ObLineColor); } set { ObLineColor = Serialize.StringToBrush(value); } } [XmlIgnore] [Display(Name = "Pivot Low Line Color", GroupName = "Colors", Order = 6)] public Brush OsLineColor { get; set; } [Browsable(false)] public string OsLineColorSerial { get { return Serialize.BrushToString(OsLineColor); } set { OsLineColor = Serialize.StringToBrush(value); } } #endregion protected override void OnStateChange() { if (State == State.SetDefaults) { Description = "RSI Pivot Breaks converted from Pine Script"; Name = "RSIPivotBreaks"; // IMPORTANT: Calculate.OnPriceChange permet de voir l'indicateur bouger en live Calculate = Calculate.OnPriceChange; IsOverlay = false; // L'indicateur s'affiche dans un panneau séparé DisplayInDataBox = true; DrawOnPricePanel = false; PaintPriceMarkers = true; ScaleJustification = ScaleJustification.Right; IsSuspendedWhileInactive = true; // Inputs par défaut RsiLength = 14; MaLen = 14; MaType = RSIPivotBreaks_MaType.EMA; PivotSourceOpt = RSIPivotBreaks_Source.RSI; PivotLeft = 5; PivotRight = 5; HiFilterMin = 0; HiFilterMax = 60; LoFilterMin = 40; LoFilterMax = 100; ObLevel = 70; OsLevel = 30; ShowRsiSignal = true; ShowMaRsi = true; UseGradient = true; // Couleurs BullishColor = Brushes.LightGreen; BearishColor = Brushes.LightPink; RsiBullCol = Brushes.Green; RsiBearCol = Brushes.Red; ObLineColor = Brushes.Red; OsLineColor = Brushes.Green; // Plots AddPlot(new Stroke(Brushes.Gray, 2), PlotStyle.Line, "RSI"); AddPlot(new Stroke(Brushes.Yellow, 2), PlotStyle.Line, "MA_RSI"); // Lignes statiques AddLine(new Stroke(Brushes.Gray, DashStyleHelper.Dash, 1), 50, "MidLine"); AddLine(new Stroke(Brushes.Red, 1), ObLevel, "OB"); AddLine(new Stroke(Brushes.Green, 1), OsLevel, "OS"); } else if (State == State.Configure) { _rsi = RSI(RsiLength, 3); // Préparation des pinceaux _bullishHighlightBrush = BullishColor.Clone(); if (_bullishHighlightBrush.CanFreeze) _bullishHighlightBrush.Freeze(); _bearishHighlightBrush = BearishColor.Clone(); if (_bearishHighlightBrush.CanFreeze) _bearishHighlightBrush.Freeze(); _rsiBullBrush = RsiBullCol.Clone(); if (_rsiBullBrush.CanFreeze) _rsiBullBrush.Freeze(); _rsiBearBrush = RsiBearCol.Clone(); if (_rsiBearBrush.CanFreeze) _rsiBearBrush.Freeze(); _obGradientBrush = new SolidColorBrush(Color.FromArgb(30, 200, 0, 0)); if (_obGradientBrush.CanFreeze) _obGradientBrush.Freeze(); _osGradientBrush = new SolidColorBrush(Color.FromArgb(30, 0, 200, 0)); if (_osGradientBrush.CanFreeze) _osGradientBrush.Freeze(); _maSeries = new Series<double>(this); _srcSeries = new Series<double>(this); } } protected override void OnBarUpdate() { // Vérification stricte pour éviter les erreurs au démarrage if (CurrentBar < RsiLength + MaLen + Math.Max(PivotLeft, PivotRight) + 1) return; // 1. Calcul RSI double currentRsi = _rsi[0]; Values[0][0] = currentRsi; // 2. Calcul RSI MA double currentMa = 0; switch (MaType) { case RSIPivotBreaks_MaType.SMA: currentMa = SMA(Values[0], MaLen)[0]; break; case RSIPivotBreaks_MaType.EMA: currentMa = EMA(Values[0], MaLen)[0]; break; case RSIPivotBreaks_MaType.WMA: currentMa = WMA(Values[0], MaLen)[0]; break; case RSIPivotBreaks_MaType.SMMA: currentMa = IndicatorProxy_SMMA(Values[0], MaLen); break; } _maSeries[0] = currentMa; if (ShowMaRsi) Values[1][0] = currentMa; else Values[1].Reset(); // 3. Source du pivot double srcVal = (PivotSourceOpt == RSIPivotBreaks_Source.MA_RSI) ? currentMa : currentRsi; _srcSeries[0] = srcVal; // 4. Couleur du RSI if (ShowRsiSignal) PlotBrushes[0][0] = currentRsi >= 50 ? _rsiBullBrush : _rsiBearBrush; else PlotBrushes[0][0] = Brushes.Gray; // 5. Détection des Pivots (Lookback) int pivotIndex = PivotRight; double candVal = _srcSeries[pivotIndex]; bool isPivotHigh = true; for (int i = 0; i < PivotRight; i++) if (_srcSeries[i] >= candVal) { isPivotHigh = false; break; } if (isPivotHigh) for (int i = 1; i <= PivotLeft; i++) if (_srcSeries[pivotIndex + i] > candVal) { isPivotHigh = false; break; } bool isPivotLow = true; for (int i = 0; i < PivotRight; i++) if (_srcSeries[i] <= candVal) { isPivotLow = false; break; } if (isPivotLow) for (int i = 1; i <= PivotLeft; i++) if (_srcSeries[pivotIndex + i] < candVal) { isPivotLow = false; break; } // Création des lignes if (isPivotHigh && candVal >= HiFilterMin && candVal <= HiFilterMax) { string tag = "PH_" + _lineCounter++; Draw.Line(this, tag, false, PivotRight, candVal, 0, candVal, ObLineColor, DashStyleHelper.Solid, 2); _activeLines.Add(new ActiveLine { Tag = tag, Level = candVal, IsHighPivot = true, StartBarIndex = CurrentBar - PivotRight, IsAlive = true }); } if (isPivotLow && candVal >= LoFilterMin && candVal <= LoFilterMax) { string tag = "PL_" + _lineCounter++; Draw.Line(this, tag, false, PivotRight, candVal, 0, candVal, OsLineColor, DashStyleHelper.Solid, 2); _activeLines.Add(new ActiveLine { Tag = tag, Level = candVal, IsHighPivot = false, StartBarIndex = CurrentBar - PivotRight, IsAlive = true }); } // 6. Gestion des cassures et extension des lignes bool highlightBull = false; bool highlightBear = false; // On utilise une boucle inversée pour la performance for (int i = _activeLines.Count - 1; i >= 0; i--) { ActiveLine lineObj = _activeLines[i]; if (!lineObj.IsAlive) continue; // Mise à jour visuelle (étendre la ligne jusqu'à la bougie actuelle) Draw.Line(this, lineObj.Tag, false, CurrentBar - lineObj.StartBarIndex, lineObj.Level, 0, lineObj.Level, lineObj.IsHighPivot ? ObLineColor : OsLineColor, DashStyleHelper.Solid, 2); if (lineObj.IsHighPivot) { if (srcVal > lineObj.Level) // Cassure Haussière { lineObj.IsAlive = false; highlightBull = true; Alert("BullBreak", Priority.Medium, "RSI Broke Pivot High", "Alert4.wav", 10, Brushes.Black, Brushes.Green); } } else { if (srcVal < lineObj.Level) // Cassure Baissière { lineObj.IsAlive = false; highlightBear = true; Alert("BearBreak", Priority.Medium, "RSI Broke Pivot Low", "Alert4.wav", 10, Brushes.Black, Brushes.Red); } } } // Nettoyage mémoire if (_activeLines.Count > 500) _activeLines.RemoveAll(x => !x.IsAlive); if (_activeLines.Count > 500) _activeLines.RemoveRange(0, _activeLines.Count - 500); // 7. Background Highlights if (highlightBull) BackBrush = _bullishHighlightBrush; if (highlightBear) BackBrush = _bearishHighlightBrush; // 8. Gradient Regions (SIMPLIFIÉ) // Note : Si l'affichage plante encore, passez UseGradient à false dans les paramètres if (UseGradient) { // On dessine simplement deux grandes zones fixes si possible, ou on utilise le Draw.Rectangle léger try { Draw.Rectangle(this, "OBZone_" + CurrentBar, false, 0, 100, 0, ObLevel, Brushes.Transparent, _obGradientBrush, 30); Draw.Rectangle(this, "OSZone_" + CurrentBar, false, 0, OsLevel, 0, 0, Brushes.Transparent, _osGradientBrush, 30); } catch { } // Ignorer les erreurs de dessin pour ne pas planter l'indicateur } } // Helper pour SMMA (évite les erreurs d'index) private double IndicatorProxy_SMMA(ISeries<double> input, int period) { if (CurrentBar < period) return input[0]; double prev = (CurrentBar == period) ? SMA(input, period)[1] : _maSeries[1]; return (prev * (period - 1) + input[0]) / period; } } } #region NinjaScript generated code. Neither change nor remove. namespace NinjaTrader.NinjaScript.Indicators { public partial class Indicator : NinjaTrader.Gui.NinjaScript.IndicatorRenderBase { private RSIPivotBreaks[] cacheRSIPivotBreaks; public RSIPivotBreaks RSIPivotBreaks(int rsiLength, int maLen, NinjaTrader.NinjaScript.Indicators.RSIPivotBreaks_MaType maType, NinjaTrader.NinjaScript.Indicators.RSIPivotBreaks_Source pivotSourceOpt, int pivotLeft, int pivotRight, int hiFilterMin, int hiFilterMax, int loFilterMin, int loFilterMax, int obLevel, int osLevel, bool showRsiSignal, bool showMaRsi, bool useGradient) { return RSIPivotBreaks(Input, rsiLength, maLen, maType, pivotSourceOpt, pivotLeft, pivotRight, hiFilterMin, hiFilterMax, loFilterMin, loFilterMax, obLevel, osLevel, showRsiSignal, showMaRsi, useGradient); } public RSIPivotBreaks RSIPivotBreaks(ISeries<double> input, int rsiLength, int maLen, NinjaTrader.NinjaScript.Indicators.RSIPivotBreaks_MaType maType, NinjaTrader.NinjaScript.Indicators.RSIPivotBreaks_Source pivotSourceOpt, int pivotLeft, int pivotRight, int hiFilterMin, int hiFilterMax, int loFilterMin, int loFilterMax, int obLevel, int osLevel, bool showRsiSignal, bool showMaRsi, bool useGradient) { if (cacheRSIPivotBreaks != null) for (int idx = 0; idx < cacheRSIPivotBreaks.Length; idx++) if (cacheRSIPivotBreaks[idx] != null && cacheRSIPivotBreaks[idx].RsiLength == rsiLength && cacheRSIPivotBreaks[idx].MaLen == maLen && cacheRSIPivotBreaks[idx].MaType == maType && cacheRSIPivotBreaks[idx].PivotSourceOpt == pivotSourceOpt && cacheRSIPivotBreaks[idx].PivotLeft == pivotLeft && cacheRSIPivotBreaks[idx].PivotRight == pivotRight && cacheRSIPivotBreaks[idx].HiFilterMin == hiFilterMin && cacheRSIPivotBreaks[idx].HiFilterMax == hiFilterMax && cacheRSIPivotBreaks[idx].LoFilterMin == loFilterMin && cacheRSIPivotBreaks[idx].LoFilterMax == loFilterMax && cacheRSIPivotBreaks[idx].ObLevel == obLevel && cacheRSIPivotBreaks[idx].OsLevel == osLevel && cacheRSIPivotBreaks[idx].ShowRsiSignal == showRsiSignal && cacheRSIPivotBreaks[idx].ShowMaRsi == showMaRsi && cacheRSIPivotBreaks[idx].UseGradient == useGradient && cacheRSIPivotBreaks[idx].EqualsInput(input)) return cacheRSIPivotBreaks[idx]; return CacheIndicator<RSIPivotBreaks>(new RSIPivotBreaks(){ RsiLength = rsiLength, MaLen = maLen, MaType = maType, PivotSourceOpt = pivotSourceOpt, PivotLeft = pivotLeft, PivotRight = pivotRight, HiFilterMin = hiFilterMin, HiFilterMax = hiFilterMax, LoFilterMin = loFilterMin, LoFilterMax = loFilterMax, ObLevel = obLevel, OsLevel = osLevel, ShowRsiSignal = showRsiSignal, ShowMaRsi = showMaRsi, UseGradient = useGradient }, input, ref cacheRSIPivotBreaks); } } } namespace NinjaTrader.NinjaScript.MarketAnalyzerColumns { public partial class MarketAnalyzerColumn : MarketAnalyzerColumnBase { public Indicators.RSIPivotBreaks RSIPivotBreaks(int rsiLength, int maLen, NinjaTrader.NinjaScript.Indicators.RSIPivotBreaks_MaType maType, NinjaTrader.NinjaScript.Indicators.RSIPivotBreaks_Source pivotSourceOpt, int pivotLeft, int pivotRight, int hiFilterMin, int hiFilterMax, int loFilterMin, int loFilterMax, int obLevel, int osLevel, bool showRsiSignal, bool showMaRsi, bool useGradient) { return indicator.RSIPivotBreaks(Input, rsiLength, maLen, maType, pivotSourceOpt, pivotLeft, pivotRight, hiFilterMin, hiFilterMax, loFilterMin, loFilterMax, obLevel, osLevel, showRsiSignal, showMaRsi, useGradient); } public Indicators.RSIPivotBreaks RSIPivotBreaks(ISeries<double> input , int rsiLength, int maLen, NinjaTrader.NinjaScript.Indicators.RSIPivotBreaks_MaType maType, NinjaTrader.NinjaScript.Indicators.RSIPivotBreaks_Source pivotSourceOpt, int pivotLeft, int pivotRight, int hiFilterMin, int hiFilterMax, int loFilterMin, int loFilterMax, int obLevel, int osLevel, bool showRsiSignal, bool showMaRsi, bool useGradient) { return indicator.RSIPivotBreaks(input, rsiLength, maLen, maType, pivotSourceOpt, pivotLeft, pivotRight, hiFilterMin, hiFilterMax, loFilterMin, loFilterMax, obLevel, osLevel, showRsiSignal, showMaRsi, useGradient); } } } namespace NinjaTrader.NinjaScript.Strategies { public partial class Strategy : NinjaTrader.Gui.NinjaScript.StrategyRenderBase { public Indicators.RSIPivotBreaks RSIPivotBreaks(int rsiLength, int maLen, NinjaTrader.NinjaScript.Indicators.RSIPivotBreaks_MaType maType, NinjaTrader.NinjaScript.Indicators.RSIPivotBreaks_Source pivotSourceOpt, int pivotLeft, int pivotRight, int hiFilterMin, int hiFilterMax, int loFilterMin, int loFilterMax, int obLevel, int osLevel, bool showRsiSignal, bool showMaRsi, bool useGradient) { return indicator.RSIPivotBreaks(Input, rsiLength, maLen, maType, pivotSourceOpt, pivotLeft, pivotRight, hiFilterMin, hiFilterMax, loFilterMin, loFilterMax, obLevel, osLevel, showRsiSignal, showMaRsi, useGradient); } public Indicators.RSIPivotBreaks RSIPivotBreaks(ISeries<double> input , int rsiLength, int maLen, NinjaTrader.NinjaScript.Indicators.RSIPivotBreaks_MaType maType, NinjaTrader.NinjaScript.Indicators.RSIPivotBreaks_Source pivotSourceOpt, int pivotLeft, int pivotRight, int hiFilterMin, int hiFilterMax, int loFilterMin, int loFilterMax, int obLevel, int osLevel, bool showRsiSignal, bool showMaRsi, bool useGradient) { return indicator.RSIPivotBreaks(input, rsiLength, maLen, maType, pivotSourceOpt, pivotLeft, pivotRight, hiFilterMin, hiFilterMax, loFilterMin, loFilterMax, obLevel, osLevel, showRsiSignal, showMaRsi, useGradient); } } } #endregion - Today
-

roboforex Market Fundamental Analysis by RoboForex
RBFX Support replied to RBFX Support's topic in Fundamental Analysis
USDCAD: the pair attempts an upside reversal USDCAD has halted its decline and is attempting to reverse higher, having received buyer support near the 1.3730 area. Details — in our analysis for 22 December 2025. USDCAD forecast: key trading points Market focus: Retail sales in Canada rose by 1.2% in November Current trend: an upward correction is observed USDCAD forecast for 22 December 2025: 1.3730 and 1.3870 Fundamental analysis According to data released on Friday, retail sales in Canada increased by 1.2% month-on-month in November 2025. This marked the strongest growth in five months, rebounding after a 0.2% decline in October. Meanwhile, oil prices are attempting to recover as markets assess the risk of additional U.S. sanctions against Russia and potential supply disruptions linked to the blockade of Venezuelan oil tankers. These factors provide support for Canadian oil exporters. RoboForex Market Analysis & Forex Forecasts Attention! Forecasts presented in this section only reflect the author’s private opinion and should not be considered as guidance for trading. RoboForex bears no responsibility for trading results based on trading recommendations described in these analytical reviews. Sincerely, The RoboForex Team -
Market Technical Analysis by RoboForex
RBFX Support replied to RBFX Support's topic in Technical Analysis
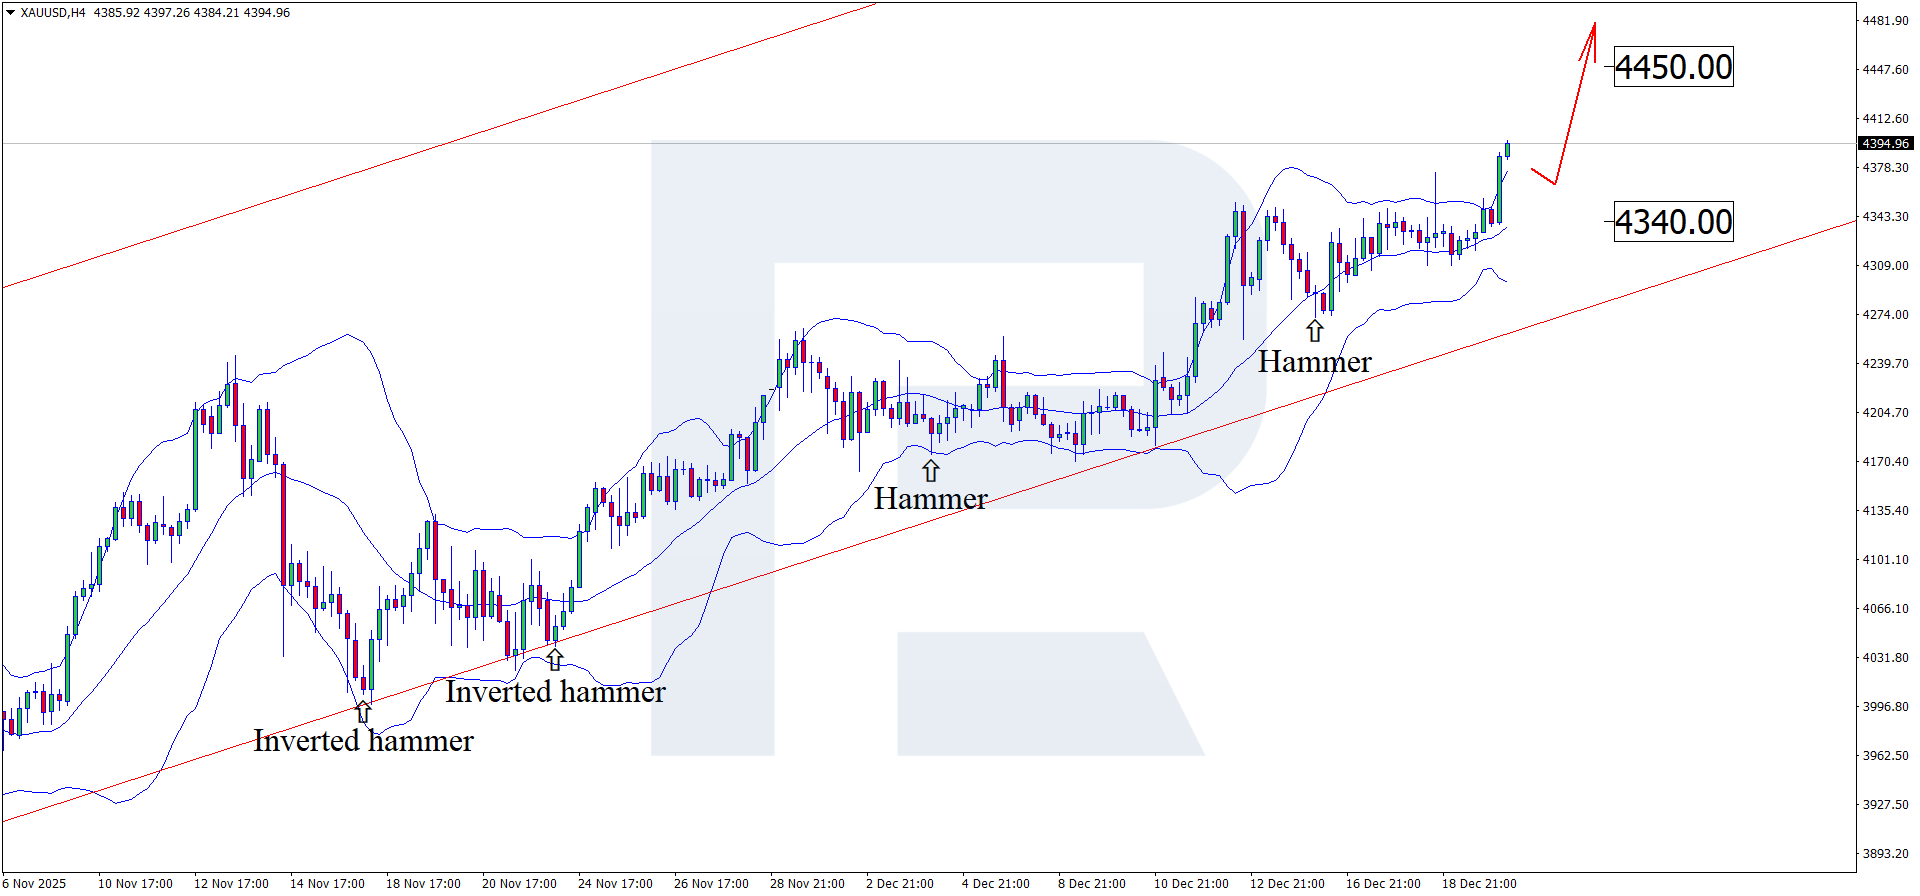
The Fed pushes gold higher: XAUUSD updates its all-time high The Fed’s interest rate cut continues to support gold. XAUUSD has updated its all-time high and is trading near the 4,395 USD level. Details — in our analysis for 22 December 2025. XAUUSD technical analysis On the H4 chart, XAUUSD formed a Hammer reversal pattern near the middle Bollinger Band. At this stage, the price continues its upward wave as part of the pattern’s realization. Given that XAUUSD quotes remain within an ascending channel, the next upside target may be the 4,450 USD level. The XAUUSD forecast for December 22, 2025 is fully bullish for gold. Read more - Gold Forecast Attention! Forecasts presented in this section only reflect the author’s private opinion and should not be considered as guidance for trading. RoboForex bears no responsibility for trading results based on trading recommendations described in these analytical reviews. Sincerely, The RoboForex Team
-
 Wannabetrader reacted to a post in a topic:
quantvue.io
Wannabetrader reacted to a post in a topic:
quantvue.io
-
 Philopro joined the community
 -
Final Year End December 19 2025 update: I think the projections have caught the year's price action very closely. Reflecting on the accuracy of 2024 and now 2025 projections (shown in green in the charts linked below), to me it seems that this is now proven accurate enough to have confidence in for future projections. Roll on for the 2026 projections! I won’t be posting anymore, but thanks to all those who have followed and DM’d. https://imgur.com/a/MdYVs2M
-
 Wannabetrader reacted to a post in a topic:
S M M - NT8
Wannabetrader reacted to a post in a topic:
S M M - NT8
-
Wannabetrader reacted to a post in a topic:
NQ Ultra - Futures Trading Bot // https://tradegreater.com/
-

anyone have Hameral orderflow version prenium please
ngatho254 replied to TRADER's topic in Ninja Trader 8
bump -
Daimon Rigor reacted to a post in a topic:
Sentient Trader 4.04.17
-
My favourites at the moment: -TradeTerminator -NQ Ultra -QKronos -Raja (still under testing but looks kinda good)
-

NQ Ultra - Futures Trading Bot // https://tradegreater.com/
N9T replied to luludulu's topic in Ninja Trader 8
Here you go: https://limewire.com/d/OMPwT#SMEsRKFB38 Few notes: On NQ, I use it on pro-edge bars HA, 200 ticks for scalping pre-market. For NY AM session, I use it on regular HA, 5 minutes, start at 9:45. I adjust start time if there are impacting news. on GC, pro-edge HA 500 ticks. I usually stop GC during NY session and only focus on NQ. I apply my bots to minis but cross order to micros. -

NQ Ultra - Futures Trading Bot // https://tradegreater.com/
Wannabetrader replied to luludulu's topic in Ninja Trader 8
Can u please share it again? its expired -
⭐ aniketp007 reacted to a post in a topic:
IndicatorMall
-
did you find any profitable settings?
-
can you share some of your other profitable bots please
-

Anyone can convert these pinescript to ninjascript please
⭐ FFRT replied to TRADER's topic in Ninja Trader 8
Try it any Any AI like Gemini or ChatGPT etc and test it -
⭐ FFRT reacted to a post in a topic:
Hawks latest version
-
NQ Ultra - Futures Trading Bot // https://tradegreater.com/
N9T replied to luludulu's topic in Ninja Trader 8
Latest version introduce some license key against the machine ID. It doesnt work on my educated NT. Hopefully, our educators can overcome this. -

LegendaryTrader Indicator - Newest Versions
Bluefox8788 replied to Ricardo44's topic in Ninja Trader 8
which version of Predator was this made with? -
Hameral Trading Systems - Hameral
-
 Rodrigo joined the community
 -
Thanks @apmoo
-
N9T reacted to a post in a topic:
IndicatorMall
-
N9T reacted to a post in a topic:
S M M - NT8
- Yesterday
-
techfo reacted to a post in a topic:
TradewithRaja
-
NQ Ultra - Futures Trading Bot // https://tradegreater.com/
N9T replied to luludulu's topic in Ninja Trader 8
Latest version 3.4.8 for education, pls: https://limewire.com/d/rbhxZ#dbi4eT6kXm @apmoo, @kimsam -
@apmoo @kimsam Thanks 🙏
-

TDU footprint v.2.0.14 zip + Big trades v1.0.0.9 - new features
Wethekings replied to sarutobi's topic in Ninja Trader 8
Just tried this. Says I need to have a an email and id. Anyone know why such a sudden change? -
need edu https://workupload.com/file/pcWu5g4GsaT
-
up
-
This indicator needs educating, at your convenience of course @apmoo@kimsam Btw, Thank you for what you do !!! IMImbalances.zip
-
- 3
-