

⤴️-Paid Ad- Check advertising disclaimer here. Add your banner here.🔥
All Activity
- Past hour
-

Anybody can recommend a broker for News trading??
bluemac replied to venturefx's topic in Forex Brokers
True. Question: How do you check execution history? I do 2 things: 1. Open demo and live tick chart during CPI, record spread spike screenshot 2. Check last 3 news, did the broker give off-quotes? How long freeze? HFM was clean for me last CPI, slipped but filled. Some brokers freeze 10 sec, that’s worse than slippage. What was your worst slippage on HFM vs IB during NFP? Mine HFM with 14 pips Gold, IB with 9 pips. Size matters, what lot you used? -
Great point since swap and slippage are actually the hidden killers. Do you close before news or hold? I used to hold, thought the spread can be the same. Then saw Gold slipped 2$ on NFP and hit SL that was never hit on demo price. Now rule: Demo to check, live to trade only London/NY, close before high impact, no Wed hold unless swap positive. How much slippage you saw on HFM during last CPI? Mine was around 18 pips on XAU.
- Today
-
 calvin joined the community
 -

Market Technical Analysis by RoboForex
RBFX Support replied to RBFX Support's topic in Technical Analysis
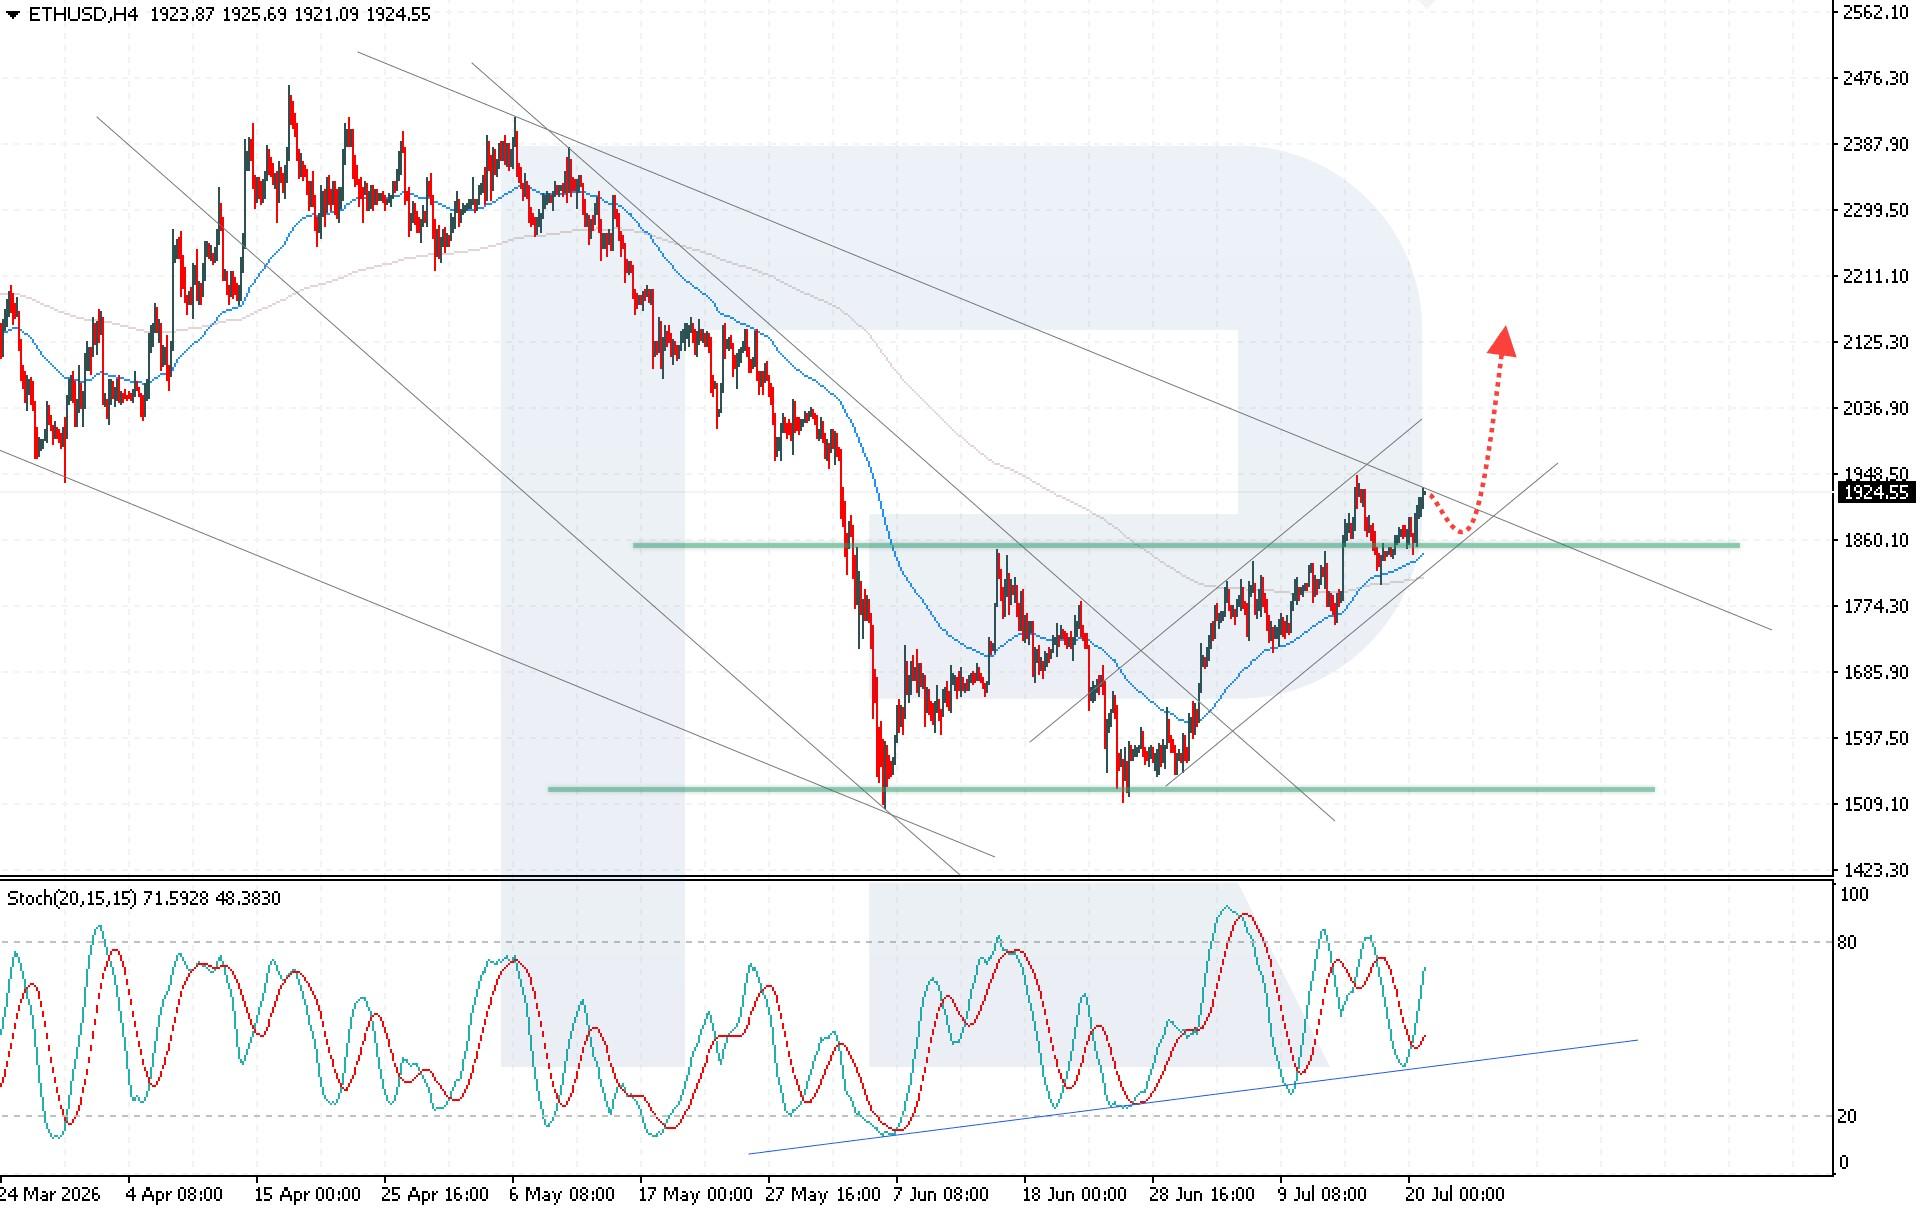
Ethereum (ETHUSD) gains bullish momentum thanks to shrinking supply The ETHUSD rate is maintaining positive momentum amid rising investor demand and renewed interest in Ethereum, with the price currently at 1,925. Technical outlook ETHUSD is testing the upper boundary of the descending channel, with the price already consolidating above the upper boundary of the Double Bottom reversal pattern. This trend indicates stronger buying activity and increases the likelihood of continued upward momentum. The ETHUSD forecast for today remains positive, while the key factor for further movement will be buyers’ ability to overcome the 1,945 USD resistance level. Read more - ETHUSD Forecast Attention! Forecasts presented in this section only reflect the author’s private opinion and should not be considered as guidance for trading. RoboForex bears no responsibility for trading results based on trading recommendations described in these analytical reviews. Sincerely, The RoboForex Team
-
Welcome to Indo-Investasi.com. Please feel free to browse around and get to know the others. If you have any questions please don't hesitate to ask.
-
roboforex Market Fundamental Analysis by RoboForex
RBFX Support replied to RBFX Support's topic in Fundamental Analysis
USDJPY is on the edge, Japanese authorities could intervene at any moment When the USDJPY pair attempts to reach new highs, the Japanese authorities may carry out a currency intervention without warning. USDJPY forecast: key takeaways The main driver remains the escalation of the conflict between the US and Iran On the other hand, signals are emerging about a possible 10-day ceasefire New record highs could prompt the Japanese authorities to intervene Fundamental analysis Fundamental analysis for 21 July 2026 shows that the pair continues to trade sideways, remaining in the 162.30–162.60 area and hovering near its highest levels in nearly 40 years. The main driver remains the escalation of the US-Iran conflict. On the one hand, the Yemeni Houthis announced a naval blockade of Saudi Arabia. RoboForex Market Analysis & Forex Forecasts Attention! Forecasts presented in this section only reflect the author’s private opinion and should not be considered as guidance for trading. RoboForex bears no responsibility for trading results based on trading recommendations described in these analytical reviews. Sincerely, The RoboForex Team -
 SimpleMoodyPerson joined the community
 -

HFMarkets (hfm.com): Market analysis services.
AllForexnews replied to AllForexnews's topic in Fundamental Analysis
Date: 21st July 2026. USDCAD Outlook: Tariffs, Oil Risks & Canadian Dollar Volatility. Global economic dynamics are once again being tested by a complex combination of geopolitical volatility in the Middle East and a new wave of US trade protectionism. The pressure on the Canadian dollar (Loonie) to around 1.40 per USD reflects not only domestic macroeconomic readings but also the vulnerability of Canada's trade structure to external shocks involving the world's vital energy arteries: the Strait of Hormuz and the Red Sea. Easing Inflation and Pressure on the "Loonie" Canadian inflation reports showed a decline in the annual inflation rate to 2.8%, while the Bank of Canada's (BoC) preferred core inflation measure slumped to its lowest point in more than five years. While this slowdown provides some relief for consumers, it directly reduces market expectations for further interest rate hikes. With the benchmark interest rate stuck at 2.25%, domestic bond yields lost their competitive appeal to foreign investors, triggering further depreciation in the Loonie exchange rate. Geopolitical Influences: The Strait of Hormuz, the Red Sea, and Energy Supply Amidst slowing domestic inflation, the global energy market is haunted by geopolitical uncertainty originating in the Middle East, particularly disruptions in the Strait of Hormuz and the Red Sea. A Fragile Global Energy Pulse: The Strait of Hormuz and the Red Sea are two of the most crucial chokepoints for global crude oil shipping routes. Escalation of conflict in the region directly drives up global oil prices. Impact of Shocks on Inflation & Policy: Although the Bank of Canada assesses that the surge in energy costs from the Middle East crisis has not yet spread broadly to core economic sectors, persistently high oil prices maintain the risk of imported inflation. For Canada, as an energy exporting nation, fluctuating global commodity prices due to supply threats in the Strait of Hormuz create a paradox: boosting energy sector revenues on the one hand, but increasing macroeconomic vulnerabilities and global supply chains on the other. Escalation of US Protectionism: Additional 50% Tariffs Canada's economic situation became even more strained when the White House unilaterally announced an aggressive protectionist policy: an additional 50% ad valorem tariff on certain Canadian products, primarily covering automotive, parts, and consumer goods. This policy, effective August 19, was framed by Washington as a response to what it called Ottawa's "discriminatory policies" against US automotive, alcoholic beverages, and dairy products. Threat to Integrated Supply Chains: This move is a major blow to the integration of the North American Supply Chain Agreement (USMCA), which has closely linked the manufacturing industries of the US, Canada, and Mexico. Consumer Inflation Risk: High import taxes not only threaten the profit margins of the cross-border automotive industry but also pose a significant risk of shifting the cost burden to consumers in both countries. Potential Trade War: Ottawa's threat to retaliate opens the door to an open trade war, further complicating the investment climate amidst Canada's sluggish economic recovery efforts due to global uncertainty. Strategic Conclusion Based on the USDCAD price structure, the pair is experiencing a healthy pullback after stalling near the key Fibonacci resistance area of the 0.5 ratio and the previous swing high line. Currently, the price is approaching the dynamic support area of the moving average line and the 0.382 Fibonacci level (around 1.3981), while the RSI momentum indicator indicates easing short-term selling pressure. As long as the price maintains this classic support level and the main uptrend structure remains intact, the opportunity for an upward price bounce remains open to retest the resistance area in the range of 1.4136 to 1.4291 (0.618FR). The current Loonie crisis reflects a dangerous crossroads: domestic pressures stemming from declining interest rate expectations, disruptions to global energy supply chains caused by instability in the Strait of Hormuz and the Red Sea, and the devastating impact of unilateral US tariffs. If these geopolitical tensions over energy and the trade war are not eased soon, Canada's economic resilience will be severely tested until the end of 2026. Always trade with strict risk management. Your capital is the single most important aspect of your trading business. Please note that times displayed based on local time zone and are from time of writing this report. Click HERE to access the full HFM Economic calendar. Want to learn to trade and analyse the markets? Join our webinars and get analysis and trading ideas combined with better understanding of how markets work. Click HERE to register for FREE! Click HERE to READ more Market news. Ady Phangestu HFMarkets Disclaimer: This material is provided as a general marketing communication for information purposes only and does not constitute an independent investment research. Nothing in this communication contains, or should be considered as containing, an investment advice or an investment recommendation or a solicitation for the purpose of buying or selling of any financial instrument. All information provided is gathered from reputable sources and any information containing an indication of past performance is not a guarantee or reliable indicator of future performance. Users acknowledge that any investment in Leveraged Products is characterized by a certain degree of uncertainty and that any investment of this nature involves a high level of risk for which the users are solely responsible and liable. We assume no liability for any loss arising from any investment made based on the information provided in this communication. This communication must not be reproduced or further distributed without our prior written permission. -
Read all the posts to understand how it works. 1. I recently tested the TI crack and it worked well for me. When the author introduced AI model with online check/login, Terra menu became disabled. This requires the cracked *NN files from Banker. 2. You need the latest Terra update from the Terra updater as well as from Banker for Terra to work, no need to run every update. Only the last update is enough. But when the next update comes, you have to update both!
-
 bbj256 joined the community
 - Yesterday
-
Welcome to Indo-Investasi.com. Please feel free to browse around and get to know the others. If you have any questions please don't hesitate to ask.
-
 Hope Get Destroyed joined the community
 -
Welcome to Indo-Investasi.com. Please feel free to browse around and get to know the others. If you have any questions please don't hesitate to ask.
-
 hamad60530 joined the community
 -
 togoxanux joined the community
 -
Market Technical Analysis by RoboForex
RBFX Support replied to RBFX Support's topic in Technical Analysis
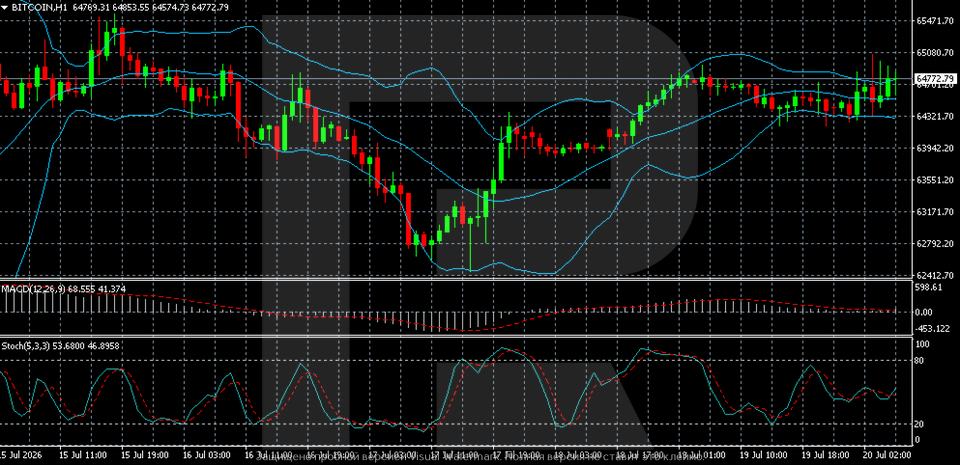
Bitcoin (BTCUSD) may rise, but it needs more support Bitcoin (BTCUSD) climbed to 64,772 USD. The market is keeping a close eye on external developments and the US bill to create reserves. Technical outlook On the hourly chart, Bitcoin is recovering after falling to the 62,400–62,800 area and is now trading around 64,770. The price is holding above the middle Bollinger Band and is again approaching the upper boundary of the indicator, signalling continued local demand. The Bitcoin price is attempting to rise, but consolidation remains the baseline scenario. Read more - BTCUSD Forecast Attention! Forecasts presented in this section only reflect the author’s private opinion and should not be considered as guidance for trading. RoboForex bears no responsibility for trading results based on trading recommendations described in these analytical reviews. Sincerely, The RoboForex Team
-
roboforex Market Fundamental Analysis by RoboForex
RBFX Support replied to RBFX Support's topic in Fundamental Analysis
DE 40 forecast: the index is testing the support level During the correction, the DE 40 stock index began to test the support level, which could lead to a trend reversal. The DE 40 forecast for today is positive. DE 40 forecast: key takeaways Recent data: Germany’s CPI rose by 2.3% year-on-year in June Market impact: the data creates a moderately positive backdrop for the German stock market Fundamental analysis The German inflation data release has a moderately positive, but limited, impact on the DE 40 index. The annual Consumer Price Index slowed from 2.6% to 2.3% in June, while prices fell by 0.3% month-on-month. For the DE 40, this could result in growing interest in stocks of companies focused on domestic consumption, industry, and capital expenditure. RoboForex Market Analysis & Forex Forecasts Attention! Forecasts presented in this section only reflect the author’s private opinion and should not be considered as guidance for trading. RoboForex bears no responsibility for trading results based on trading recommendations described in these analytical reviews. Sincerely, The RoboForex Team -
 hungvoeeo joined the community
 -
 ali joined the community
 -
HFMarkets (hfm.com): Market analysis services.
AllForexnews replied to AllForexnews's topic in Fundamental Analysis
Date: 20th July 2026. Oil Surges Above $90 as US-Iran Conflict Escalates | Market Briefing. Trading Leveraged products is Risky Oil Surges Above $90 as Middle East Tensions Shake Global Markets Global financial markets began the week on a cautious note as renewed military escalation between the United States and Iran sent oil prices sharply higher, reignited inflation concerns, and forced investors to reassess the outlook for interest rates. While equity markets attempted to stabilize after last week's technology-led selloff, rising geopolitical risks have once again become the dominant driver of market sentiment. Oil Climbs as Energy Supply Risks Return Brent crude rose above $90 per barrel, its highest level in more than a month, after the conflict between the US and Iran intensified. Fresh military strikes, attacks on vessels attempting to transit the Strait of Hormuz, and growing uncertainty over regional stability have raised fears of disruptions to one of the world's most important energy corridors. The Strait of Hormuz normally handles around 20% of global oil and liquefied natural gas shipments, making any threat to shipping routes highly significant for global energy markets. Oil has now gained more than 20% during July, reversing much of the decline seen after the temporary ceasefire reached earlier this summer. Investors are increasingly pricing in the possibility that tensions could remain elevated for an extended period, keeping energy prices supported. Inflation Fears Return to the Forefront The surge in crude oil is quickly changing the macroeconomic narrative. Only days ago, softer US inflation data had strengthened expectations that the Federal Reserve might be approaching the end of its tightening cycle. However, higher energy prices threaten to reverse that progress. Oil prices above $90 per barrel increase transportation, manufacturing, and production costs across the economy, creating renewed inflationary pressure. As a result, markets are beginning to price in the possibility that central banks may need to keep interest rates higher for longer—or even consider additional rate hikes if inflation accelerates again. Government bond markets reflected this shift in expectations, with yields moving higher across several regions as investors reduced exposure to fixed-income assets. Technology Stocks Face a Second Challenge The geopolitical backdrop comes at a difficult time for global technology shares. Last week, semiconductor and AI-related stocks experienced sharp selling pressure after Chinese AI developers introduced increasingly competitive large language models, prompting investors to reassess expectations surrounding the dominance of US artificial intelligence companies. Although some Chinese technology stocks recovered modestly, overall market sentiment remains fragile as investors weigh both geopolitical uncertainty and changing dynamics within the AI sector. Gold Holds Firm Despite Rising Risks Interestingly, gold has shown a relatively restrained response to the latest geopolitical developments. Spot gold continues to trade near $4,000 per ounce, remaining close to recent support levels despite the surge in oil prices. Normally, escalating geopolitical tensions would trigger stronger demand for safe-haven assets. However, investors appear more focused on the implications of higher oil prices for interest rates. Rising bond yields tend to reduce the appeal of non-yielding assets such as gold, helping explain the metal's relatively muted performance. This suggests that monetary policy expectations are currently exerting greater influence on precious metals than geopolitical headlines alone. Europe Watches Inflation Ahead of the ECB Attention now turns to this week's European Central Bank meeting. Latest Eurozone data showed annual inflation easing to 2.8% in June, while core inflation also moderated, supporting the case for policymakers to pause after June's interest-rate increase. However, the renewed rise in energy prices complicates that outlook. If oil continues climbing, inflation could once again accelerate during the second half of the year. Markets currently expect the ECB to leave rates unchanged this week, although investors will closely monitor President Christine Lagarde's comments for any indication of future tightening should energy-driven inflation persist. Market Outlook Financial markets now face two powerful forces pulling in opposite directions. On one hand, recent economic data suggest inflation has been cooling, and growth is stabilising. On the other, renewed conflict in the Middle East threatens global energy supplies, lifting commodity prices and potentially delaying the easing of monetary policy. Going forward, investors will closely monitor: * Developments in the US-Iran conflict and security around the Strait of Hormuz. * Brent crude's ability to remain above the $90 level. * Central bank guidance from both the Federal Reserve and the European Central Bank. * Inflation expectations and bond yield movements. * Market sentiment toward technology and AI-related equities. For now, geopolitical risk has firmly returned to the top of investors' watchlists. If tensions continue to escalate, volatility across commodities, currencies, bonds, and equities is likely to remain elevated, making risk management and careful positioning increasingly important in the weeks ahead. Always trade with strict risk management. Your capital is the single most important aspect of your trading business. Please note that times displayed based on local time zone and are from time of writing this report. Click HERE to access the full HFM Economic calendar. Want to learn to trade and analyse the markets? Join our webinars and get analysis and trading ideas combined with better understanding of how markets work. Click HERE to register for FREE! Click HERE to READ more Market news. Andria Pichidi HFMarkets Disclaimer: This material is provided as a general marketing communication for information purposes only and does not constitute an independent investment research. Nothing in this communication contains, or should be considered as containing, an investment advice or an investment recommendation or a solicitation for the purpose of buying or selling of any financial instrument. All information provided is gathered from reputable sources and any information containing an indication of past performance is not a guarantee or reliable indicator of future performance. Users acknowledge that any investment in Leveraged Products is characterized by a certain degree of uncertainty and that any investment of this nature involves a high level of risk for which the users are solely responsible and liable. We assume no liability for any loss arising from any investment made based on the information provided in this communication. This communication must not be reproduced or further distributed without our prior written permission. -
 rolebi joined the community
 -
Welcome to Indo-Investasi.com. Please feel free to browse around and get to know the others. If you have any questions please don't hesitate to ask.
- Last week
-
Pivot levels are useful as reference zones, especially intraday, but I wouldn’t treat them as automatic support or resistance. They work better when price reaches them with other context like session highs/lows, structure or a liquidity sweep. The reaction at the level matters more than the level itself
-

Introduction To Online Forex Trading
binaryowner replied to StefGrig's topic in General Forex Discussions
HFM demo is useful for learning the platform and position sizing, but it doesn’t fully test execution or emotions. A small live account exposes the real spreads, slippage and withdrawal process without making every mistake expensive. Regulation is the first filter, not the whole broker check -
 kllshn joined the community
 -
Welcome to Indo-Investasi.com. Please feel free to browse around and get to know the others. If you have any questions please don't hesitate to ask.
-
i Have it , but not for share