⤴️-Paid Ad- Check advertising disclaimer here. Add your banner here.🔥
All Activity
- Past hour
-

Market Technical Analysis by RoboForex
RBFX Support replied to RBFX Support's topic in Technical Analysis
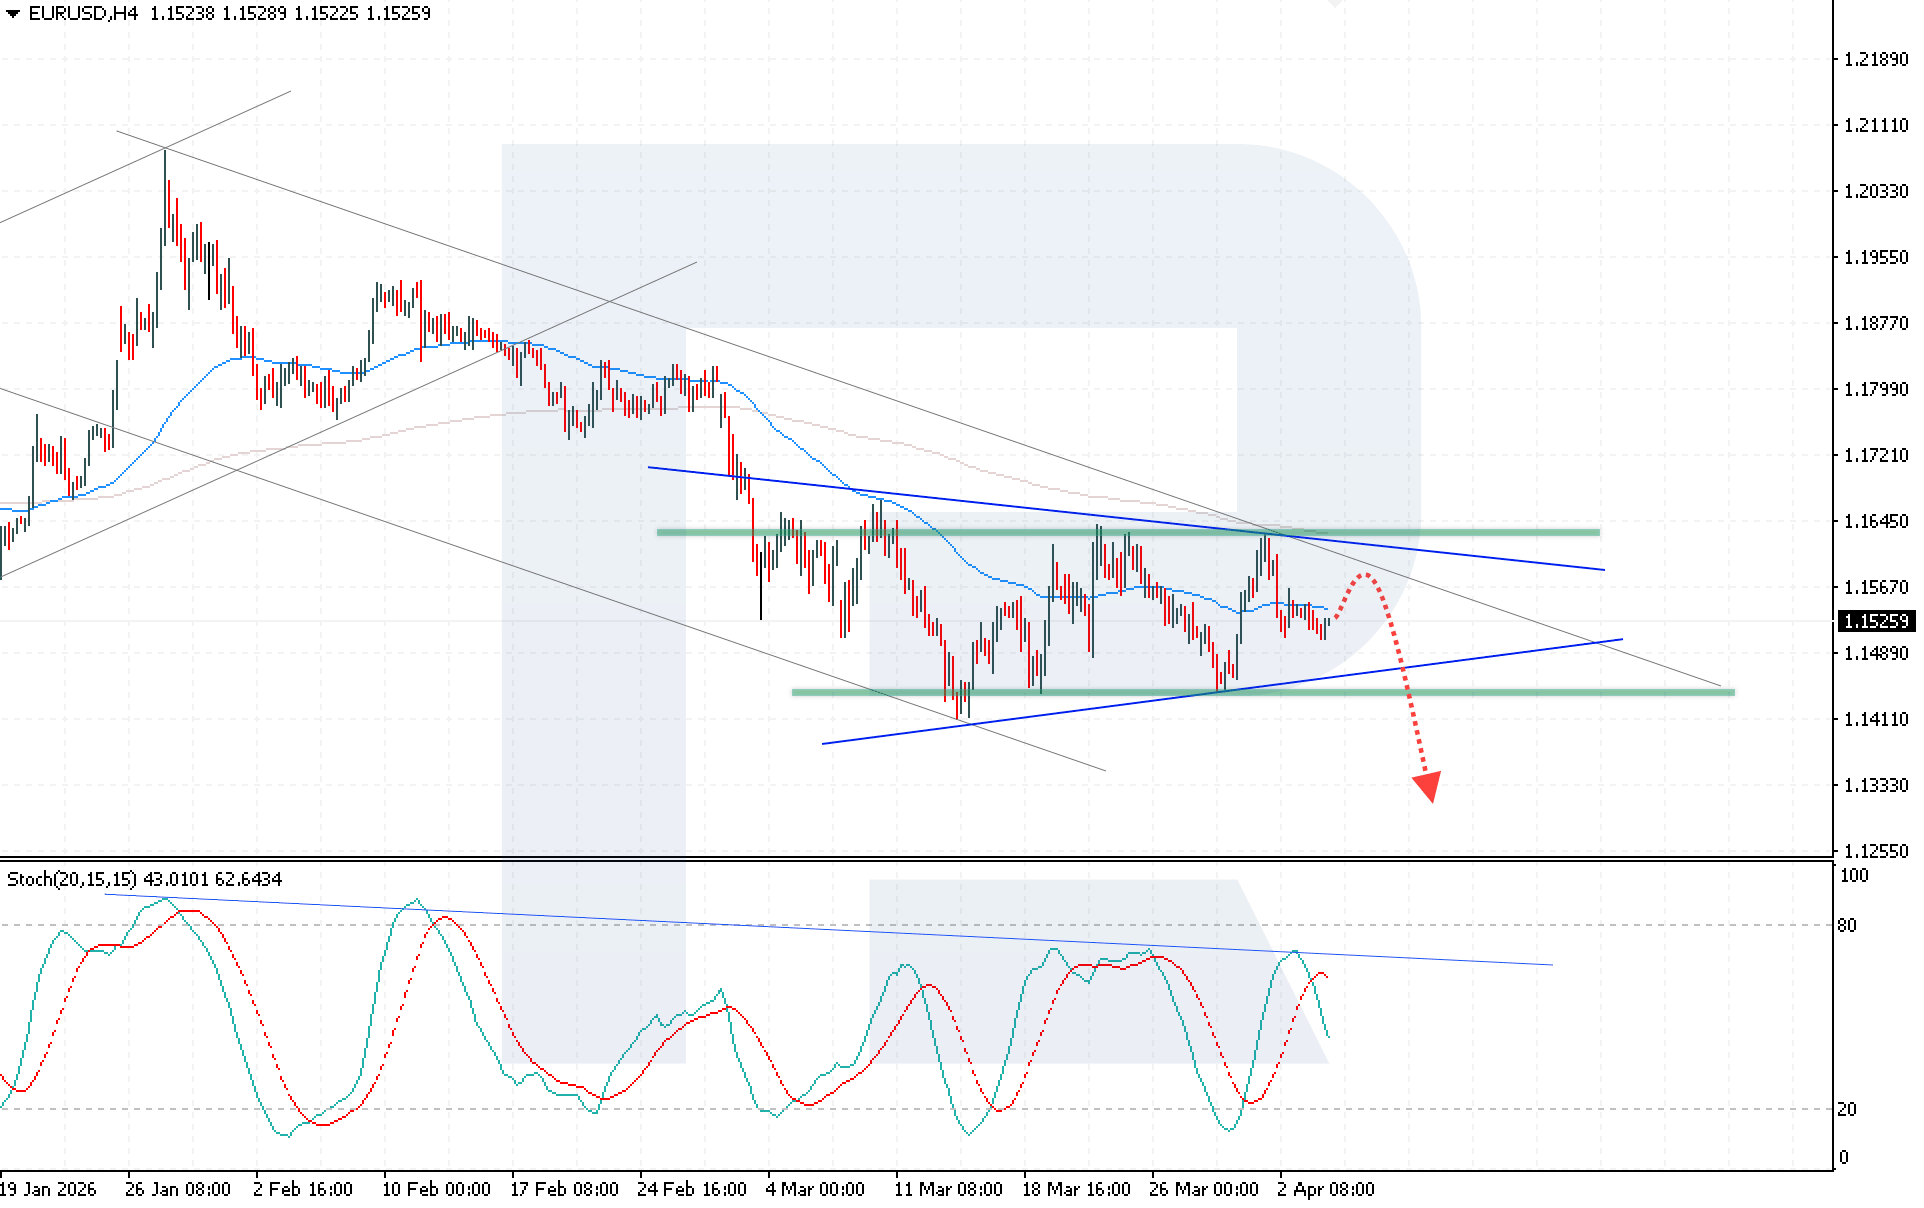
EURUSD is correcting within a Triangle pattern The EURUSD pair remains in a phase of uncertainty, combining corrective growth with the impact of strong US macroeconomic data and rising geopolitical risks. The rate currently stands at 1.1525. Discover more in our analysis for 6 April 2026. Technical outlook The EURUSD rate continues its corrective movement within the Triangle pattern. The price remains below the EMA-65, indicating persistent selling pressures and confirming the prevailing bearish sentiment. Strong US labour market data and rising geopolitical tensions are supporting the dollar. Read more - EURUSD Forecast Attention! Forecasts presented in this section only reflect the author’s private opinion and should not be considered as guidance for trading. RoboForex bears no responsibility for trading results based on trading recommendations described in these analytical reviews. Sincerely, The RoboForex Team
-

HFMarkets (hfm.com): Market analysis services.
AllForexnews replied to AllForexnews's topic in Fundamental Analysis
Date: 6th April 2026. 15 Ships Cross the Strait As Iran Consider Ceasefire. Crude Oil reached its highest price throughout March at $119 per barrel, but it was relatively quick to fall closer to $100. However, Iran continues to target neighbouring countries' oil production facilities. As a result, Oil has been rising for two consecutive weeks and is now trading at almost $112 per barrel. Over the weekend, Iran increased its attacks, particularly on Abu Dhabi and Kuwait triggering strong volatility. Abu Dhabi authorities said operations at the Borouge plant were suspended after debris from an interception hit the facility. Kuwait said Iranian drone attacks damaged two power plants and sparked fires at oil facilities. Most countries observe Monday the 6 as a bank holiday for Easter, so some markets are closed and others see lighter order flow. Crude Oil - Iraqi Ships Allowed To Cross Strait Of Hormuz There are many factors pushing the price of Oil upwards including Trump’s escalating comments and the recent Iran attacks. In addition to this, OPEC’s recent report on the forward guidance of the market conditions also worries investors. According to OPEC, the region will not be able to return to full capacity after the conflict ends for over two years. As a result, the market is likely to face tighter global supply conditions, with Russian exports remaining constrained by ongoing sanctions and Middle Eastern production also under pressure due to the recent disruptions. This combination could reduce the amount of available supply in the market and keep upward pressure on prices. The market is attempting to reduce the stress on the supply issues within the oil sector. OPEC has made a statement publicly confirming that certain countries will boost the production levels above previous restriction. Iraq told Asian traders and refiners to continue crude loadings after Iran allowed its oil tankers to pass through the Strait of Hormuz. Iran has confirmed that 15 ships moved through the Strait over the weekend after being granted access. However, it is unknown whether these are linked to Iraq. Japan is advising that two of these 15 ships are Japanese. Saudi Arabia has increased the official selling price of its main crude grade for Asian buyers to a record-high premium. The move also suggests that buyers may be willing to pay more to secure reliable cargoes amid ongoing concerns over global energy flows and Middle East production risks. Investors say oil is unlikely to rise above $120 per barrel if the conflict ends within two weeks. Experts believe sanctions on Russia may ease if the conflict comes to an end. They also expect supply chains to restart, although likely at lower capacity levels. However, if the conflict lasts longer, experts believe crude oil could rise to $145 per barrel. HFM - Crude Oil 1-Hour Chart A key development for Crude Oil will be a possible 45-day ceasefire, which is currently being discussed. NASDAQ - Employment Data Boosts Investor Sentiment The stock market is trading relatively well in comparison to the previous week due to a possible 45-day ceasefire and the latest US employment data. Steve Witkoff and Jared Kushner are currently believed to be in Pakistan negotiating a 45-day ceasefire with Iran. According to reports, a ceasefire is possible, but some sticking points remain as Iran refuses to agree on certain key points. Overnight, President Trump said on his live network that if Iran does not agree to the deal, the US will attack the country's power plants. A deal or lack of one in the upcoming days is likely to create a lot of volatility for the NASDAQ and global stocks. In addition to this, the latest employment data did not create volatility on Friday due to limited trading but is supporting the index this morning. The Non-Farm Employment Change rose by 178,000, more than double the previous projections. The US Unemployment Rate also fell from 4.4% to 4.3%. Key Takeaways: Oil rises for a second week, nearing $112, as Iran attacks energy infrastructure in Abu Dhabi and Kuwait. Supply risks grow as OPEC warns capacity recovery may take over two years post-conflict. Partial relief is seen as Iraq shipments resume via the Strait of Hormuz, but overall supply remains constrained. Oil outlook depends on conflict duration: ~$120 if short-term, up to $145 if prolonged. Always trade with strict risk management. Your capital is the single most important aspect of your trading business. Please note that times displayed based on local time zone and are from time of writing this report. Click HERE to access the full HFM Economic calendar. Want to learn to trade and analyse the markets? Join our webinars and get analysis and trading ideas combined with better understanding of how markets work. Click HERE to register for FREE! Click HERE to READ more Market news. Michalis Efthymiou HFMarkets Disclaimer: This material is provided as a general marketing communication for information purposes only and does not constitute an independent investment research. Nothing in this communication contains, or should be considered as containing, an investment advice or an investment recommendation or a solicitation for the purpose of buying or selling of any financial instrument. All information provided is gathered from reputable sources and any information containing an indication of past performance is not a guarantee or reliable indicator of future performance. Users acknowledge that any investment in Leveraged Products is characterized by a certain degree of uncertainty and that any investment of this nature involves a high level of risk for which the users are solely responsible and liable. We assume no liability for any loss arising from any investment made based on the information provided in this communication. This communication must not be reproduced or further distributed without our prior written permission. -
 babeonidi reacted to a post in a topic:
Amibroker V7
babeonidi reacted to a post in a topic:
Amibroker V7
-
babeonidi reacted to a post in a topic:
Amibroker V7
-
 Supra L1 has just seen the launch of its first decentralized exchange (DEX), and I wanted to open a discussion about the technology behind it. Supra L1 claims to offer high throughput, low latency, and built-in cross-chain support, which could address some common pain points with current DEX platforms. I’m interested in hearing what the community thinks about this approach, especially regarding security, interoperability, and real-world use cases. If you have questions about the architecture or want to share your thoughts on the potential of DEXs on new Layer 1 blockchains, let’s discuss.
 -
Jack May joined the community
- Today
-
 Puzzle reacted to a post in a topic:
Amibroker V7
Puzzle reacted to a post in a topic:
Amibroker V7
-
Puzzle reacted to a post in a topic:
Amibroker V7
-
⭐ RichardGere reacted to a post in a topic:
Amibroker V7
-
To be honest and practical though, all of which, the modules, one could easily find and learn from YouTube videos, as far as for Liq Sweep. But I do understand you.🤗 I think however, 5K is a tad over kill but then again, there are indicators and trading courses out there that would cost us the same price as a car.🤢 Just like their Robot Lab. 40K. Ouch. Didnt bring me a dime in profit! Ironically, I have them somewhere in the back burner, collecting dust.
-
Could you provide better instructions and working file from kimsam gex indicator? I try to get it working. I setup everything correctly.
-
Sorry but I don't have the 32 bit of Amibroker v 7. If you have a system of 64 bit, Amibroker v7 64 bit is better.
-
Yes, and "delta"🫣 But again, most bots are just that, underneath the big name of A.I when we tear them down and look deep into their codes. Regardless though, I actually like their scalper, although, it comes with a whole list of strategies one could pick to use. That is, however, the part I dont like much as I think bots, in a whole, should be just a simple plug and play. Not one you have to go through a bunch of strats and templates to figure out which is the best to use. Defeats the whole core purpose of being "automatic" and "hands-off" approach. I gotta give it to them though, for being colorful and making it look extremely busy on the chart.😂 Trying to be like NinzaCo folks, I guess.
-

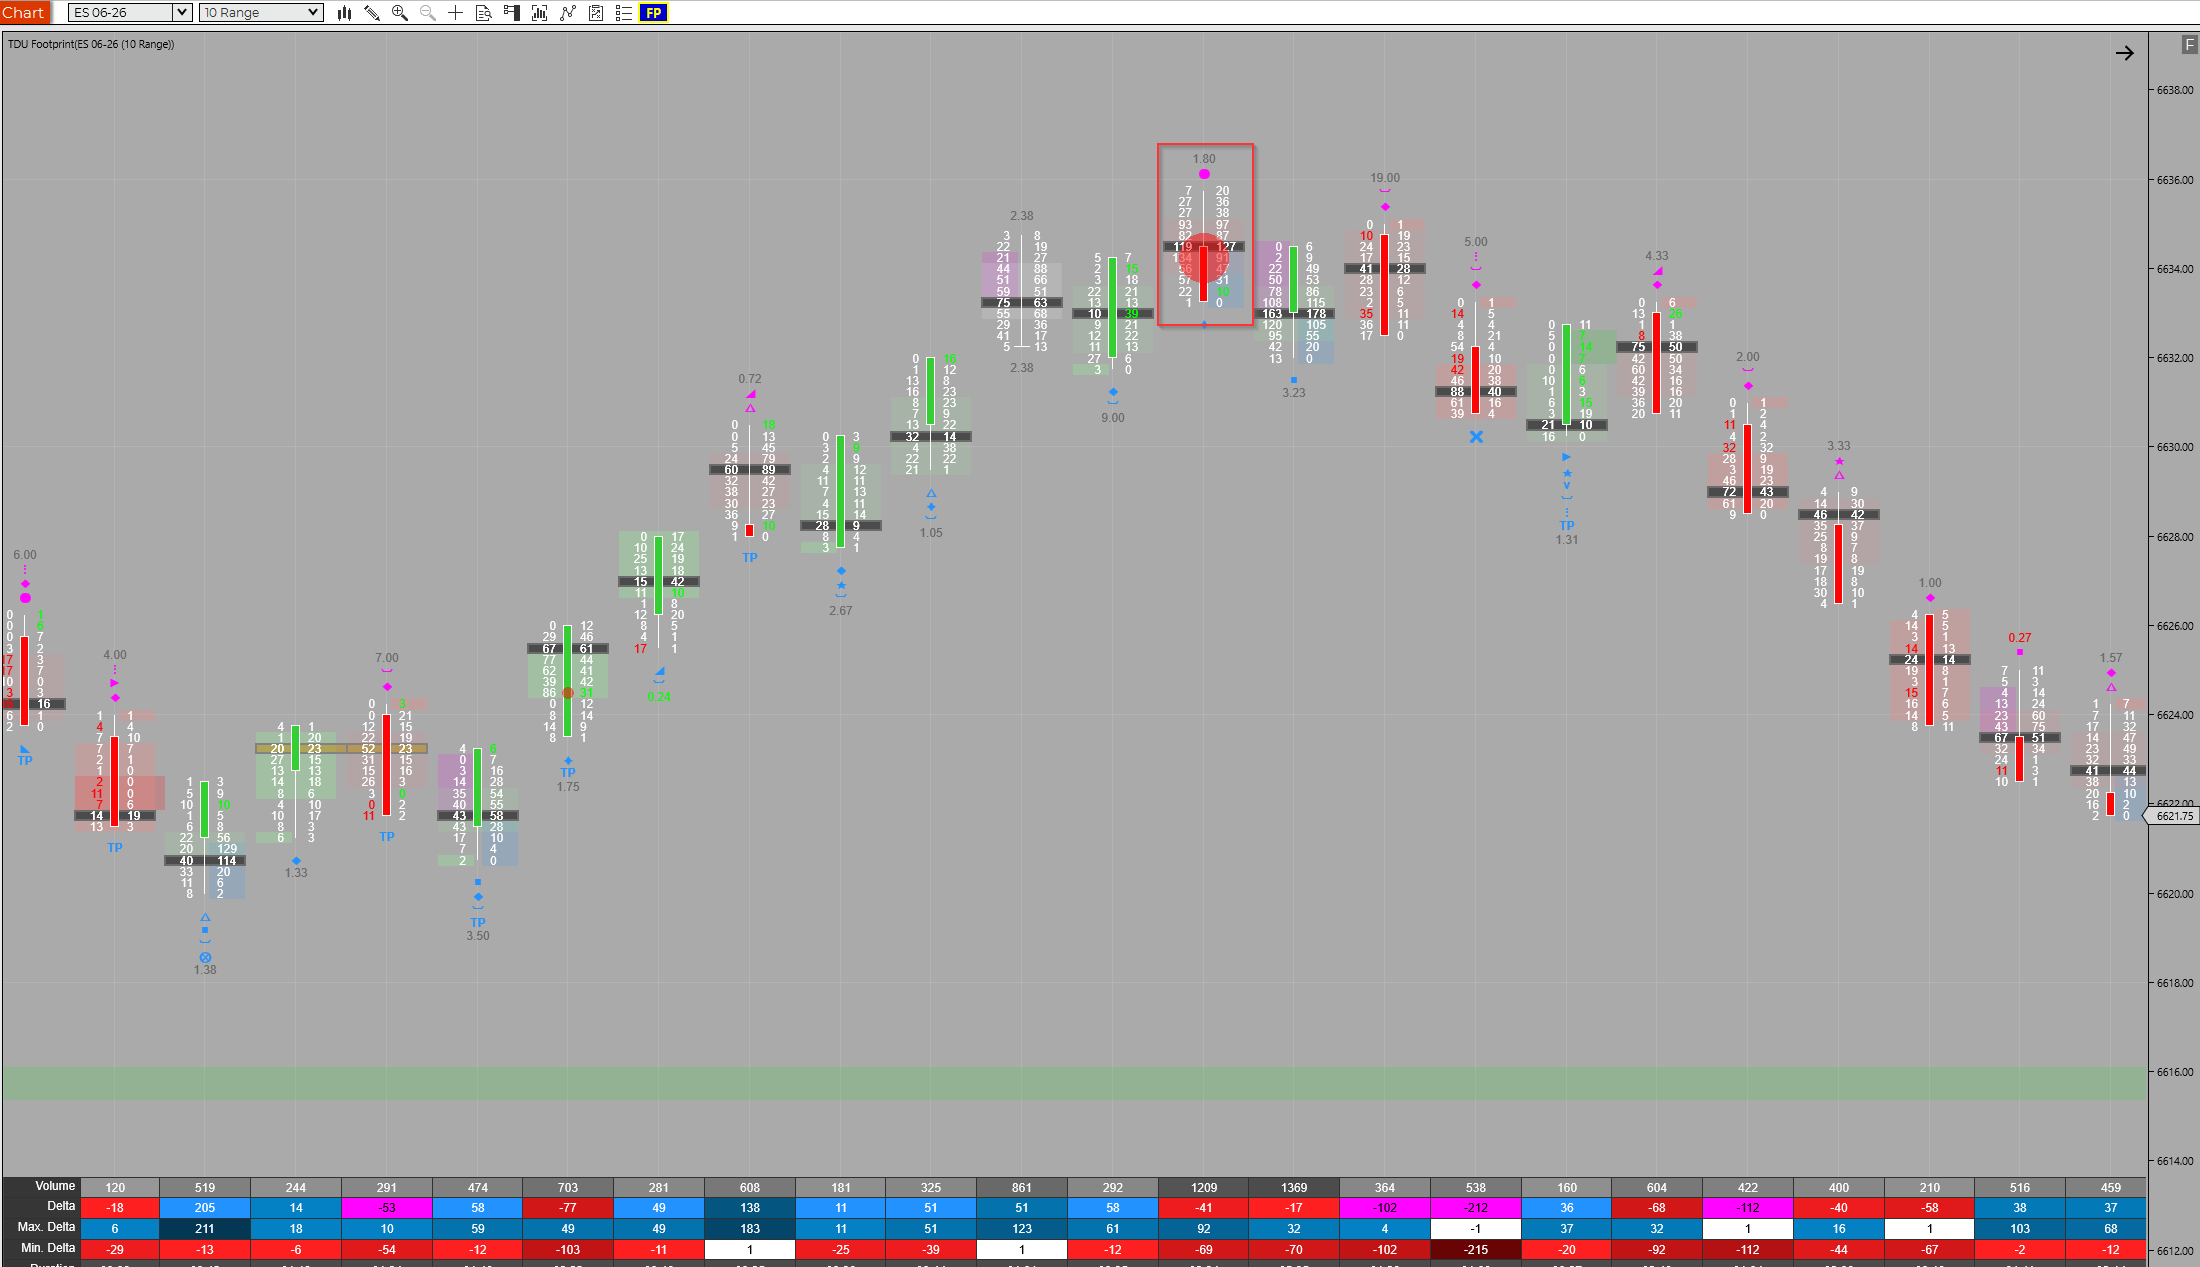
TDU footprint v.2.0.14 zip + Big trades v1.0.0.9 - new features
trader04 replied to sarutobi's topic in Ninja Trader 8
@Minigemsplease -
Sir , Any luck to get 32bit Amibroker 7 with edu. Thanks for Your time and efforts.
-
I have posted Amibroker v 7 in that forum. But the crack of bunion don't work because don't save the modifications. bunion and daddypenguin will work to the developping. I will post the correct crack.
-
The underlying trading algos for both the analyzer and the fusion bot are very basic. It's all eye candy. The part where it truly matters (the actual trading) looks something like ema crossover with vwap (Fusion bot's algo).
-
⭐ aclient21 reacted to a post in a topic:
[Get] Gareth Soloway - Master trader Bundle
-
Amibroker V7, software posted in another forum, giving a different link in case original goes down. Not tested personally. https://mega.nz/file/DdhFhCwZ#92mF0Y3OAAggfKD8AoLgNQHPceve72lKxmNAJwZ8grk
-
FalconFactory reacted to a post in a topic:
fixed .. ORS Fusion and Axios
-
When you find, - do read, but do not get obsessed . Focus on price action and macro economic, certainly you will do well.
-
 mmicro reacted to a post in a topic:
N!njacators L!quidity Sweep
mmicro reacted to a post in a topic:
N!njacators L!quidity Sweep
-

TDU footprint v.2.0.14 zip + Big trades v1.0.0.9 - new features
indicat replied to sarutobi's topic in Ninja Trader 8
Should be able to access any value, any imbalances, volume bubbles in debugger and create any kind of setup from there... I haven't tried MZPack yet. -
TDU footprint v.2.0.14 zip + Big trades v1.0.0.9 - new features
indicat replied to sarutobi's topic in Ninja Trader 8
-
Woody reacted to a post in a topic:
LET'S SHARE YOUR STRATS
-
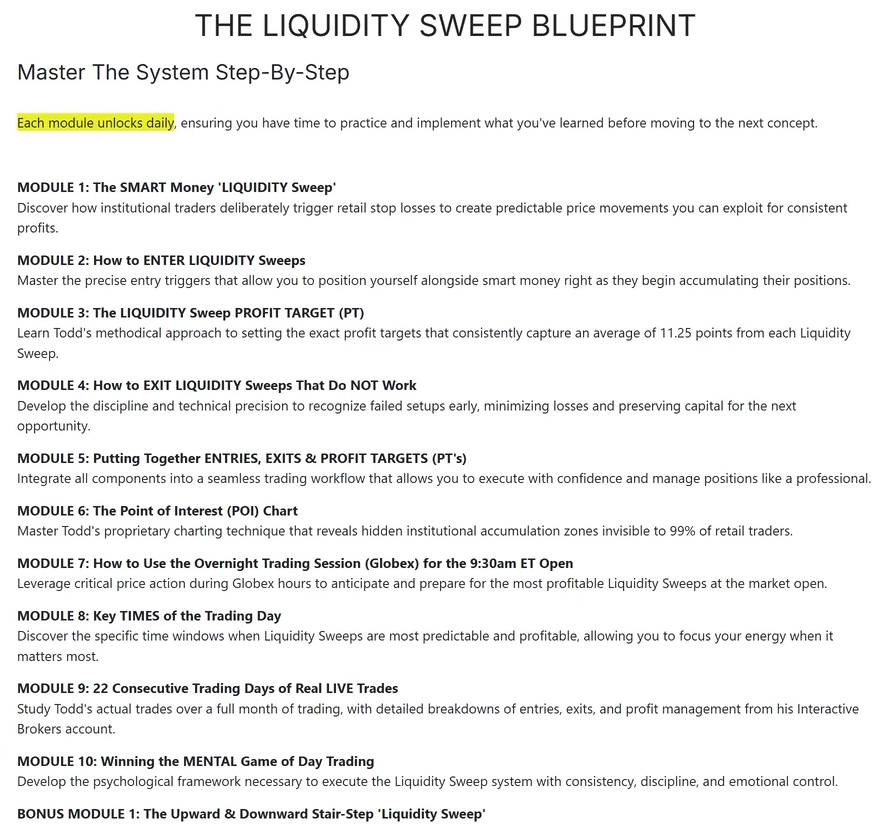
It's not really an indicator, it's more of a liquidity sweep trading system. He says there are no special indicators and can be traded on any trading platform. This is the outline of the training.
-
Please can you share his telegram id I want to contact him
-

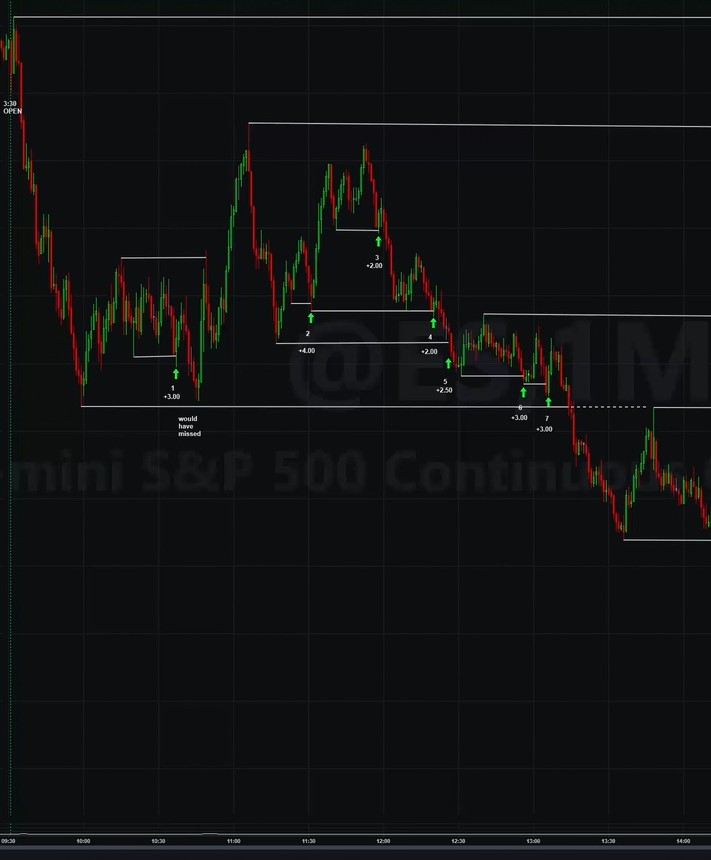
The E-Mini S&P Liquidity Sweep System - Ninjacators
Woody replied to ⭐ sean2003's topic in Tradestation Forum
@sean2003 Were you able to find anything on the e-mini S&P Liquidity Sweep System? I am interested in it also, but can't see paying $5000 for it. Thanks -
 saurabh joined the community
 -
 Does Mzpack already have the same thing?
 -
indicat reacted to a post in a topic:
N!njacators L!quidity Sweep
-
TDU footprint v.2.0.14 zip + Big trades v1.0.0.9 - new features
indicat replied to sarutobi's topic in Ninja Trader 8
No, Tick Replay is still there. You have two options - use tick replay for better precision or just regular and 1 tick series underlying like if you use cumulative delta for regular NT8 - with tick replay it would be more accurate and won't miss any trades... but if you trade fast markets in real time - you might consider running it without tick replay to avoid lag and because volume is huge anyway it is OK to miss few trades/ticks... Also, version 26 can show volume bubbles per bar programmatically if you use the "GetFootPrintBar" function. Anyone can educate latest version 26? Many bug fixes and performance improvements... And by using individual footprintbars you can access anything when it it comes to footprint... TDUFootPrint v26.zip -
Check this reseller for Google Gemini https://www.z2u.com/product-876155/Google-AI-Gemini-Pro-12-Months-Family-Member-Account.html
-

ERTS (Easy Renko Trading System) Needs Unlocking
⭐ fryguy1 replied to TickHunter's topic in Ninja Trader 8
New site being finished https://adtssystems.com/ -
Thanks for sharing a good website. They have lots of information on GEX. The NT script that can be downloaded from this site can be used with manual pull of GEX levels off course it is either end of day or delayed by a day. Subscription is needed for this for any other use.
-
Welcome to Indo-Investasi.com. Please feel free to browse around and get to know the others. If you have any questions please don't hesitate to ask.