⤴️-Paid Ad- Check advertising disclaimer here. Add your banner here.🔥
All Activity
- Past hour
-
 @Ninja_On_The_Roof you have put a lot of work into getting us an arsenal of varied approaches to achieve success. I can't help but believe that amongst the mountain of coal, there has to be a diamond in the rough. We just need the right tools to evaluate one by one, maybe two that will shine. Thank you again for your great effort.
 -
 AllIn reacted to a post in a topic:
DT Range Volume Profile
AllIn reacted to a post in a topic:
DT Range Volume Profile
-
AllIn reacted to a post in a topic:
Market Replay Downloader
-
AllIn reacted to a post in a topic:
Market Replay Downloader
-
kkreig reacted to a post in a topic:
Session Volume Profile
-
 Yes. I have mentioned that before. They are all just the same. Same color. Same craps. Unless they have pretty good traders who know the market well and coding, these Ninza dudes keep popping out new craps day in and day out.
 -
I personally think it isnt a good idea to use Ninza orderflow stuff. 🤗
- Today
-
Traderbeauty reacted to a post in a topic:
Session Volume Profile
-
⭐ Iqbal reacted to a post in a topic:
complete bestorderflow need to edu
-
⭐ Iqbal reacted to a post in a topic:
jenacie.com
-
@kimsam Thanks 🙏
-
dex reacted to a post in a topic:
Session Volume Profile
-
@N9T Please can you share? Greatly appreciated 🙏
-
⭐ RichardGere reacted to a post in a topic:
Session Volume Profile
-
jetstrade reacted to a post in a topic:
Session Volume Profile
-
https://workupload.com/file/7vGxNNWcaMU
-

A new diamond in the rough- a very good educator
Traderbeauty replied to Traderbeauty's topic in Ninja Trader 8
Good news Carlos55 just spoke with Brokey and he said that he already sent you a message and solved the issue. I am so glad that I could help and I am very impressed with Brokey's quick response. i still think that he is one of the best and most reliable. Traderbeauty-Jane -
Hi Educators, Can you kindly assist in educating this? https://workupload.com/file/XHdNMaG2Vfw Thanks 🙏 @apmoo @kimsam @N9T @redux
-
 Yeah I am not sure you are going to find one resource that works for all unless you get the combination 100% correct. I found the 2 or 3 that I really like and have stuck with them. I find 95% of the Ninza are just the same thing with different colors. If you look at the picture that Ninja_On_the_roof sent you can see almost all the indicators are doing the same thing.
 -
 some of the first links dont work
 -

Affordable Indicators - Accounts Dashboard Suite
ScoobyDoo replied to ScoobyDoo's topic in Ninja Trader 8
Oh great. I have been running on an older one. Thank you for the info! -
@ynr You have the 4 min and 6 min settings?
-
 I am Order flow trader and Thats why i don't use other stuff
 -

lastest version predator traesaber version 3.6.0.0.0 need to edu
vonita replied to TRADER's topic in Ninja Trader 8
Many thanks... it worked -
No, I dont. Sorry. Too new. Too fresh. Give it time. By the way, what makes you have an itch for this one? Out of over 50 of them already posted by various members and educators, you couldn't find at least 3 profitable? If so, to me, it isnt because of the indicators. Ninza indies fall into a known phenomenon category. When you see a new one, you get an itch for it. You want it badly. It never stops.
-
you are moving at the speed of...., finished work before I even hit Enter.
-
Thxs
-
https://workupload.com/file/Y4aeSGpCQq3
-
 Fielpo joined the community
 -
Supportandresistance.zip
-

HFMarkets (hfm.com): Market analysis services.
AllForexnews replied to AllForexnews's topic in Fundamental Analysis
Date: 13th February 2026. AI Fears Weigh on Global Stocks Ahead of Today’s CPI. All global indices declined on Thursday, including the US, EU and Asian indices. The quick, sudden selloff is due to fear regarding AI triggering a domino effect on employment and most sectors. Economists advise that the rapid release of new AI products can hurt long-term profits and disrupt business models. The movement continues to remain under pressure on Friday as the market sentiment remains low. In addition to this, investors are considering whether the Federal Reserve would opt for a prolonged pause. This afternoon, the US will release its latest inflation figures. The new inflation rate may shed some light on how the Federal Reserve may view its monetary policy. HFM - S&P 500 15-Minute Chart AI Concerns Not Only A Tech-Problem The performance of the stock market over the past 24-months has largely been related to demand in AI products. However, the growing number of companies investing in AI, along with the rapid expansion of AI products, is raising concerns among economists. These concerns of triggering a selloff amongst stocks, and not only within Technology companies. The number of new AI products launched this week is raising concerns about traditional business models. Sectors such as logistics, real estate, professional services, and enterprise software could face disruption or replacement. One example is Intuit’s new AI-Powered Construction Edition for its Enterprise Suite. The company announced the product on Wednesday. Analysts warned that these tools could automate tasks that previously required human labour. This raises concerns about future revenue streams for many companies. Economists advise that rapid automation and new AI products could increase unemployment. They also warn that demand for traditional products may decline. For example, Bloomberg economists say the domino effect could impact sectors unrelated to AI or technology. For example, if there is a lesser need for traditional products and unemployment rises, the need for real estate and office space falls significantly. Hence, one of the reasons why Real Estate stocks are also under extreme pressure. For example, Camden Property Trust stocks, which are included in the S&P 500, fell 2.95% on Thursday. Traders may ask why technology stocks are also declining, as the risk is largely related to other sectors such as logistics, real estate and industrials. Investors focusing their portfolios on AI and the technology sector are contemplating whether there is a risk of an AI-Bubble. In addition to this, investors fear that the risk which AI bears on the economy may trigger harsher regulation. Traders should also note that strong trending markets on new technology in the past have witnessed powerful declines. For example, the .com crash in the early 2000 where the S&P 500 fell 50% and took more than 7-years to return to its pre-crash level. Employment and the Federal Reserve This week’s strong labour market, including rising payrolls and lower unemployment, suggests economic resilience and reduces the urgency for interest rate cuts. As a result, the Federal Reserve is not likely to cut rates in March, which is a concern for stocks. Analysts expect inflation to decline from 2.7% to 2.5%, positive for investor sentiment and the stock market. However, if inflation does not decline to this level, investors will fear a prolonged pause, and this can pressure stocks further. Particularly as stocks are already under pressure from a “risk off” appetite. As a last note, a positive factor for the stock market is that President Trump is contemplating whether to slightly lower tariffs on certain metals. These tariffs were put in place last summer, but recent reports indicate these tariffs may be reduced. S&P 500 - Technical Analysis The price of the S&P 500 is currently trading 2.70% lower than the previous swing high. When monitoring previous bearish swings, the average decline that the S&P 500 witnessed is 3.65%. For this reason, price action and past price data indicate the price can potentially continue to fall. On the 2-hour timeframe, the price of the S&P 500 has fallen below the 100-bar Simple Moving Average and below the 75-Bar Exponential MA. In addition to this, the price is also witnessing bearish crossovers on most timeframes and is trading below the day’s Volume-Weighted Average Price. The VWAP is also pointing downwards, which further indicates a bearish signal. According to the 200-BAR SMA on the 5-minute chart, a correction signal is not likely unless the price increases to $6,850.00. However, this would also depend on this afternoon’s Consumer Price Index. A lower inflation reading could boost sentiment and demand. Key Takeaways: Global markets fell on Thursday on fears that rapid AI adoption could disrupt multiple sectors. Fears arise after the release of multiple AI products throughout the week. AI products may automate tasks, hurt traditional revenue streams, and increase unemployment risks. Real estate stocks, like Camden Property Trust, fell due to declining demand for office space. Strong US employment reduces urgency for Fed rate cuts, while inflation data will guide policy. S&P 500 shows bearish technical signals, with downside risk unless CPI and sentiment improve. Always trade with strict risk management. Your capital is the single most important aspect of your trading business. Please note that times displayed based on local time zone and are from time of writing this report. Click HERE to access the full HFM Economic calendar. Want to learn to trade and analyse the markets? Join our webinars and get analysis and trading ideas combined with better understanding of how markets work. Click HERE to register for FREE! Click HERE to READ more Market news. Michalis Efthymiou HFMarkets Disclaimer: This material is provided as a general marketing communication for information purposes only and does not constitute an independent investment research. Nothing in this communication contains, or should be considered as containing, an investment advice or an investment recommendation or a solicitation for the purpose of buying or selling of any financial instrument. All information provided is gathered from reputable sources and any information containing an indication of past performance is not a guarantee or reliable indicator of future performance. Users acknowledge that any investment in Leveraged Products is characterized by a certain degree of uncertainty and that any investment of this nature involves a high level of risk for which the users are solely responsible and liable. We assume no liability for any loss arising from any investment made based on the information provided in this communication. This communication must not be reproduced or further distributed without our prior written permission. -

Market Technical Analysis by RoboForex
RBFX Support replied to RBFX Support's topic in Technical Analysis
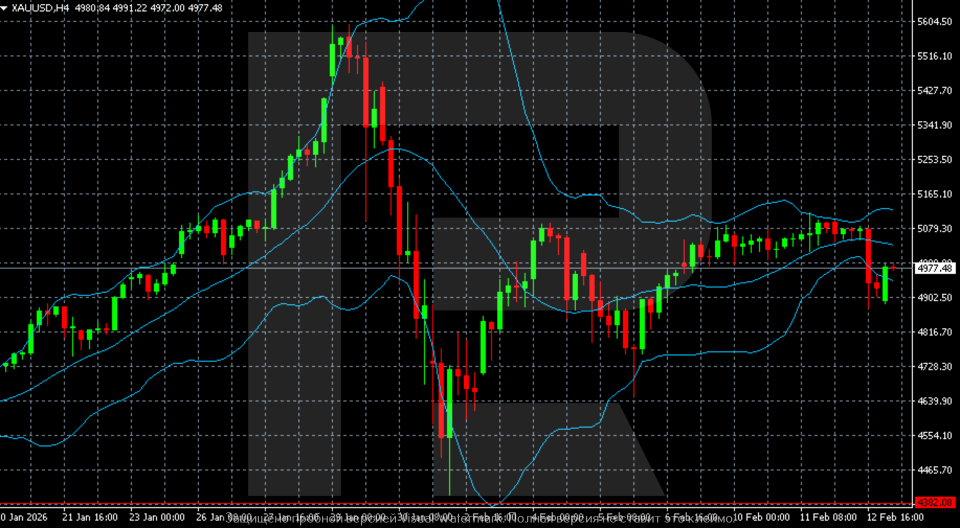
Gold (XAUUSD) fell sharply without a clear trigger: the week may close in negative territory Gold (XAUUSD) prices returned to 4,960 USD after yesterday’s sharp drop. Markets appear to need liquidity again. Find more details in our analysis for 13 February 2026. XAUUSD technical analysis After January’s surge towards 5,500+, gold (XAUUSD) entered a phase of sharp correction and high volatility. The decline was accompanied by widening Bollinger Bands and long candlestick wicks, reflecting active position redistribution. Gold has recovered after yesterday’s sell-off, although risks remain. Read more - Gold Forecast Attention! Forecasts presented in this section only reflect the author’s private opinion and should not be considered as guidance for trading. RoboForex bears no responsibility for trading results based on trading recommendations described in these analytical reviews. Sincerely, The RoboForex Team
-
roboforex Market Fundamental Analysis by RoboForex
RBFX Support replied to RBFX Support's topic in Fundamental Analysis
AUDUSD on the verge of a breakout: how a decline in US CPI and RBA policy may strengthen the AUD After testing the 2023 highs, the AUDUSD pair is forming a correction before a further rise. Quotes are hovering around 0.7050. Discover more in our analysis for 13 February 2026. AUDUSD forecast: key takeaways US core Consumer Price Index: previously at 2.6%, projected at 2.5% Inflation above 3.0% in Australia is unacceptable, according to the RBA AUDUSD forecast for 13 February 2026: 0.7140 Fundamental analysis Today’s AUDUSD forecast favours the Australian dollar, which has strong chances to continue recovering against the USD after completing the current correction. At this stage, the pair is trading around 0.7050. The core CPI measures changes in the cost of goods and services from the consumer’s perspective. This index is a key gauge of consumer purchasing dynamics and inflation. Fundamental analysis for 13 February 2026 takes into account that the actual January core CPI reading may decline to 2.5% compared to the previous period, indicating easing inflationary pressure. RoboForex Market Analysis & Forex Forecasts Attention! Forecasts presented in this section only reflect the author’s private opinion and should not be considered as guidance for trading. RoboForex bears no responsibility for trading results based on trading recommendations described in these analytical reviews. Sincerely, The RoboForex Team -
@Ninja_On_The_Roof