⤴️-Paid Ad- Check advertising disclaimer here. Add your banner here.🔥
All Activity
- Past hour
-
It was not working i want this one can some one uploade thanks in advance
-
 Please help me get the latest version of the indicator TDU Footprint Trader crack, i have TDU Footprint Trader v1.0.0.17 and i want the new version. Thanks
 - Today
-
@Ninja_On_The_Roof can you upload the quantvue elite pack my asking license thanks in advance
-
Apmoo hasn't been on for awhile, maybe he left the forum.
-
ALL wickedrenko MNq 21r Mym 14r Mgc 21r
-
They are doing a 3 day trading session during the market. 4-21 - 4-23. http://www.gotomeet.me/kwikpopes Use the link below for the next 3 days to join us at 7.30 central time for live market training, bring your questions and we will do our best to answer them. About 2 HRS from today. https://workupload.com/file/9qQ2DeA65Km
-
Yes, I noticed the same. you dont need it anyway since it exists on oppisite signal
-
 FalconFactory reacted to a post in a topic:
fixed .. ORS Fusion and Axios
FalconFactory reacted to a post in a topic:
fixed .. ORS Fusion and Axios
-

roboforex Market Fundamental Analysis by RoboForex
RBFX Support replied to RBFX Support's topic in Fundamental Analysis
USDJPY is full of strength: there are few reasons for a trend reversal The USDJPY pair moved to 158.91 on Tuesday, with the yen remaining under pressure due to uncertainty over Bank of Japan policy. Discover more in our analysis for 21 April 2026. USDJPY forecast: key takeaways The USDJPY pair is in positive territory due to the Bank of Japan’s ambiguous stance Japan remains dependent on energy imports USDJPY forecast for 21 April 2026: 159.50 Fundamental analysis The USDJPY rate is hovering near 158.91, with the Japanese yen remaining under pressure amid unclear signals from the regulator. The Bank of Japan will most likely keep the rate unchanged this month. It needs time to assess the economic impact of the Middle East conflict. At the same time, a signal to resume policy normalisation may be given as early as June. There is a possibility that the regulator will raise its inflation forecasts while lowering its growth estimates, given rising energy prices and the overall negative backdrop. RoboForex Market Analysis & Forex Forecasts Attention! Forecasts presented in this section only reflect the author’s private opinion and should not be considered as guidance for trading. RoboForex bears no responsibility for trading results based on trading recommendations described in these analytical reviews. Sincerely, The RoboForex Team -
Market Technical Analysis by RoboForex
RBFX Support replied to RBFX Support's topic in Technical Analysis
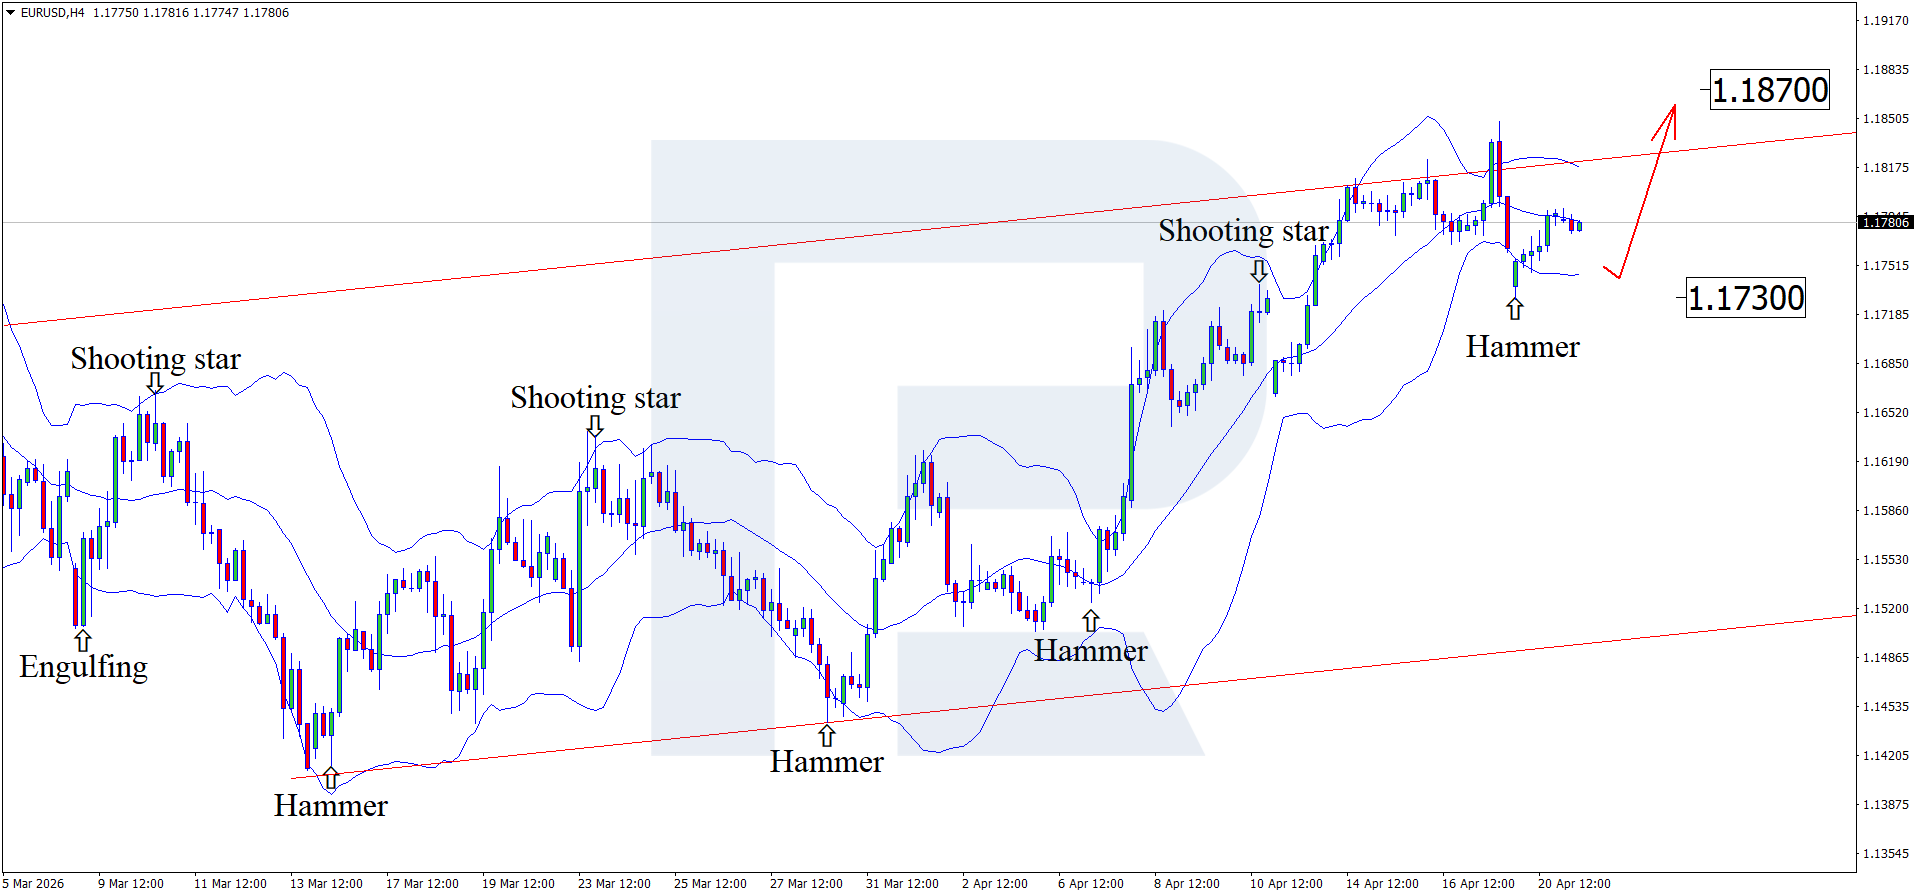
EURUSD on the edge of a sharp move: who will win – diplomacy or geopolitics After rising, the EURUSD rate is forming a correction and remains under pressure from the Middle East conflict. EURUSD quotes are hovering around 1.1775. Find out more in our analysis for 21 April 2026. Technical outlook On the H4 chart, the EURUSD pair formed a Hammer reversal pattern near the lower Bollinger Band. At this stage, quotes may continue their upward movement following this signal. Since they remain within an ascending channel, the 1.1870 resistance level may act as the upside target. The conflict in the Middle East remains the main trigger for the EURUSD rate. Read more - EURUSD Forecast Attention! Forecasts presented in this section only reflect the author’s private opinion and should not be considered as guidance for trading. RoboForex bears no responsibility for trading results based on trading recommendations described in these analytical reviews. Sincerely, The RoboForex Team
-
⭐ Iqbal reacted to a post in a topic:
barsedgetrader.com
-
kimsam reacted to a post in a topic:
NQ Ultra - Futures Trading Bot // https://tradegreater.com/
-

NQ Ultra - Futures Trading Bot // https://tradegreater.com/
Ajkw2023 replied to luludulu's topic in Ninja Trader 8
everytime i run this, eventually it freezes the NT chart screen (i have the latest version too), any1 know why? -
kingmob6 reacted to a post in a topic:
barsedgetrader.com
-
techfo reacted to a post in a topic:
NINZA INDIES - FREE OF CONSUSION - FRUSTRATION - HEADACHES - TIME
-
techfo reacted to a post in a topic:
NQ Ultra - Futures Trading Bot // https://tradegreater.com/
-
techfo reacted to a post in a topic:
NQ Ultra - Futures Trading Bot // https://tradegreater.com/
-
Oana SSS reacted to a post in a topic:
NQ Ultra - Futures Trading Bot // https://tradegreater.com/
-
fxzero.dark reacted to a post in a topic:
House Of Live Trades
-
anyone got this share pls ?
- Yesterday
-
Need Infinity Algo Engine to work with this
-
I also missed 🤦🏻♂️
-
Welcome to Indo-Investasi.com. Please feel free to browse around and get to know the others. If you have any questions please don't hesitate to ask.
-
 jesusisking joined the community
 -
Also provided earlier by @apmoo https://workupload.com/file/bHGKzLbJRDF
-
Hopefully someone can record the webinar.
-
Provided earlier by @apmoo https://workupload.com/file/2zZHDyPEJPf
-
Market Technical Analysis by RoboForex
RBFX Support replied to RBFX Support's topic in Technical Analysis
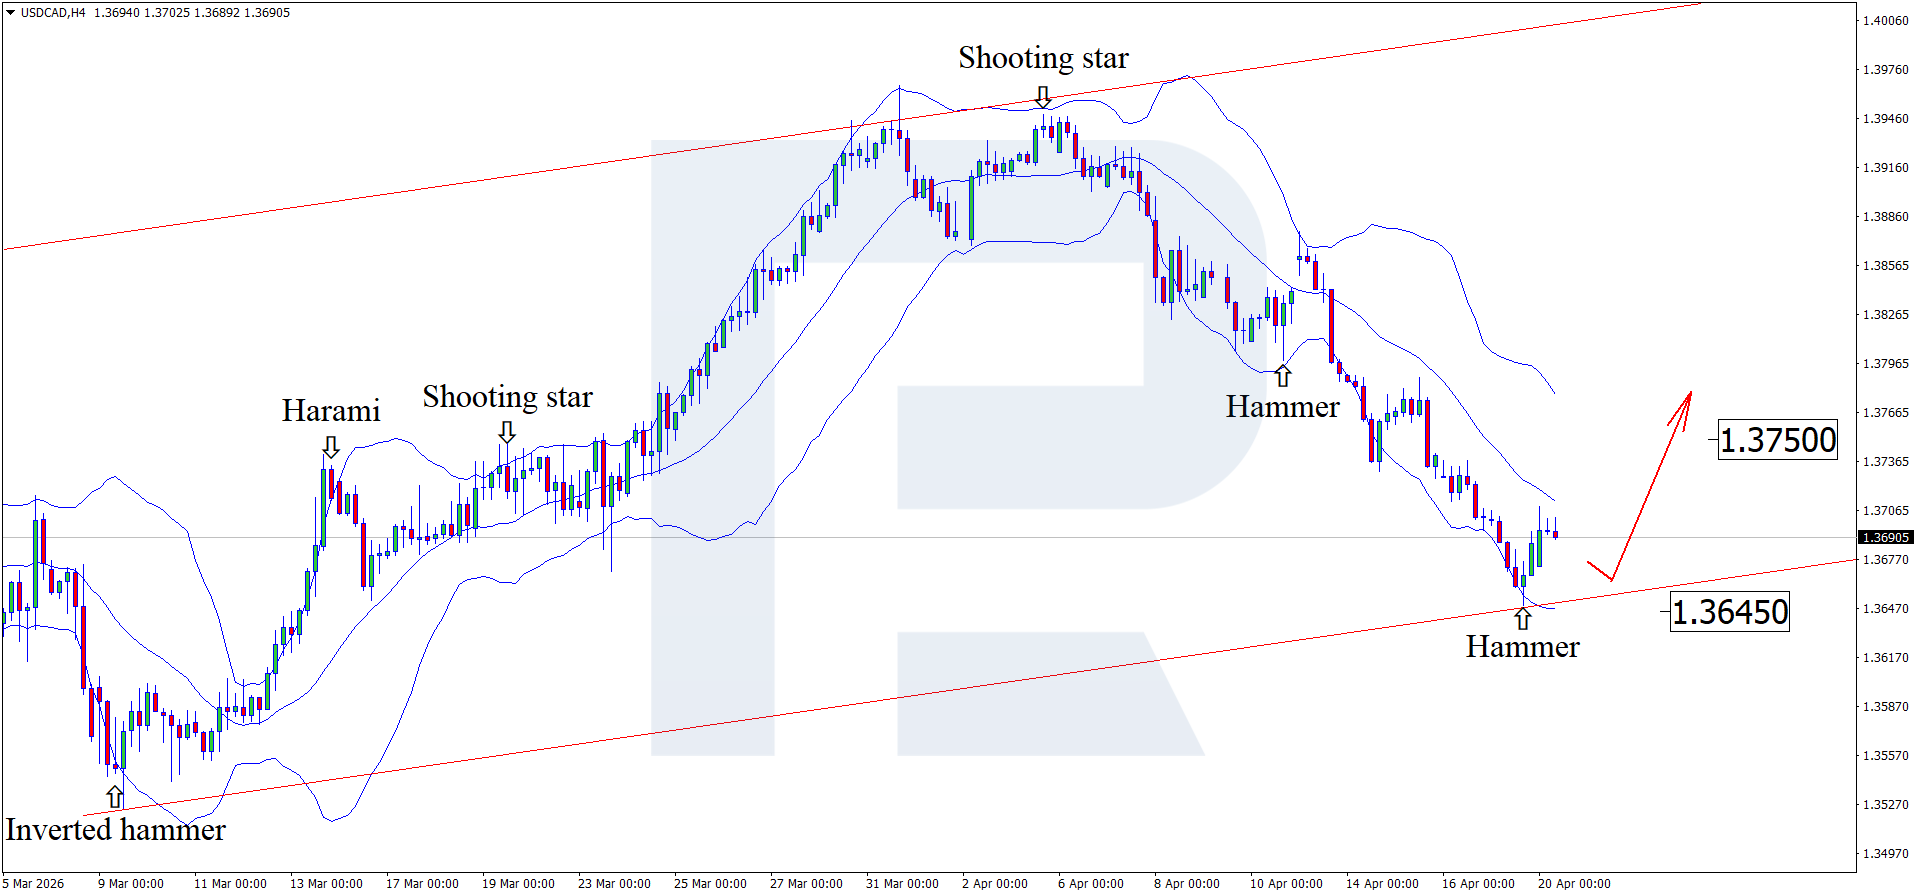
Risk aversion or high oil prices: what will prevail in USDCAD After declining, the USDCAD pair is forming a pullback while waiting for data from Canada. Quotes are trading around 1.3680. Find out more in our analysis for 20 April 2026. Technical outlook On the H4 chart, the USDCAD pair formed a Hammer reversal pattern near the lower Bollinger Band. At this stage, after the correction, it may continue the upward wave following this signal. Since quotes are within an ascending channel, growth towards the nearest resistance level at 1.3750 may be expected. The USDCAD pair remains under the influence of geopolitics and oil prices, which are supporting the CAD. Read more - USDCAD Forecast Attention! Forecasts presented in this section only reflect the author’s private opinion and should not be considered as guidance for trading. RoboForex bears no responsibility for trading results based on trading recommendations described in these analytical reviews. Sincerely, The RoboForex Team
-
roboforex Market Fundamental Analysis by RoboForex
RBFX Support replied to RBFX Support's topic in Fundamental Analysis
DE 40 forecast: the index has recovered all losses driven by the US-Iran conflict The uptrend in the DE 40 stock index continues and may lead to a new all-time high. The DE 40 forecast for today is positive. DE 40 forecast: key takeaways Recent data: Germany’s CPI for March increased by 2.7% year-on-year Market impact: the data creates a negative backdrop for the German equity market Fundamental analysis The increase in Germany’s annual inflation to 2.7%, in line with forecasts but significantly higher than the previous reading of 1.9%, may have a moderately negative impact on the DE 40 index. The fact that the figure matched expectations reduces the risk of a sharp market reaction, as market participants may have already partially priced in this outcome. For the DE 40 index, this creates a mixed but rather cautious backdrop. On the one hand, the fact that the forecast has not been exceeded could support the market and limit pressure on equities. On the other hand, the 2.7% reading remains above the comfort level for the European Central Bank, which may reduce expectations of a more accommodative monetary policy in the coming months. RoboForex Market Analysis & Forex Forecasts Attention! Forecasts presented in this section only reflect the author’s private opinion and should not be considered as guidance for trading. RoboForex bears no responsibility for trading results based on trading recommendations described in these analytical reviews. Sincerely, The RoboForex Team -

HFMarkets (hfm.com): Market analysis services.
AllForexnews replied to AllForexnews's topic in Fundamental Analysis
Date: 20th April 2026. Oil Prices Surge After the Strait of Hormuz Closure | Markets Brace for Volatility. Oil Prices Surge as the Strait of Hormuz Closes Again, Boosting Market Volatility Global financial markets opened the week under pressure as oil prices surged following renewed tensions in the Middle East. The sudden closure of the Strait of Hormuz, one of the world’s most critical oil routes, has reintroduced volatility across commodities, currencies, and equities. The development comes at a sensitive time, with investors also focusing on a heavy week of US corporate earnings, creating a complex market environment driven by both geopolitics and fundamentals. Oil Prices Jump on Supply Fears Crude oil markets reacted sharply to the escalating situation. US crude rose over 5% to around $87 per barrel, while Brent crude climbed above $95 after gaining as much as 7.9% earlier in the session. The rally followed Iran’s decision to reverse its reopening of the Strait of Hormuz, citing tensions linked to a US naval presence. The move has raised concerns about disruptions to global supply, as the route handles nearly 20% of global oil and LNG flows. Donald Trump confirmed that a US Navy blockade of Iranian ports remains in place and announced the seizure of an Iranian-linked vessel. The escalation has heightened fears of further conflict between the United States and Iran. Sector Impact: Energy Gains, Transport Under Pressure Rising oil prices are already driving divergence across sectors. Energy stocks are benefiting from higher crude prices, while industries sensitive to fuel costs, such as airlines and transport, are facing pressure. Consumer-related sectors may also be affected if higher energy costs translate into increased inflation. This rotation reinforces the idea that markets are becoming more sector-driven rather than broadly directional. Stock Markets Show Resilience Despite Rising Risk Despite the sharp rise in oil prices, global equity markets have remained relatively stable. Asian markets moved higher, with gains in Japan’s Nikkei 225, South Korea’s Kospi, and Hong Kong’s Hang Seng Index. This suggests investors are not fully pricing in a worst-case scenario. Instead, markets appear to be reacting cautiously to headlines while maintaining a degree of optimism. However, US stock futures edged lower, with the S&P 500 pulling back after recently hitting record highs. The shift reflects growing sensitivity to rising energy costs and geopolitical uncertainty. Earnings Season Offsets Geopolitical Pressure One key reason equities are holding up is the ongoing US earnings season, which is expected to be a major market driver this week. Strong corporate results and forward guidance are helping to support investor sentiment, even as macro risks increase. This is creating a more selective market environment, where individual stocks and sectors are moving more than the broader indices. Dollar Strength Signals Caution In currency markets, the US Dollar strengthened, particularly against the Japanese yen, signalling a mild shift towards risk-off sentiment. A stronger dollar is significant because it can: pressure commodities priced in USD weigh on emerging markets limit gains in gold and cryptocurrencies Gold prices, notably, declined slightly despite geopolitical tensions, highlighting how currency movements are currently shaping market behaviour. Market Outlook: Oil and Geopolitics in Focus Looking ahead, the direction of markets will largely depend on developments in the Middle East and whether the Strait of Hormuz reopens. If tensions escalate further, oil prices could continue to rise, increasing inflation risks and weighing on global growth. On the other hand, any progress in US-Iran negotiations could quickly stabilise energy markets and support risk assets. For now, investors are navigating a market shaped by headline-driven volatility, where oil prices, geopolitical developments, and earnings results are all playing a critical role. Key Takeaway for Traders The current market environment is being driven by a combination of rising oil prices, geopolitical tensions, and earnings season momentum. Oil remains the primary driver of sentiment, with the US Dollar acting as a confirmation signal, while equities are increasingly influenced by company-specific results. Always trade with strict risk management. Your capital is the single most important aspect of your trading business. Please note that times displayed based on local time zone and are from time of writing this report. Click HERE to access the full HFM Economic calendar. Want to learn to trade and analyse the markets? Join our webinars and get analysis and trading ideas combined with better understanding of how markets work. Click HERE to register for FREE! Click HERE to READ more Market news. Andria Pichidi HFMarkets Disclaimer: This material is provided as a general marketing communication for information purposes only and does not constitute an independent investment research. Nothing in this communication contains, or should be considered as containing, an investment advice or an investment recommendation or a solicitation for the purpose of buying or selling of any financial instrument. All information provided is gathered from reputable sources and any information containing an indication of past performance is not a guarantee or reliable indicator of future performance. Users acknowledge that any investment in Leveraged Products is characterized by a certain degree of uncertainty and that any investment of this nature involves a high level of risk for which the users are solely responsible and liable. We assume no liability for any loss arising from any investment made based on the information provided in this communication. This communication must not be reproduced or further distributed without our prior written permission. -

Is trading analysis or just pure speculation?
binaryowner replied to Bambang Sugiarto's topic in General Forex Discussions
Еrading starts with analysis, but the final execution is still a controlled speculation. The real difference is risk management, because a trader works with probability while a gambler works with hope -
Request To Reupload
-
TI menu should be enabled by the patch/loader, banker releases the TS_NNA_*.exe which are enabling the AI menu. Not sure what is wrong with the TI being disabled, can you show me which patcher/loader were you using?
-
 Try this, custom/indicators then compile and restart. https://renkokings.com/product/king-order-block RenkoKings_KingOrderBlock.cs