⤴️-Paid Ad- Check advertising disclaimer here. Add your banner here.🔥
All Activity
- Past hour
-

Rocket Jet accurate trading system for Amibroker
Puzzle replied to ⭐ Atomo12345's topic in Amibroker
//www.aflcode.com _SECTION_BEGIN("Chart Settings"); SetChartOptions(0,chartShowArrows|chartShowDates); SetChartBkColor(ParamColor("Outer Panel",colorBlack)); SetChartBkGradientFill(ParamColor("Upper Chart",colorDarkTeal),ParamColor("Lower Chart",colorBlack)); GraphXSpace=Param("GraphXSpace",10,0,100,1); dec = (Param("Decimals",2,0,7,1)/10)+1; bi = BarIndex(); Lbi = LastValue(BarIndex()); sbi = SelectedValue(bi); x1= BarCount-1; Title = EncodeColor(55)+ Title = Name() + " " + EncodeColor(32) + Date() + " " + EncodeColor(5) + "{{INTERVAL}} " + EncodeColor(55)+ " Open = "+ EncodeColor(52)+ WriteVal(O,dec) + EncodeColor(55)+ " High = "+ EncodeColor(5) + WriteVal(H,dec) + EncodeColor(55)+ " Low = "+ EncodeColor(32)+ WriteVal(L,dec) + EncodeColor(55)+ " Close = "+ EncodeColor(52)+ WriteVal(C,dec)+ EncodeColor(55)+ " Volume = "+ EncodeColor(52)+ WriteVal(V,1); _SECTION_END(); _SECTION_BEGIN( "BASERECTANGEL" ); GfxSelectFont( "Arial", 10, 100 ); GfxSetBkMode( 1 ); GfxSetTextColor( colorBlue ); GfxSelectSolidBrush( colorDarkTeal ); GfxSelectPen( colorBlue, 1 ); // broader color GfxRectangle(0,15,203,400); _SECTION_END(); _SECTION_BEGIN( "BASERECTANGEL" ); GfxSelectFont( "Arial", 10, 100 ); GfxSetBkMode( 1 ); GfxSetTextColor( colorBlue ); GfxSelectSolidBrush( colorDarkTeal ); GfxSelectPen( colorBlue, 1 ); // broader color GfxRectangle(202,15,300,400); _SECTION_END(); _SECTION_BEGIN("res/sup-s1"); DayH = TimeFrameGetPrice("H", inDaily, -1);// yesterdays high DayL = TimeFrameGetPrice("L", inDaily, -1);//low DayC = TimeFrameGetPrice("C", inDaily, -1);//close DayO = TimeFrameGetPrice("O", inDaily);// current day open HiDay = TimeFrameGetPrice("H", inDaily); LoDay = TimeFrameGetPrice("L", inDaily); PP = (DayH + DayL + DayO + DayO) / 4 ; R1 = (2 * PP) - DayL; S1 = (2 * PP) - DayH; R2 = PP + R1 - S1; S2 = PP + S1 - R1; R3 = R2 + (R1 - PP); S3 = S2 - (PP - S1); style = styleLine | styleThick + styleNoRescale; rcolor = colorBlue; scolor = colorRed; pcolor = colorGreen; GfxSelectFont("arial", 10, 700 ); GfxSetBkMode( colorWhite ); GfxSetTextColor( ParamColor("Color",colorRed) ); Hor=Param("Horizontal Position",230,10,1200,1); Ver=Param("Vertical Position",230,300,500,500); GfxTextOut(""+s1,Hor , Ver ); _SECTION_END(); _SECTION_BEGIN("res/sup-s2"); GfxSelectFont("arial", 10, 700 ); GfxSetBkMode( colorWhite ); GfxSetTextColor( ParamColor("Color",colorRed) ); Hor=Param("Horizontal Position",230,10,1200,1); Ver=Param("Vertical Position",260,300,500,500); GfxTextOut(""+s2,Hor , Ver ); _SECTION_END(); _SECTION_BEGIN("res/sup-s3"); GfxSelectFont("arial", 10, 700 ); GfxSetBkMode( colorWhite ); GfxSetTextColor( ParamColor("Color",colorRed) ); Hor=Param("Horizontal Position",230,10,1200,1); Ver=Param("Vertical Position",290,300,600,600); GfxTextOut(""+s3,Hor , Ver ); _SECTION_END(); _SECTION_BEGIN("res/sup-r1"); GfxSelectFont("arial", 10, 700 ); GfxSetBkMode( colorWhite ); GfxSetTextColor( ParamColor("Color",colorGreen) ); Hor=Param("Horizontal Position",230,10,1200,1); Ver=Param("Vertical Position",320,300,500,500); GfxTextOut(""+r1,Hor , Ver ); _SECTION_END(); _SECTION_BEGIN("res/sup-r2"); GfxSelectFont("arial", 10, 700 ); GfxSetBkMode( colorWhite ); GfxSetTextColor( ParamColor("Color",colorGreen) ); Hor=Param("Horizontal Position",230,10,1200,1); Ver=Param("Vertical Position",350,300,500,500); GfxTextOut(""+r2,Hor , Ver ); _SECTION_END(); _SECTION_BEGIN("res/sup-r3"); GfxSelectFont("arial", 10, 700 ); GfxSetBkMode( colorWhite ); GfxSetTextColor( ParamColor("Color",colorGreen) ); Hor=Param("Horizontal Position",230,10,1200,1); Ver=Param("Vertical Position",380,300,500,500); GfxTextOut(""+r3,Hor , Ver ); _SECTION_END(); _SECTION_BEGIN("MACD"); r1 = Param( "Fast avg", 12, 2, 200, 1 ); r2 = Param( "Slow avg", 26, 2, 200, 1 ); r3 = Param( "Signal avg", 9, 2, 200, 1 ); r4 = Param( "Wk slow", 17, 2, 200, 1 ); r5 = Param( "Wk fast", 8, 2, 200, 1 ); m1=MACD(r1,r2); s1=Signal(r1,r2,r3); _SECTION_END(); _SECTION_BEGIN("WRITE"); GfxSelectFont("arial", 8, 700 ); GfxSetBkMode( colorLightBlue ); GfxSetTextColor( ParamColor("Color",colorLightBlue) ); Hor=Param("Horizontal Position",0,10,1200,1); Ver=Param("Vertical Position",385,100,50,50); GfxTextOut(" R O C K E T J E T",Hor , Ver ); _SECTION_END(); _SECTION_BEGIN("Forex_Main_mrtq13"); /////////////////////////////////// Title = EncodeColor(colorWhite)+ Title = Name () + " | " +EncodeColor(colorYellow) + Date() + " | " +EncodeColor(colorTurquoise)+ "O : "+ EncodeColor(colorLightGrey)+ O + " | " +EncodeColor(colorTurquoise)+ "H : "+ EncodeColor(colorLightGrey)+ H + " | " +EncodeColor(colorTurquoise)+ "L : "+ EncodeColor(colorLightGrey)+ L + " | " +EncodeColor(colorTurquoise)+ "C : "+ WriteIf(C> Ref(C, -1),EncodeColor(colorBrightGreen),EncodeColor(colorRed))+ C + " | " +EncodeColor(colorTurquoise)+ "Change : ("+ WriteIf(C> Ref(C, -1),EncodeColor(colorBrightGreen),EncodeColor(colorRed)) + WriteVal(C-Ref(C,-1))+" Rs." +EncodeColor(colorTurquoise)+ " /"+ WriteIf(C> Ref(C, -1),EncodeColor(colorBrightGreen),EncodeColor(colorRed))+ WriteVal( ROC( C, 1 ))+""+ " % " +EncodeColor(colorTurquoise)+ ") | Volume : " + WriteIf(V> Ref(V, -1),EncodeColor(colorBrightGreen),EncodeColor(colorRed))+ WriteVal(V,1) ; _SECTION_END(); _SECTION_BEGIN("Flower"); Show_color = ParamToggle("Display CandleColor", "No|Yes", 1); r1 = Param( "ColorFast avg", 5, 2, 200, 1 ); r2 = Param( "ColorSlow avg", 10, 2, 200, 1 ); r3 = Param( "ColorSignal avg", 5, 2, 200, 1 ); Prd1=Param("ATR Period",4,1,20,1); Prd2=Param("Look Back",7,1,20,1); green = HHV(LLV(L,Prd1)+ATR(Prd1),Prd2); red = LLV(HHV(H,Prd1)-ATR(Prd1),Prd2); flowerClose = EMA((Open+High+Low+Close)/4,3) ; flowerOpen = EMA((Ref(Open,-1) + Ref(flowerClose,-1))/2,3); Temp = Max(High, flowerOpen); flowerHigh = EMA(Max(Temp, flowerClose),3); Temp = Min(Low,flowerOpen); flowerLow = EMA(Min(Temp, flowerClose),3); m1=MACD(r1,r2); s1=Signal(r1,r2,r3); mycolor=IIf(m1<0 AND m1>s1, colorYellow,IIf(m1>0 AND m1>s1,colorWhite,IIf(m1>0 AND m1<s1,colorDarkYellow,colorRed))); if(Show_color) { ColorHighliter = myColor; SetBarFillColor( ColorHighliter ); } barColor=IIf(C>Green ,colorWhite,IIf(C < RED,colorRed,colorWhite)); PlotOHLC( IIf(flowerOpen<flowerClose, flowerOpen, flowerClose),flowerHigh,flowerLow,IIf(flowerOpen<flowerClose, flowerClose, flowerOpen), "Close", barColor, styleNoTitle | styleCandle); _SECTION_END(); _SECTION_BEGIN("Bands"); SupResB =Param("Sup-Res Short",6,0,100,1); nn=SupResB; Bandlinecol=ParamColor("SupResLineColor",ColorRGB(82,82,82)); ParmCloud = ParamToggle("Cloud", "No|Yes", 0); BoxCloudColor=ParamColor("BoxCloudColor",ColorRGB(27,27,27)); Line2=Param("ResLineLength",100,2,500,0.1); Daysback1 = Line2; FirstBar1 = BarCount - DaysBack1; Hh=HHV(flowerHigh,nn); LL=LLV(flowerLow,nn); Res2=Hh; Sup2=LL; BandRes=IIf(BarIndex() >= Firstbar1,EndValue(Res2),Null); BandSup=IIf(BarIndex() >= Firstbar1,EndValue(Sup2),Null); Plot(BandRes,"",Bandlinecol,ParamStyle("ShortSupBand",styleLine|styleDashed|stylehidden|styleNoTitle|styleNoLabel|styleThick,maskAll)); Plot(BandSup,"",Bandlinecol,ParamStyle("ShortResBand",styleLine|styleDashed|stylehidden|styleNoTitle|styleNoLabel|styleThick,maskAll)); CS=BandRes; CR=BandSup; if(parmCloud == 1) PlotOHLC( CS, CS, CR,CR, "Band",BoxCloudColor, styleCloud | styleNoLabel|styleNoTitle); _SECTION_END(); _SECTION_BEGIN("Breakout Setting"); Buyperiods=Param("Breakout periods best is usually 18",5,1,100,1,1); Sellperiods=Param("Exit Breakout",5,1,100,1,1); HaClose =EMA((O+H+L+C)/4,3); // Woodie //HaClose =(O+H+L+C)/4; HaOpen = AMA( Ref( HaClose, -1 ), 0.5 ); HaHigh = Max( H, Max( HaClose, HaOpen ) ); HaLow = Min( L, Min( HaClose, HaOpen ) ); Buy= C>Ref(HHV(High,Buyperiods),-1) ; Sell= C<Ref(LLV(Low,Sellperiods),-1); /* exrem is one method to remove surplus strade signals. It removes excessive signals of arrow */ Buy = ExRem(Buy, Sell); Sell = ExRem(Sell, Buy); PlotShapes( IIf( Buy, shapeSmallUpTriangle, shapeNone ), colorWhite, layer = 0,yposition = HaLow, offset = -30); //PlotShapes( IIf( Buy, shapeSmallCircle, shapeNone ), colorWhite, layer = 0,yposition = HaLow, offset = -8); PlotShapes( IIf( Sell, shapeSmallDownTriangle, shapeNone ), colorRed, layer = 0, yposition = HaHigh, offset = -30); //PlotShapes( IIf( Sell, shapeSmallCircle, shapeNone ), colorRed, layer = 0, yposition = HaHigh, offset = -8); _SECTION_END(); _SECTION_BEGIN("Graphics"); GrpPrm=Param("Graphic Space",-5,-10,10); GraphXSpace=GrpPrm; _SECTION_END(); //#include <T3.AFL>; _SECTION_BEGIN("PFE"); pds=10; x=sqrt((ROC(C,9)*ROC(C,9))+100); y=Sum(sqrt((ROC(C,1)* ROC(C,1))+1),pds); z=(x/y); pfe=EMA(IIf(C>Ref(C,-9),z,-z)*100,5); rsidn=pfe <-10 AND pfe<Ref(pfe,-1); rsiup=pfe >10 AND pfe>Ref(pfe,-1); rsiresult1 = WriteIf( rsiup,"cu", ""); rsiresult2 = WriteIf( rsidn,"cd", ""); RequestTimedRefresh( 0 ); GfxSelectFont( "Tahoma", 12, 120 ); GfxSetBkMode( 1 ); GfxSetTextColor( colorWhite ); if ( rsiresult1 =="cu") { GfxSelectSolidBrush( ColorRGB(0,90,0) ); } else if ( rsiresult2 =="cd") { GfxSelectSolidBrush( ColorRGB(90,0,0)); } else if ( rsiresult2 =="") { GfxSelectSolidBrush( colorDarkTeal ); } GfxSelectFont( "Arial", 10, 100 ); GfxSetBkMode( 1 ); GfxSetTextColor( colorBlue ); GfxCircle( 100,90,50 ); _SECTION_END(); //GfxRoundRect( 15,305,135,215, 5, 5 ); GfxCircle( 100,100,70 ); _SECTION_END(); _SECTION_BEGIN("STC"); _SECTION_BEGIN("Schaff Trend Cycle"); /* Ported directly from original STC Tradestation code results differ from other Amibroker versions that are not based directly on original EasyLanguage code http://mediaserver.fxstreet.com/Reports/99afdb5f-d41d-4a2c-802c-f5d787df886c/ebfbf387-4b27-4a0f-848c-039f4ab77c00.pdf */ MA1=23; MA2=50; TCLen=10; MA1=Param("ShortMACDLen",23,5,36); MA2=Param("LOngMACDLen",50,10,100); TCLen=Param("TCLen(StochPeriod)",10,5,20); Factor=.5; //Calculate a MACD Line XMac = MACD(MA1,MA2) ; // MACD in Amibroker always uses Close for MACD calculation //1st Stochastic: Calculate Stochastic of a MACD Value1 = LLV(XMac, TCLen); Value2 = HHV(XMac, TCLen) - Value1; //Frac1=1; // prime Frac1 to a default of 1 //Frac1 = IIf(Value2 > 0, ((XMac - Value1) / Value2) * 100, Ref(FRAC1,-1)); // have to "prime" first value so that reference to "i-1" does not result in subscript out of range // since MACD for both periods is not defined until MA2 period, 0 seems to be mathematically correct priming value frac1=0; for (i = 1; i < BarCount; i++) { if (Value2[i] > 0) { frac1[i] = ((XMac[i] - Value1[i])/Value2[i])*100; } else { frac1[i]= frac1[i-1]; } } //Smoothed calculation for %FastD of MACD PF[0]=frac1[0]; PF[1]=frac1[1]; for (i = 2; i < BarCount; i++) { PF[i]=PF[i-1]+(Factor*(frac1[i]-PF[i-1])); } //2nd Stochastic: Calculate Stochastic of Smoothed Percent FastD, above. Value3 = LLV(PF, TCLen); Value4 = HHV(PF, TCLen) - Value3; //%FastK of PF /* Frac2=1; Frac2 = IIf(Value4 > 0, ((PF - Value3) / Value4) * 100, Ref(FRAC2,-1)); */ frac2[0]=0; for (i = 1; i < BarCount; i++) { if (Value4[i] > 0 ) { frac2[i]=((PF[i] - Value3[i])/Value4[i])*100; } else { frac2[i]=frac2[i-1]; } } //Smoothed calculation for %FastD of PF PFF[0]=frac2[0]; PFF[1]=frac2[1]; for (i = 2; i < BarCount; i++) { PFF[i]=PFF[i-1]+(Factor*(frac2[i]-PFF[i-1])); } //HT=ParamColor("HT", colorRed ); rsidn=pff <2; rsiup=pff >98; rsiresult1 = WriteIf( rsiup,"cu", ""); rsiresult2 = WriteIf( rsidn,"cd", ""); RequestTimedRefresh( 0 ); GfxSelectFont( "Tahoma", 12, 120 ); GfxSetBkMode( 1 ); GfxSetTextColor( colorWhite ); if ( rsiresult1 =="cu") { GfxSelectSolidBrush( ColorRGB(0,120,0) ); } else if ( rsiresult2 =="cd") { GfxSelectSolidBrush( ColorRGB(120,0,0)); } else if ( rsiresult2 =="") { GfxSelectSolidBrush( colorDarkTeal ); } GfxSelectFont( "Arial", 10, 100 ); GfxSetBkMode( 1 ); GfxSetTextColor( colorBlue ); GfxCircle( 100,100,60 ); _SECTION_END(); _SECTION_BEGIN("rsi"); //HT=ParamColor("HT", colorRed ); rsidn=RSI(7) <30; rsiup=RSI(7) >70; rsiresult1 = WriteIf( rsiup,"cu", ""); rsiresult2 = WriteIf( rsidn,"cd", ""); RequestTimedRefresh( 0 ); GfxSelectFont( "Tahoma", 12, 120 ); GfxSetBkMode( 1 ); GfxSetTextColor( colorWhite ); if ( rsiresult1 =="cu") { GfxSelectSolidBrush( ColorRGB(0,150,0) ); } else if ( rsiresult2 =="cd") { GfxSelectSolidBrush( ColorRGB(150,0,0)); } else if ( rsiresult2 =="") { GfxSelectSolidBrush( colorDarkTeal ); } GfxSelectFont( "Arial", 10, 100 ); GfxSetBkMode( 1 ); GfxSetTextColor( colorBlue ); GfxCircle( 100,100,50 ); _SECTION_END(); _SECTION_BEGIN("Rays"); //FT=ParamColor("FT", colorRed ); Pp1=3; Pp2=2; CS33=HHV(LLV(flowerHigh,Pp1)-ATR(Pp2),4); CR33=HHV(LLV(flowerHigh,Pp1)-ATR(Pp2),5); AtrupTrendCond1 = flowerClose> CS33 ; AtrdnTrendCond1 =CS33>flowerClose ; ATRup = WriteIf(AtrupTrendCond1,"atrup", ""); ATRdown= WriteIf( AtrdnTrendCond1,"atrdn", ""); if ( ATRup =="atrup") { GfxSelectSolidBrush( ColorRGB(0,180,0) ); } else if (ATRdown =="atrdn") { GfxSelectSolidBrush( ColorRGB(180,0,0)); } else if ( ATRdown =="") { GfxSelectSolidBrush( colorDarkTeal ); } GfxSelectFont( "Arial", 10, 100 ); GfxSetBkMode( 1 ); GfxSetTextColor( colorBlue ); GfxSelectPen( colorBlue, 1 ); // broader color GfxCircle( 100,100,40 ); _SECTION_END(); _SECTION_BEGIN("Exit_Beast-3"); //GT=ParamColor("GT", colorRed ); EntrylookbackPeriod=10; EntryATRperiod=1.9; EntrySig = C > ( LLV( flowerLow, EntrylookbackPeriod ) + EntryATRperiod * ATR( 10 ) ); ExitSig = C < ( HHV( flowerHigh, EntrylookbackPeriod ) -EntryATRperiod * ATR( 10 ) ); RequestTimedRefresh( 0 ); GfxSelectFont( "Tahoma", 12, 100 ); GfxSetBkMode( 1 ); GfxSetTextColor( colorWhite ); EntryB = WriteIf( EntrySig,"eu", ""); ExitB = WriteIf( ExitSig,"ed", ""); if ( EntryB =="eu") { GfxSelectSolidBrush( ColorRGB(0,210,0) ); // } else if ( ExitB =="ed") { GfxSelectSolidBrush( ColorRGB(210,0,0)); // } else if ( ExitB =="") { GfxSelectSolidBrush( colorDarkTeal ); } GfxSelectFont( "Arial", 10, 100 ); GfxSetBkMode( 1 ); GfxSetTextColor( colorBlue ); GfxSelectPen( colorBlue, 1 ); // broader color GfxCircle( 100,100,30 );// changing the value of x,y,rad x-70, y-90, rad-24 _SECTION_END(); _SECTION_BEGIN("CCI9-2"); //HT=ParamColor("HT", colorRed ); ccidn=CCI(8) < 0; cciup=CCI(9) > 0; ccresult1 = WriteIf( cciup,"cu", ""); ccresult2 = WriteIf( ccidn,"cd", ""); RequestTimedRefresh( 0 ); GfxSelectFont( "Tahoma", 12, 100 ); GfxSetBkMode( 1 ); GfxSetTextColor( colorWhite ); if ( ccresult1 =="cu") { GfxSelectSolidBrush( ColorRGB(0,240,0) ); } else if ( ccresult2 =="cd") { GfxSelectSolidBrush( ColorRGB(240,0,0)); } else if ( ccresult2 =="") { GfxSelectSolidBrush( colorDarkTeal ); } GfxSelectFont( "Arial", 10, 100 ); GfxSetBkMode( 1 ); GfxSetTextColor( colorBlue ); GfxSelectPen( colorBlue, 1 ); // broader color GfxCircle( 100,100,20); _SECTION_END(); _SECTION_BEGIN("%BB7-1"); //IT=ParamColor("IT", colorRed ); p=7; x=((C+2*StDev(C,p)-MA(C,p))/(4*StDev(C,p)))*100; bbdown= x < 40; bbup= x > 40; bbresult1 = WriteIf( bbup,"bu", ""); bbresult2 = WriteIf( bbdown,"bd", ""); bbresult3 = WriteIf( C,"bearishrevers", ""); RequestTimedRefresh( 0 ); GfxSelectFont( "Tahoma", 12, 100 ); GfxSetBkMode( 1 ); GfxSetTextColor( colorWhite ); if ( bbresult1 =="bu") { GfxSelectSolidBrush( ColorRGB(62,255,62) ); } else if ( bbresult2 =="bd") { GfxSelectSolidBrush( ColorRGB(255,62,62) ); } else if ( bbresult2 =="") { GfxSelectSolidBrush( colorDarkTeal ); } GfxSelectFont( "Arial", 10, 100 ); GfxSetBkMode( 1 ); GfxSetTextColor( colorBlue ); GfxSelectPen( colorBlue, 1 ); // broader color GfxCircle( 100,100,10 ); _SECTION_END(); _SECTION_BEGIN("MACDHIGHBULLISH"); r1 = Param( "Fast avg", 12, 2, 200, 1 ); r2 = Param( "Slow avg", 26, 2, 200, 1 ); r3 = Param( "Signal avg", 9, 2, 200, 1 ); r4 = Param( "Wk slow", 17, 2, 200, 1 ); r5 = Param( "Wk fast", 8, 2, 200, 1 ); m1=MACD(r1,r2); s1=Signal(r1,r2,r3); rsidn=m1>0 AND m1>s1; rsiresult2 = WriteIf( rsidn,"cd", ""); if ( rsiresult2 =="cd") { GfxSelectSolidBrush( ColorRGB(0,147,0)); } else if ( rsiresult2 =="") { GfxSelectSolidBrush( colorDarkTeal ); } RequestTimedRefresh( 0 ); GfxSelectFont( "Arial", 10, 100 ); GfxSetBkMode( 1 ); GfxSetTextColor( colorBlue ); GfxSelectPen( colorBlue, 1 ); // broader color GfxRectangle(80,220,120,280); _SECTION_END(); _SECTION_BEGIN("MACDLOWHBULLISH"); r1 = Param( "Fast avg", 12, 2, 200, 1 ); r2 = Param( "Slow avg", 26, 2, 200, 1 ); r3 = Param( "Signal avg", 9, 2, 200, 1 ); r4 = Param( "Wk slow", 17, 2, 200, 1 ); r5 = Param( "Wk fast", 8, 2, 200, 1 ); m1=MACD(r1,r2); s1=Signal(r1,r2,r3); rsidn=m1<0 AND m1>s1; rsiresult2 = WriteIf( rsidn,"cd", ""); if ( rsiresult2 =="cd") { GfxSelectSolidBrush( ColorRGB(0,147,0)); } else if ( rsiresult2 =="") { GfxSelectSolidBrush( colorDarkTeal ); } RequestTimedRefresh( 0 ); GfxSelectFont( "Arial", 10, 100 ); GfxSetBkMode( 1 ); GfxSetTextColor( colorBlue ); GfxSelectPen( colorBlue, 1 ); // broader color GfxRectangle(120,315,180,280); _SECTION_END(); _SECTION_BEGIN("MACDLOWHBEARISH"); r1 = Param( "Fast avg", 12, 2, 200, 1 ); r2 = Param( "Slow avg", 26, 2, 200, 1 ); r3 = Param( "Signal avg", 9, 2, 200, 1 ); r4 = Param( "Wk slow", 17, 2, 200, 1 ); r5 = Param( "Wk fast", 8, 2, 200, 1 ); m1=MACD(r1,r2); s1=Signal(r1,r2,r3); rsidn=m1>0 AND m1<s1; rsiresult2 = WriteIf( rsidn,"cd", ""); if ( rsiresult2 =="cd") { GfxSelectSolidBrush( ColorRGB(225,0,0)); } else if ( rsiresult2 =="") { GfxSelectSolidBrush( colorDarkTeal ); } RequestTimedRefresh( 0 ); GfxSelectFont( "Arial", 10, 100 ); GfxSetBkMode( 1 ); GfxSetTextColor( colorBlue ); GfxSelectPen( colorBlue, 1 ); // broader color GfxRectangle(20,315,80,280); _SECTION_END(); _SECTION_BEGIN("MACDHIGHHBEARISH"); r1 = Param( "Fast avg", 12, 2, 200, 1 ); r2 = Param( "Slow avg", 26, 2, 200, 1 ); r3 = Param( "Signal avg", 9, 2, 200, 1 ); r4 = Param( "Wk slow", 17, 2, 200, 1 ); r5 = Param( "Wk fast", 8, 2, 200, 1 ); m1=MACD(r1,r2); s1=Signal(r1,r2,r3); rsidn=m1<0 AND m1<s1; rsiresult2 = WriteIf( rsidn,"cd", ""); if ( rsiresult2 =="cd") { GfxSelectSolidBrush( ColorRGB(225,0,0)); } else if ( rsiresult2 =="") { GfxSelectSolidBrush( colorDarkTeal ); } RequestTimedRefresh( 0 ); GfxSelectFont( "Arial", 10, 100 ); GfxSetBkMode( 1 ); GfxSetTextColor( colorBlue ); GfxSelectPen( colorBlue, 1 ); // broader color GfxRectangle(80,375,120,315); _SECTION_END(); _SECTION_BEGIN("bearishline"); GfxSelectFont( "Arial", 10, 100 ); GfxSetBkMode( 1 ); GfxSetTextColor( colorRed ); GfxSelectPen( colorRed, 1 ); GfxMoveTo( 25,320 ); GfxLineTo( 75, 370 ); _SECTION_END(); _SECTION_BEGIN("bullishline"); GfxSelectFont( "Arial", 10, 100 ); GfxSetBkMode( 1 ); GfxSetTextColor( colorGreen ); GfxSelectPen( colorGreen, 1 ); GfxMoveTo( 125,225 ); GfxLineTo( 175, 275 ); _SECTION_END(); _SECTION_BEGIN("volume1"); GfxSelectSolidBrush( colorDarkTeal ); GfxRoundRect(240,30,260,200,20,20); _SECTION_END(); _SECTION_BEGIN("volume2"); GfxSelectSolidBrush( colorDarkTeal ); GfxCircle( 250,180,23 ); _SECTION_END(); _SECTION_BEGIN("spiker"); C1 = Ref(C, -1); uc = C > C1; dc = C <= C1; ud = C > O; dd = C <= O; green = 1; blue = 2; yellow = 3; red = 4; white = 5; VType = IIf(ud, IIf(uc, green, yellow), IIf(dd, IIf(dc, red, blue), white)); /* green volume: up-day and up-close*/ gv = IIf(VType == green, V, 0); /* yellow volume: up-day but down-close */ yv = IIf(VType == yellow, V, 0); /* red volume: down-day and down-close */ rv = IIf(VType == red, V, 0); /* blue volume: down-day but up-close */ bv = IIf(VType == blue, V, 0); uv = gv + bv; uv1 = Ref(uv, -1); /* up volume */ dv = rv + yv; dv1 = Ref(dv, -1); /* down volume */ VolPer = Param("Adjust Vol. MA per.", 10, 1, 255, 1); ConvPer = Param("Adjust Conv. MA per.", 4, 1, 255, 1); MAuv = TEMA(uv, VolPer ); mauv1 = Ref(mauv, -1); MAdv = TEMA(dv, VolPer ); madv1 = Ref(madv, -1); MAtv = TEMA(V, VolPer );//total volume Converge = (TEMA(MAuv - MAdv, ConvPer)); Converge1 = Ref(Converge, -1); ConvergeUp = Converge > Converge1; ConvergeOver = Converge > 0; rising = ConvergeUp AND ConvergeOver; falling = !ConvergeUp AND ConvergeOver; _SECTION_END(); _SECTION_BEGIN("vol30"); rsiup=rising; rsidn=falling; down=Converge > 0; rsiresult1 = WriteIf( rsiup,"ab", ""); rsiresult2 = WriteIf( rsidn,"cd", ""); rsiresult3 = WriteIf( down,"ef", ""); RequestTimedRefresh( 0 ); if ( rsiresult1 =="ab") { GfxSelectSolidBrush( ColorRGB(0,147,0) ); GfxSelectFont( "Arial", 10, 100 ); GfxSetBkMode( 1 ); GfxSetTextColor( colorGreen ); GfxSelectPen( colorGreen, 1 ); } else if ( rsiresult2 =="cd") { GfxSelectSolidBrush( ColorRGB(0,85,0) ); GfxSelectFont( "Arial", 10, 100 ); GfxSetBkMode( 1 ); GfxSetTextColor( colorDarkGreen ); GfxSelectPen( colorDarkGreen, 1 ); } else { GfxSelectSolidBrush( ColorRGB(255,0,0) ); GfxSelectFont( "Arial", 10, 100 ); GfxSetBkMode( 1 ); GfxSetTextColor( colorRed ); GfxSelectPen( colorRed, 1 ); } GfxRectangle(241,50,259,200); _SECTION_END(); _SECTION_BEGIN("vol31"); rsiup=rising; rsidn=falling; down=Converge > 0; rsiresult1 = WriteIf( rsiup,"ab", ""); rsiresult2 = WriteIf( rsidn,"cd", ""); rsiresult3 = WriteIf( down,"ef", ""); RequestTimedRefresh( 0 ); if ( rsiresult1 =="ab") { GfxSelectSolidBrush( ColorRGB(0,147,0) ); GfxSelectFont( "Arial", 10, 100 ); GfxSetBkMode( 1 ); GfxSetTextColor( colorGreen ); GfxSelectPen( colorGreen, 1 ); } else if ( rsiresult2 =="cd") { GfxSelectSolidBrush( ColorRGB(0,85,0) ); GfxSelectFont( "Arial", 10, 100 ); GfxSetBkMode( 1 ); GfxSetTextColor( colorDarkGreen ); GfxSelectPen( colorDarkGreen, 1 ); } else { GfxSelectSolidBrush( ColorRGB(255,0,0) ); GfxSelectFont( "Arial", 10, 100 ); GfxSetBkMode( 1 ); GfxSetTextColor( colorRed ); GfxSelectPen( colorRed, 1 ); } GfxCircle( 250,180,22 ); _SECTION_END(); _SECTION_BEGIN("Average 0"); //Average_switch = ParamToggle("Candle On/off", "Off|On"); P = HaClose; Type = ParamList("Type", "Exponential,Lagless-21,Hull-26,Linear Regression-45,Exponential,Double Exponential,Tripple Exponential,Wilders,Simple"); Periods = Param("Periods", 25, 2, 300 ); Displacement = Param("Displacement", 1, -50, 50 ); m = 0; if( Type == "Weighted" ) m= WMA( P, Periods ); if( Type == "Lagless-21" ) m= 2*EMA(P, Periods)-EMA(EMA(P, Periods), Periods); if( Type == "Hull-26" ) m= WMA(2*(WMA(P, Periods/2))-WMA(P, Periods) ,4 ); if( Type == "Linear Regression-45" ) m= LinearReg( P, Periods ); if( Type == "Exponential" ) m = EMA( P, Periods ); if( Type == "Double Exponential" ) m = DEMA( P, Periods ); if( Type == "Tripple Exponential" ) m = TEMA( P, Periods ); if( Type == "Wilders" ) m = Wilders( P, Periods ); if( Type == "Simple" ) m = MA( P, Periods ); Plot( m, _DEFAULT_NAME(), ParamColor("Color", colorGreen),ParamStyle("Style",styleLine|styleNoTitle ,maskAll),Displacement ); _SECTION_END(); _SECTION_BEGIN("Average 1"); //Average_switch = ParamToggle("Candle On/off", "Off|On"); P = HaClose; Type = ParamList("Type", "Exponential,Lagless-21,Hull-26,Linear Regression-45,Exponential,Double Exponential,Tripple Exponential,Wilders,Simple"); Periods = Param("Periods", 50, 2, 300 ); Displacement = Param("Displacement", 1, -50, 50 ); m = 0; if( Type == "Weighted" ) m= WMA( P, Periods ); if( Type == "Lagless-21" ) m= 2*EMA(P, Periods)-EMA(EMA(P, Periods), Periods); if( Type == "Hull-26" ) m= WMA(2*(WMA(P, Periods/2))-WMA(P, Periods) ,4 ); if( Type == "Linear Regression-45" ) m= LinearReg( P, Periods ); if( Type == "Exponential" ) m = EMA( P, Periods ); if( Type == "Double Exponential" ) m = DEMA( P, Periods ); if( Type == "Tripple Exponential" ) m = TEMA( P, Periods ); if( Type == "Wilders" ) m = Wilders( P, Periods ); if( Type == "Simple" ) m = MA( P, Periods ); Plot( m, _DEFAULT_NAME(), ParamColor("Color", colorYellow),ParamStyle("Style",styleLine |styleNoTitle ,maskAll),Displacement ); _SECTION_END(); _SECTION_BEGIN("Average 5"); P = HaClose; Type = ParamList("Type", "Exponential,Lagless-21,Hull-26,Linear Regression-45,Exponential,Double Exponential,Tripple Exponential,Wilders,Simple"); Periods = Param("Periods", 100, 2, 300 ); Displacement = Param("Displacement", 1, -50, 50 ); m = 0; if( Type == "Weighted" ) m= WMA( P, Periods ); if( Type == "Lagless-21" ) m= 2*EMA(P, Periods)-EMA(EMA(P, Periods), Periods); if( Type == "Hull-26" ) m= WMA(2*(WMA(P, Periods/2))-WMA(P, Periods) ,4 ); if( Type == "Linear Regression-45" ) m= LinearReg( P, Periods ); if( Type == "Exponential" ) m = EMA( P, Periods ); if( Type == "Double Exponential" ) m = DEMA( P, Periods ); if( Type == "Tripple Exponential" ) m = TEMA( P, Periods ); if( Type == "Wilders" ) m = Wilders( P, Periods ); if( Type == "Simple" ) m = MA( P, Periods ); Plot( m, _DEFAULT_NAME(), ParamColor("Color", colorGrey50),ParamStyle("Style",styleLine |styleNoTitle ,maskAll),Displacement ); _SECTION_END(); _SECTION_BEGIN("Sell Average 3"); P = HaClose; Type = ParamList("Type", "Exponential,Lagless-21,Hull-26,Linear Regression-45,Exponential,Double Exponential,Tripple Exponential,Wilders,Simple"); Periods = Param("Periods", 200, 2, 300 ); Displacement = Param("Displacement", 1, -50, 50 ); m = 0; if( Type == "Weighted" ) m= WMA( P, Periods ); if( Type == "Lagless-21" ) m= 2*EMA(P, Periods)-EMA(EMA(P, Periods), Periods); if( Type == "Hull-26" ) m= WMA(2*(WMA(P, Periods/2))-WMA(P, Periods) ,4 ); if( Type == "Linear Regression-45" ) m= LinearReg( P, Periods ); if( Type == "Exponential" ) m = EMA( P, Periods ); if( Type == "Double Exponential" ) m = DEMA( P, Periods ); if( Type == "Tripple Exponential" ) m = TEMA( P, Periods ); if( Type == "Wilders" ) m = Wilders( P, Periods ); if( Type == "Simple" ) m = MA( P, Periods ); Plot( m, _DEFAULT_NAME(), ParamColor("Color", ColorRGB(40,40,40)),ParamStyle("Style",styleLine |styleNoTitle ,maskAll),Displacement ); _SECTION_END(); _SECTION_BEGIN("trendline"); farback=Param("How Far back to go",100,50,5000,10); nBars = Param("Number of bars", 12, 5, 40); aHPivs = H - H;aLPivs = L - L; aHPivHighs = H - H;aLPivLows = L - L;aHPivIdxs = H - H;aLPivIdxs = L - L; nHPivs = 0;nLPivs = 0;lastHPIdx = 0;lastLPIdx = 0;lastHPH = 0;lastLPL = 0; curPivBarIdx = 0; aHHVBars = HHVBars(H, nBars);aLLVBars = LLVBars(L, nBars); aHHV = HHV(H, nBars);aLLV = LLV(L, nBars); aVisBars = Status("barvisible");nLastVisBar = LastValue(Highest(IIf(aVisBars, BarIndex(), 0))); _TRACE("Last visible bar: " + nLastVisBar); curBar = (BarCount-1);curTrend = "";if (aLLVBars[curBar] < aHHVBars[curBar]) { curTrend = "D";}else {curTrend = "U";} for (i=0; i<farback; i++) {curBar = (BarCount - 1) - i; if (aLLVBars[curBar] < aHHVBars[curBar]) { if (curTrend == "U") {curTrend = "D"; curPivBarIdx = curBar - aLLVBars[curBar];aLPivs[curPivBarIdx] = 1;aLPivLows[nLPivs] = L[curPivBarIdx]; aLPivIdxs[nLPivs] = curPivBarIdx;nLPivs++;} } else {if (curTrend == "D") {curTrend = "U";curPivBarIdx = curBar - aHHVBars[curBar]; aHPivs[curPivBarIdx] = 1;aHPivHighs[nHPivs] = H[curPivBarIdx]; aHPivIdxs[nHPivs] = curPivBarIdx;nHPivs++;}} } curBar = (BarCount-1);candIdx = 0;candPrc = 0;lastLPIdx = aLPivIdxs[0];lastLPL = aLPivLows[0]; lastHPIdx = aHPivIdxs[0];lastHPH = aHPivHighs[0];if (lastLPIdx > lastHPIdx) { candIdx = curBar - aHHVBars[curBar];candPrc = aHHV[curBar]; if (lastHPH < candPrc AND candIdx > lastLPIdx AND candIdx < curBar) { aHPivs[candIdx] = 1; for (j=0; j<nHPivs; j++) {aHPivHighs[nHPivs-j] = aHPivHighs[nHPivs-(j+1)]; aHPivIdxs[nHPivs-j] = aHPivIdxs[nHPivs-(j+1)];}aHPivHighs[0] = candPrc ; aHPivIdxs[0] = candIdx;nHPivs++;}} else { candIdx = curBar - aLLVBars[curBar];candPrc = aLLV[curBar];if (lastLPL > candPrc AND candIdx > lastHPIdx AND candIdx < curBar) { aLPivs[candIdx] = 1; for (j=0; j<nLPivs; j++) {aLPivLows[nLPivs-j] = aLPivLows[nLPivs-(j+1)]; aLPivIdxs[nLPivs-j] = aLPivIdxs[nLPivs-(j+1)];}aLPivLows[0] = candPrc; aLPivIdxs[0] = candIdx;nLPivs++;}} for (k=0; k<nHPivs; k++) {_TRACE("High pivot no. " + k + " at barindex: " + aHPivIdxs[k] + ", " + WriteVal(ValueWhen(BarIndex()==aHPivIdxs[k], DateTime(), 1), formatDateTime)+ ", " + aHPivHighs[k]);} a1=ahpivs==1;a2=alpivs==1; x = ***(1);s1=L;s11=H;pS = a2 == 1; endt= SelectedValue(ValueWhen( pS, x, 1 )); startt=SelectedValue(ValueWhen( pS, x, 2 ));dtS =endt-startt; endS = SelectedValue(ValueWhen( pS, s1, 1 ) ); startS = SelectedValue( ValueWhen( pS, s1, 2 ));aS = (endS-startS)/dtS; bS = endS;trendlineS = aS * ( x -endt ) + bS; g3= IIf(x>startt-10,trendlineS,-1e10); pR = a1== 1;endt1= SelectedValue(ValueWhen( pR, x, 1 )); startt1=SelectedValue(ValueWhen( pR, x, 2 )); dtR =endt1-startt1;endR = SelectedValue(ValueWhen( pR, s11, 1 ) ); startR = SelectedValue( ValueWhen( pR, s11, 2 )); aR = (endR-startR)/dtR;bR = endR; trendlineR = aR * ( x -endt1 ) + bR; g4= IIf(x>startT1-10,trendlineR,-1e10); _SECTION_END(); _SECTION_BEGIN("trendlineA"); dn=g3>C; up=g3<C; bbresult1 = WriteIf( dn,"dn", ""); bbresult2 = WriteIf( up,"up", ""); RequestTimedRefresh( 0 ); if ( bbresult1 =="dn") { GfxSelectSolidBrush( ColorRGB(255,0,0) ); } else if ( bbresult2 =="up") { GfxSelectSolidBrush( ColorRGB(0,147,0) ); } GfxSelectFont( "Arial", 10, 100 ); GfxSetBkMode( 1 ); GfxSetTextColor( colorWhite ); GfxSelectPen( colorWhite, 1 ); GfxCircle( 30,229,8 ); _SECTION_END(); _SECTION_BEGIN("trendlineA"); dn=g3>C; up=g3<C; bbresult1 = WriteIf( dn,"dn", ""); bbresult2 = WriteIf( up,"up", ""); RequestTimedRefresh( 0 ); if ( bbresult1 =="dn") { GfxSelectSolidBrush( ColorRGB(255,0,0) ); } else if ( bbresult2 =="up") { GfxSelectSolidBrush( ColorRGB(0,147,0) ); } GfxSelectFont( "Arial", 10, 100 ); GfxSetBkMode( 1 ); GfxSetTextColor( colorWhite ); GfxSelectPen( colorWhite, 1 ); GfxCircle( 168,367,8 ); _SECTION_END(); _SECTION_BEGIN("TRENDLINEline"); GfxSelectFont( "Arial", 10, 100 ); GfxSetBkMode( 1 ); GfxSetTextColor( colorWhite ); GfxSelectPen( colorWhite, 1 ); GfxMoveTo( 35,234 ); GfxLineTo( 163, 362 ); _SECTION_END(); _SECTION_BEGIN("traing sl"); function vstop_func(trBull,trBear) { trailArray[ 0 ] = C[ 0 ]; // initialize for( i = 1; i < BarCount; i++ ) { prev = trailArray[ i - 1 ]; if (C[ i ] > prev AND C[ i - 1 ] > prev) { trailArray[ i ] = Max(prev,C[ i ] - trBull[ i ]); } else if (C[ i ] < prev AND C[ i - 1 ] < prev) { trailArray[ i ] = Min(prev,C[ i ] + trBear[ i ]); } else if (C[ i ] > prev) { trailArray[ i ] = C[ i ] - trBull[ i ]; } else { trailArray[ i ] = C[ i ] + trBear[ i ]; } } return trailArray; } per = Param("per",20, 1, 150, 1); multBull = Param("multBull",2, 1, 4, 0.05); multBear = Param("multBear",2, 1, 4, 0.05); trBull = multBull * ATR(per); trBear = multBear * ATR(per); trailArray = vstop_func(trBull,trBear); s0=trailArray; s1= s0 > C ; s2= s0 <C ; ccresult1 = WriteIf( s1,"cu", ""); ccresult2 = WriteIf( s2,"cd", ""); GfxSelectFont("arial", 13, 700 ); GfxSetBkMode( colorRed); GfxSetTextColor( ParamColor("Color",colorRed) ); Hor=Param("Horizontal Position",30,10,1200,1); Ver=Param("Vertical Position",185,100,50,50); if ( ccresult1 =="cu") { GfxTextOut(""+s0,Hor , Ver ); } else GfxSelectFont("arial", 13, 700 ); GfxSetBkMode( colorGreen ); GfxSetTextColor( ParamColor("Color",colorGreen) ); Hor=Param("Horizontal Position",75,10,1200,1); Ver=Param("Vertical Position",185,100,50,50); if ( ccresult2 =="") { GfxTextOut(""+s0,Hor , Ver ); } _SECTION_END(); _SECTION_BEGIN("traing s2"); s0=trailArray; s1= s0 > C ; s2= s0 <C ; ccresult1 = WriteIf( s1,"cu", ""); ccresult2 = WriteIf( s2,"cd", ""); GfxSelectFont("arial", 13, 700 ); GfxSetBkMode( colorBrightGreen ); GfxSetTextColor( ParamColor("Color",colorBrightGreen) ); Hor=Param("Horizontal Position",30,10,1200,1); Ver=Param("Vertical Position",185,100,50,50); if ( ccresult2 =="cd") { GfxTextOut(""+s0,Hor , Ver ); } else GfxSelectFont("arial", 13, 700 ); GfxSetBkMode( colorWhite ); GfxSetTextColor( ParamColor("Color",colorWhite) ); Hor=Param("Horizontal Position",75,10,1200,1); Ver=Param("Vertical Position",185,100,50,50); if ( ccresult1 =="") { GfxTextOut(""+s0,Hor , Ver ); } _SECTION_END(); _SECTION_BEGIN("CMP"); GfxSelectFont("arial", 13, 700 ); GfxSetBkMode( colorWhite ); GfxSetTextColor( ParamColor("Color",colorWhite) ); Hor=Param("Horizontal Position",120,10,1200,1); Ver=Param("Vertical Position",185,100,50,50); GfxTextOut(""+C,Hor , Ver ); _SECTION_END(); _SECTION_BEGIN("buycircle"); GfxSelectFont( "Arial", 10, 100 ); GfxSetBkMode( 1 ); GfxSetTextColor( colorBlue ); GfxSelectPen( colorBlue, 1 ); if ( ccresult2 =="cd") { GfxSelectSolidBrush( ColorRGB(0,255,0) ); } else { GfxSelectSolidBrush( ColorRGB(0,0,94) ); } GfxCircle( 20,40,7 ); _SECTION_END(); _SECTION_BEGIN("sellcircle"); GfxSelectFont( "Arial", 10, 100 ); GfxSetBkMode( 1 ); GfxSetTextColor( colorBlue ); GfxSelectPen( colorBlue, 1 ); if ( ccresult1 =="cu") { GfxSelectSolidBrush( ColorRGB(255,0,0) ); } else { GfxSelectSolidBrush( ColorRGB(0,0,94) ); } GfxCircle( 180,40,7 ); _SECTION_END(); _SECTION_BEGIN("Bollinger Bands"); P = ParamField("Price field",-1); Periods = Param("Periods", 20, 2, 300 ); Width = Param("Width", 2, 0, 10, 0.05 ); Color = ParamColor("Color", colorCycle ); Style = ParamStyle("Style"); Plot( BBandTop( P, Periods, Width ), "BBTop" + _PARAM_VALUES(), Color, StyleDashed ); Plot( BBandBot( P, Periods, Width ), "BBBot" + _PARAM_VALUES(), Color, StyleDashed ); _SECTION_END(); _SECTION_BEGIN("EMA1"); P = ParamField("Price field",-1); Periods = Param("Periods", 20, 2, 300 ); Plot( EMA( P, Periods ), _DEFAULT_NAME(), ParamColor( "Color", Color ), StyleDashed ); _SECTION_END(); -
Which one of them all that you are using, if I might ask?
-
https://limewire.com/d/9xJPC#YgePhUEfIt
-
I havent touched them for quite sometimes. Only hope that they would do something good for you. https://limewire.com/d/5Z8xv#nB2YgIrdqr I believe, PurePattern is the one you were looking for.
- Today
-

Rocket Jet accurate trading system for Amibroker
tradingsol replied to ⭐ Atomo12345's topic in Amibroker
Atomo sir this Rocket Jet afl is not working in Windows 10 64bit any reason ?? and Amibroker is not opening but working in back ground .pls Help me out. Thanks For Your Time. -
Looks like some fancy interface but could be useful: https://ibb.co/JjZk0CJF
-
Bring it on friends
-
 Daimon Rigor reacted to a post in a topic:
Dynamic Trader Ver 8
Daimon Rigor reacted to a post in a topic:
Dynamic Trader Ver 8
- Yesterday
-
Can someone please re upload? @Ninja_On_The_Roof ?
-
If someone can educate this, let us know. thanks VolumeAI.zip
- 1 reply
-
- 1
-
-
Just check his site http://forex-warez.com/
-
⭐ laser1000it reacted to a post in a topic:
Latest EDU Neurostreet Arc-Ai
-
Wasn't that already cracked by Rooster on the old TSRH forum?
-
⭐ RichardGere reacted to a post in a topic:
Anyone can educate with Viper Trading Indicator?
-
Ninja_On_The_Roof reacted to a post in a topic:
Latest EDU Neurostreet Arc-Ai
-
Of course, I've tried adjusting some settings and searching for tutorials, but without success. I don't typically trade on futures (or rather, I only do so with government european bonds), but I enjoy exploring NT8 add-ons
-
 ScoobyDoo reacted to a post in a topic:
Hedge Fund Trender
ScoobyDoo reacted to a post in a topic:
Hedge Fund Trender
-
Buy and Sell dots, refreshing, appearing and disappearing, back and forth. In some ways, some folks might call that "repainting". I have tried it. Many moons ago. Then it became one of those memories.🤗
- 1 reply
-
- 1
-
-
How many ways are there to use and or to trade using VWAP.🤗Really.
-

Anyone can educate with Viper Trading Indicator?
Ninja_On_The_Roof replied to Tasfy's topic in Ninja Trader 8
Viper in my opinion, not a plug in and play straight out from the box. It needs a decent amount of time studying and knowing how to use it correctly. A steep learning curve. On top of that, the chart trader alone is over overwhelming to even look at.😂 -
⭐ goldeneagle1 reacted to a post in a topic:
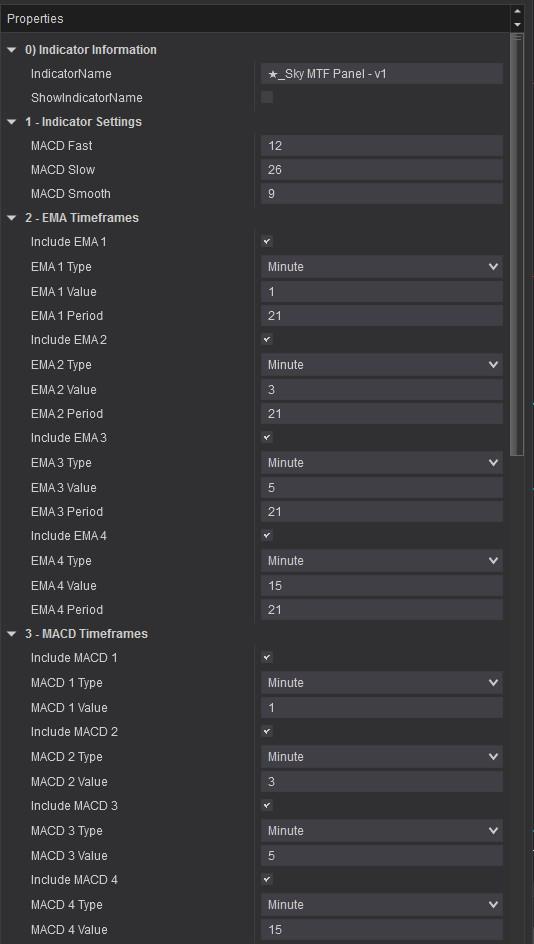
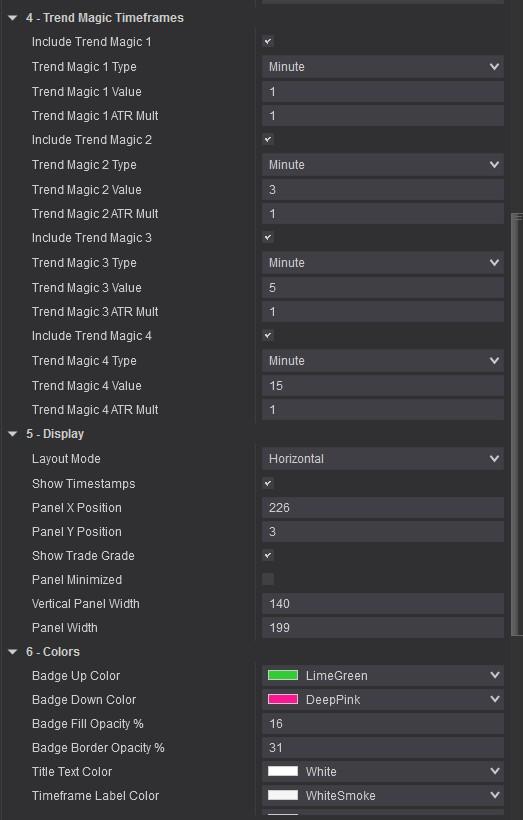
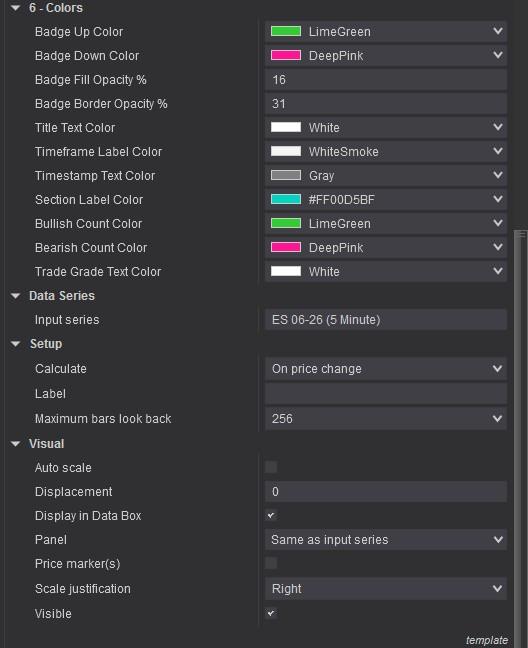
Sky's MTF Panel
-
⭐ goldeneagle1 reacted to a post in a topic:
DeepStack Confluence
-
⭐ goldeneagle1 reacted to a post in a topic:
Latest EDU Neurostreet Arc-Ai
-
Have you looked in the settings? If I recall, there are boxes to check or uncheck for live or historical trading. Besides all that, make sure to play with target and stoploss, as the default comes with like 8 ticks of stoploss. That is, nuts, to me. Especially if you trade NQ.
-
Multi-TimeframeFu$ion was already good, this is even better because not only has the multi-timeframe features but also allows the conflunece of multiple indicators too. This is one of those few tools from Ninza that is worth have. @kimsam Can you please help use with this one? Thank you https://workupload.com/file/JA5VLf6aC8Q
-
- 1
-
-

roboforex Market Fundamental Analysis by RoboForex
RBFX Support replied to RBFX Support's topic in Fundamental Analysis
Brent is back in positive territory: geopolitics is setting the course Brent prices rose to 103.03 USD, with all eyes on the situation in the Strait of Hormuz. Discover more in our analysis for 12 May 2026. Brent forecast: key takeaways Brent prices are climbing higher due to the ongoing Middle East conflict The market is on edge and is increasing the risk premium as the US shifts its stance Brent forecast for 12 May 2026: 103.30 and 106.00 Fundamental analysis Brent quotes advanced to 103.03 USD per barrel on Tuesday, with the market supported by persistent concerns about the situation in the Strait of Hormuz following new statements from US President Donald Trump. Trump said that the ceasefire between the US and Iran is in a critical state after Washington rejected Tehran’s latest peace proposal. This increased fears that the Strait of Hormuz may remain effectively closed for a prolonged period. RoboForex Market Analysis & Forex Forecasts Attention! Forecasts presented in this section only reflect the author’s private opinion and should not be considered as guidance for trading. RoboForex bears no responsibility for trading results based on trading recommendations described in these analytical reviews. Sincerely, The RoboForex Team -
⭐ ajeet reacted to a post in a topic:
Valto$ Pack
-
Market Technical Analysis by RoboForex
RBFX Support replied to RBFX Support's topic in Technical Analysis
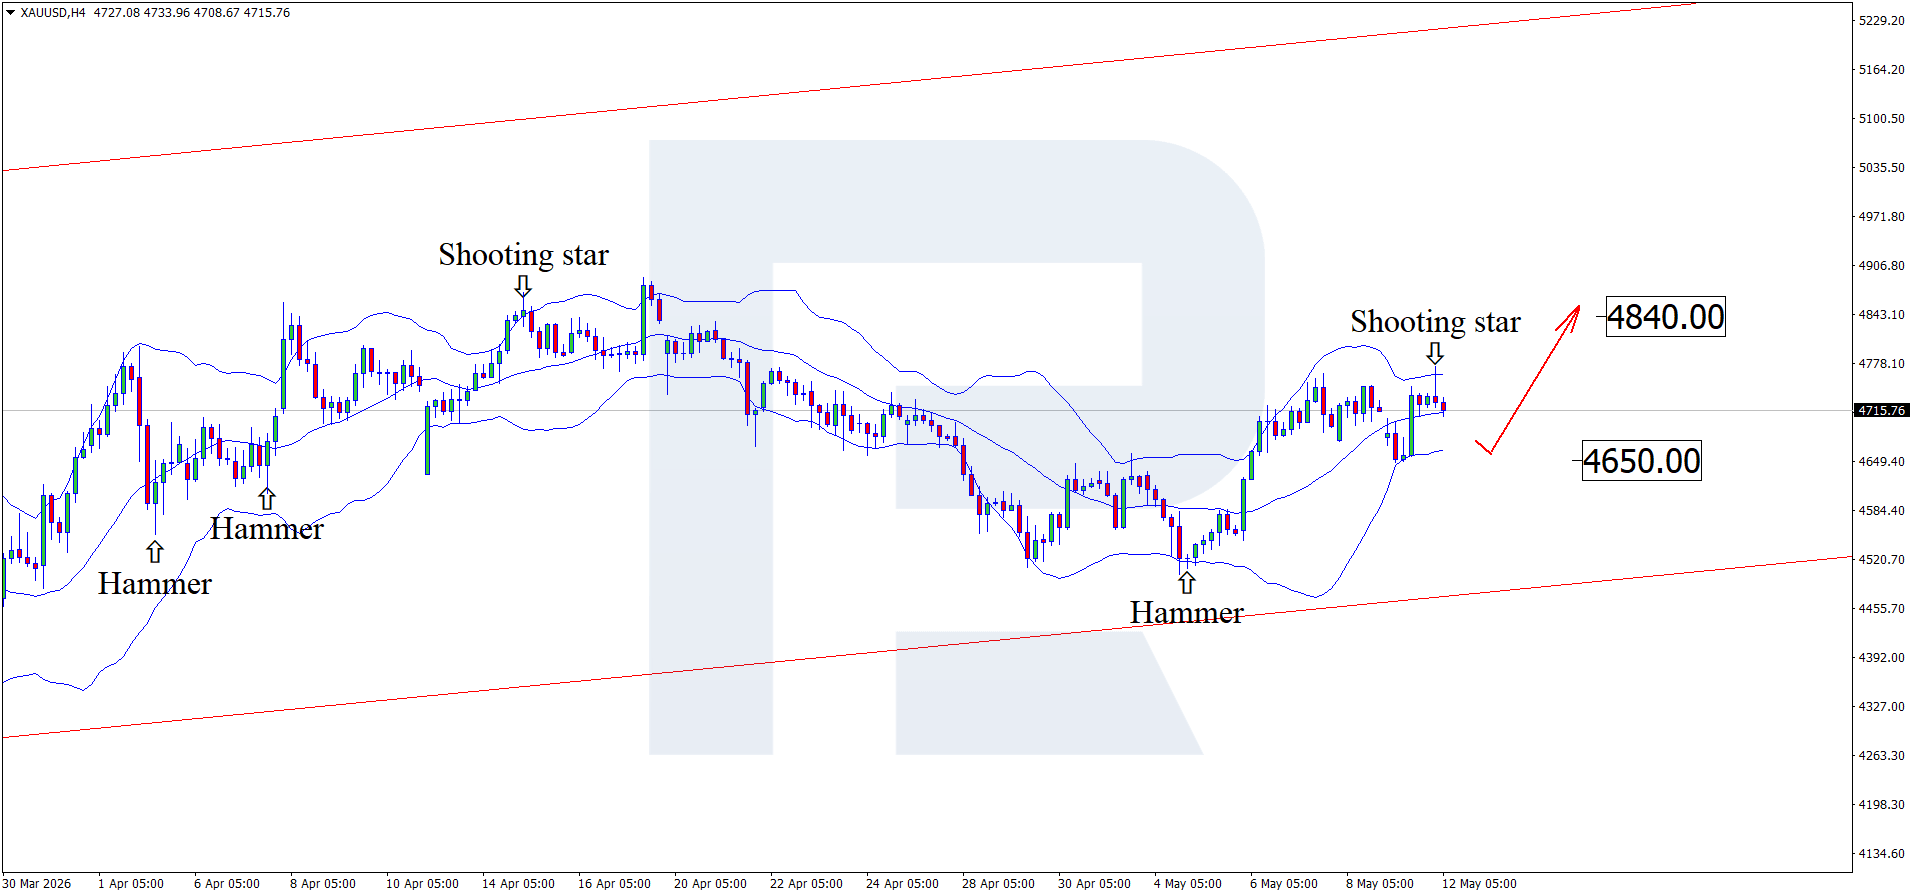
XAUUSD on hold, US CPI will determine the direction After reaching new May highs, XAUUSD prices are forming a correction and awaiting the US CPI release. Quotes currently stand at 4,715 USD. Discover more in our analysis for 12 May 2026. Technical outlook On the H4 chart, XAUUSD prices formed a Shooting Star reversal pattern near the upper Bollinger Band. As the pattern signal plays out, quotes may form a corrective wave. Since XAUUSD prices remain within an ascending channel, the 4,650 USD support level could be the downside target. Gold remains under the influence of geopolitical risks and US inflation. Read more - Gold Forecast Attention! Forecasts presented in this section only reflect the author’s private opinion and should not be considered as guidance for trading. RoboForex bears no responsibility for trading results based on trading recommendations described in these analytical reviews. Sincerely, The RoboForex Team
-
It seems strategy not working in realtime (show only the historical data)..... Have you tried it out yet?
-
Thank you very much BRO!!!!!
-

HFMarkets (hfm.com): Market analysis services.
AllForexnews replied to AllForexnews's topic in Fundamental Analysis
Date: 12th May 2026. AI Rally Faces Its Biggest Test as Inflation and Oil Risks Rise. US stock futures traded lower Tuesday morning as traders prepared for one of the most important inflation reports of the year, while geopolitical tensions in the Middle East continued adding pressure across global markets. Although the S&P 500 and Nasdaq recently climbed to fresh record highs, driven largely by semiconductor and AI-related stocks, investor sentiment is becoming increasingly cautious ahead of April’s Consumer Price Index (CPI) release and growing uncertainty surrounding the US-Iran conflict. The combination of surging oil prices, inflation fears, Federal Reserve uncertainty, and aggressive AI-driven market momentum is creating a volatile environment across equities, forex, commodities, and crypto markets. Markets Turn Cautious Ahead of Inflation Data Wall Street futures edged lower in early trading, with Nasdaq futures underperforming as traders reduced risk exposure ahead of the CPI release. Markets expect April inflation to rise by 3.7%, and investors are closely watching whether higher energy prices linked to the Middle East conflict are beginning to feed more aggressively into the broader economy. The inflation report could significantly shape expectations for Federal Reserve policy during the second half of 2026, particularly after the stronger-than-expected US jobs report earlier this month reduced expectations for immediate rate cuts. A hotter inflation reading may pressure technology stocks, strengthen the US dollar, and push Treasury yields higher. On the other hand, softer inflation data could reinforce bullish momentum across risk assets and revive expectations for future Fed easing. AI and Semiconductor Stocks Continue Driving the Rally Despite rising macroeconomic risks, the AI trade remains the dominant force behind the market rally. Semiconductor stocks once again pushed the S&P 500 and Nasdaq to record highs on Monday as investors continued rotating aggressively into artificial intelligence infrastructure plays. The market narrative is also evolving beyond GPUs. While Nvidia initially became the symbol of the AI boom through GPU dominance, investors are increasingly shifting focus towards CPUs and broader AI infrastructure as agentic AI systems expand globally. These next-generation AI systems require greater real-time processing power, enterprise integration, and data-centre capacity, broadening the number of companies benefiting from AI demand. Asian markets also reflected this strength, with Japan’s Nikkei and South Korea’s Kospi climbing higher on the back of strong technology sentiment. For traders, semiconductor momentum continues acting as one of the clearest indicators of overall market risk appetite. Oil Prices Above $100 Increase Inflation Concerns At the same time, oil markets are becoming a growing source of instability. Brent crude climbed above $104 per barrel while WTI crude approached $99 after President Donald Trump rejected Iran’s latest peace proposal and described the ceasefire agreement as being on ‘massive life support’. The ongoing tensions surrounding the Strait of Hormuz continue disrupting crude and fuel flows, increasing fears of supply shortages and broader economic fallout. Higher energy prices are already beginning to affect consumers. US gasoline prices recently climbed to a national average of $4.51 per gallon, intensifying concerns that energy-driven inflation may complicate the Federal Reserve’s policy outlook. For traders, rising oil prices now represent one of the most important macro risks facing markets this week. Markets Caught Between AI Optimism and Macro Risks Current market conditions reflect a battle between powerful bullish and bearish forces. On one side, massive AI investment, semiconductor demand, strong technology earnings, and institutional positioning continue supporting equities. On the other, rising oil prices, inflation fears, geopolitical tensions, and uncertainty surrounding future interest rates are creating growing downside risks. This leaves markets highly sensitive to economic data and geopolitical headlines, with sentiment capable of shifting rapidly. Trump-Xi Meeting Adds Another Layer of Uncertainty Investors are also closely monitoring President Trump’s visit to China, where he is expected to meet President Xi Jinping. Trade policy, artificial intelligence, semiconductor supply chains, and technology competition are expected to dominate discussions between the two leaders. The meeting could carry major implications for global technology markets, particularly as both countries continue competing for leadership in AI infrastructure and semiconductor development. Forex Markets Focus on the Yen and Central Banks Currency markets are also seeing elevated volatility. Japan confirmed ongoing coordination with the US Treasury regarding exchange-rate volatility after repeated interventions to support the yen. Despite Japan’s reported multibillion-dollar intervention efforts, the yen weakened back towards key levels that traders believe could trigger additional action from authorities. At the same time, speculation surrounding a potential Bank of Japan rate hike continues increasing as Japanese bond yields climb to multi-decade highs. For forex traders, USD/JPY remains one of the most closely watched currency pairs this week. Commodities Continue Rallying Industrial metals have also remained resilient despite geopolitical uncertainty. Copper traded near record highs after a strong rally earlier this week, supported by continued Chinese demand and concerns surrounding global supply disruptions. Zinc and silver also posted strong gains as traders reacted to supply risks and inflation concerns. The strength in commodities reflects ongoing concerns that geopolitical tensions and energy disruptions could continue feeding inflation pressures globally. What Traders Should Watch This Week Several key catalysts could determine the next move across financial markets. The US CPI report remains the primary focus, followed by producer inflation data later in the week. Traders will also closely monitor developments surrounding the Trump-Xi meeting, Middle East tensions, oil price movements, and upcoming earnings reports from major technology and semiconductor companies, including Applied Materials, Cisco, and Alibaba. Markets will pay particular attention to AI spending guidance and semiconductor demand outlooks, which may determine whether the technology rally can continue extending higher. Final Thoughts The AI-driven market rally remains remarkably strong, but the environment is becoming increasingly fragile. Rising oil prices, inflation fears, geopolitical uncertainty, and shifting Federal Reserve expectations are beginning to challenge bullish momentum across global markets. For traders, this week may become a major turning point. If inflation data remains under control and AI optimism continues dominating sentiment, equities may continue climbing towards new highs. However, any signs that higher energy prices are feeding broader inflation pressures could quickly trigger increased volatility and profit-taking across risk assets. The balance between AI-driven optimism and macroeconomic risk will likely determine the next major move in markets. Always trade with strict risk management. Your capital is the single most important aspect of your trading business. Please note that times displayed based on local time zone and are from time of writing this report. Click HERE to access the full HFM Economic calendar. Want to learn to trade and analyse the markets? Join our webinars and get analysis and trading ideas combined with better understanding of how markets work. Click HERE to register for FREE! Click HERE to READ more Market news. Andria Pichidi HFMarkets Disclaimer: This material is provided as a general marketing communication for information purposes only and does not constitute an independent investment research. Nothing in this communication contains, or should be considered as containing, an investment advice or an investment recommendation or a solicitation for the purpose of buying or selling of any financial instrument. All information provided is gathered from reputable sources and any information containing an indication of past performance is not a guarantee or reliable indicator of future performance. Users acknowledge that any investment in Leveraged Products is characterized by a certain degree of uncertainty and that any investment of this nature involves a high level of risk for which the users are solely responsible and liable. We assume no liability for any loss arising from any investment made based on the information provided in this communication. This communication must not be reproduced or further distributed without our prior written permission. -
Can someone reupload please, thanks in advance.
- Last week
-

Is there anyone has that one affordable indicator
⭐ topstep replied to traderno's topic in Ninja Trader 8
Is there any one who has Affordable Indicators pdf file for instructions ?