⤴️-Paid Ad- Check advertising disclaimer here. Add your banner here.🔥
All Activity
- Past hour
-
 Gretta reacted to a post in a topic:
codentrade.com
Gretta reacted to a post in a topic:
codentrade.com
-
⭐ goldeneagle1 reacted to a post in a topic:
RObos specialist in MGC, needs to educate
-
⭐ goldeneagle1 reacted to a post in a topic:
FlowMatrix
-
⭐ goldeneagle1 reacted to a post in a topic:
codentrade.com
-
⭐ goldeneagle1 reacted to a post in a topic:
KimSam NT8 GEX Calc
-
babeonidi reacted to a post in a topic:
Metastock 20 realtime c*****d
- Today
-
⭐ goldeneagle1 reacted to a post in a topic:
https://www.tradersally.com/products need to educate ( trade journal , trendmagic system....)
-
⭐ goldeneagle1 reacted to a post in a topic:
Leavitt Autotrader -
-
⭐ goldeneagle1 reacted to a post in a topic:
Leavitt Autotrader -
-
kimsam reacted to a post in a topic:
Leavitt Autotrader -
-
https://ibb.co/Y7qG2vzP https://ibb.co/3mn8vj7k
-
https://workupload.com/file/HZAkFnjHLqw
-
Yes, I do like it. The only thing I would do is to actually copy its other strats specifically for the target/stoploss and trailing and then use that with the strategy I pick. I dont like its original one as I notice, when you are already way deep and huge profit, yet, the stop doesnt move. This, leaving the whole profit in potential danger. Its other strats that have other trailing stoplosses suit better as the trailing continues to moves to lock in and to protect my profits. Yes, I can move the stoploss manually but some of the strats, won't let you do this part manually. The stoploss would then move back to its original place after you moved it. Annoying.
-
This one is probably the most helpful one out there. Simple, straight to the point for most needs. Obviously there are other indicators that can do the job but yes, I like this one the most.
-
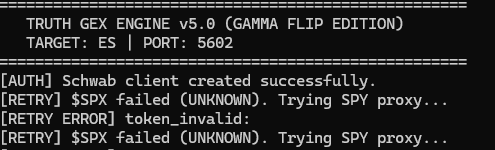
I think for ES you just have to have blank in connect symbol and it will auto convert levels from $SPX. You chart on which you load should be ES chart. I think this is how I got it working. also make sure the flag for offset is checked
-
it is work. thanx mate!
-
gotV1.1 running earlier got values but now shows error , also looking forward to the latest iteration, compliments to all contributors. Thanks

-
OK, try the previous version that was fixed by @apmoo in the first post above. BTW, The developer states that He has changed the licensing to the new Ninjatrader process, that may be causing your problem. I am running edu NT8.5.1.2, and the 14 day trial is expiring.
-
I did. Thats where I got it from.
-
@ScoobyDoo Try downloading directly from theie website, does not require login/purchase or any information from you.
-
I imported the trial but it kept crashing NT so I removed it.
-
For those that are discretionary traders or BOT traders in semi-auto mode, perhaps this indicator can add context to the trade you are considering. Mark Douglas in his book "Trading In The Zone" mentions : "Mindset first: Treat each trade as a probabilistic event with no guaranteed outcome; focus on executing a plan consistently rather than "trying to be right." This indicator helps in finding probabilities. https://workupload.com/file/XRY7HHH5RPp
-
 jordison joined the community
 -

Does anyone have the Anchored Volume Profile indicator?
fxtrader99 replied to Jack's topic in Ninja Trader 8
Here you go. AdvancedVolumeProfile.zip -
@apmoo This is an updated version which is a 14 day trial. As time allows, would you take a crack at this. 🙏 https://workupload.com/file/243pCTSRU4v CodeNtrade.net
-
 Yes, I agree with you, but in reality, local regulations often present difficulties for users, while foreign regulations seem easier and more promising. Beyond that, I recommend working with a broker you know both institutionally and through their work.
 -

Market Technical Analysis by RoboForex
RBFX Support replied to RBFX Support's topic in Technical Analysis
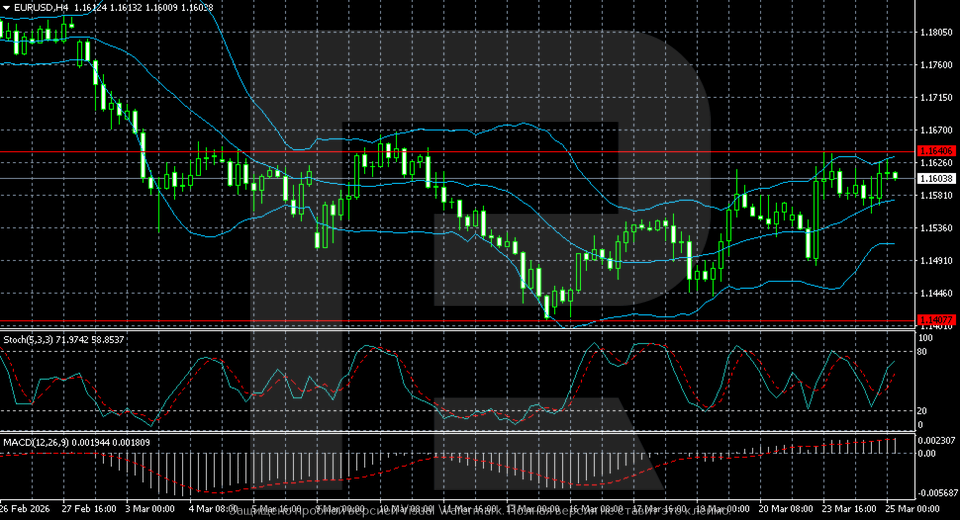
EURUSD may edge higher: fears about US prices have eased The EURUSD pair rose to 1.1603. A local reduction in tensions in the Middle East is encouraging the market. More details are in our analysis for 25 March 2026. Technical outlook The H4 chart for EURUSD shows that after declining at the beginning of March, the market formed a local bottom around 1.1400, from which a recovery began. Before that, the pair had been consistently posting lower highs and lower lows, which pointed to sustained downward momentum. The EURUSD pair is rising in a limited way within the accumulation phase. Read more - EURUSD Forecast Attention! Forecasts presented in this section only reflect the author’s private opinion and should not be considered as guidance for trading. RoboForex bears no responsibility for trading results based on trading recommendations described in these analytical reviews. Sincerely, The RoboForex Team
-
roboforex Market Fundamental Analysis by RoboForex
RBFX Support replied to RBFX Support's topic in Fundamental Analysis
USDJPY is testing 160.00: can BoJ statements withstand the dollar’s rise After the publication of the BoJ meeting minutes, the yen continues to lose ground, with quotes testing the 159.00 mark. More details are in our analysis for 25 March 2026. USDJPY forecast: key takeaways The minutes of the Bank of Japan’s January meeting have been published The oil shock is choking Japan’s economy USDJPY forecast for 25 March 2026: 160.00 Fundamental analysis The forecast for 25 March 2026 looks positive for the USD, as the USDJPY pair is forming an upward wave after a correction and may continue to rise. At the moment, quotes are trading around the 159.00 mark. This morning, the minutes of the Bank of Japan’s January meeting were published, and they turned out to be far more hawkish than the market had expected. The document is literally filled with the regulator’s determination to tighten monetary policy. RoboForex Market Analysis & Forex Forecasts Attention! Forecasts presented in this section only reflect the author’s private opinion and should not be considered as guidance for trading. RoboForex bears no responsibility for trading results based on trading recommendations described in these analytical reviews. Sincerely, The RoboForex Team -

HFMarkets (hfm.com): Market analysis services.
AllForexnews replied to AllForexnews's topic in Fundamental Analysis
Date: 25th March 2026. Middle East De-Escalation Hopes Push Stocks Higher as Oil Prices Fall. Markets Shift as Diplomacy Eases Immediate Fears Global markets are showing signs of relief as diplomatic efforts between the United States and Iran begin to gain traction. After weeks of heightened volatility driven by geopolitical tensions, investors are starting to price in the possibility of a near-term de-escalation. Equity markets have moved higher, while oil prices have retreated from recent highs, reflecting a shift in sentiment from fear-driven positioning toward cautious optimism. However, beneath the surface, the situation remains far from resolved. Oil Prices Fall as Risk Premium Is Reduced Crude oil has been at the centre of recent market volatility, acting as the primary barometer of geopolitical risk. As reports emerged of a proposed 15-point plan aimed at ending the conflict, alongside discussions of a potential temporary ceasefire, traders began unwinding positions that had priced in prolonged disruption. Brent crude fell toward the $97 level, while West Texas Intermediate traded near $89 per barrel. This move reflects a partial removal of the geopolitical risk premium that had built up during the escalation phase. However, the decline should not be interpreted as a full normalisation of market conditions. The Strait of Hormuz Remains the Key Variable Despite the pullback in oil prices, a critical risk factor remains unresolved: the Strait of Hormuz. This strategic waterway is responsible for a significant share of global oil and gas flows, and current restrictions on tanker movement continue to disrupt supply chains. Even partial limitations can have an outsized impact on pricing, particularly in a market already sensitive to geopolitical developments. For traders, the status of the strait is arguably more important than diplomatic headlines. A confirmed reopening would reinforce the current risk-on sentiment, while further restrictions could quickly reverse recent price declines. Equities Gain as Inflation Concerns Ease Equity markets have responded positively to the drop in oil prices, with futures linked to the S&P 500 moving higher. Lower energy costs help ease inflationary pressures, which in turn can reduce expectations for further monetary tightening. This dynamic has supported a broader risk-on environment, with investors rotating back into equities as worst-case scenarios appear less likely in the short term. However, the sustainability of this move depends heavily on whether diplomatic progress translates into tangible outcomes. Geopolitical Landscape Remains Fragile While market sentiment has improved, developments on the ground suggest that risks remain elevated. Military activity between Iran and Israel continues, and Tehran has shown limited willingness to engage in direct ceasefire negotiations. At the same time, Iran has renewed calls for a regional security alliance excluding the United States and Israel. This proposal highlights a broader strategic shift toward regional realignment and underscores the challenges of achieving a coordinated de-escalation. Such dynamics point to a more fragmented geopolitical environment, which could sustain volatility in global markets over the medium term. A Headline-Driven Environment for Traders The current market environment is highly reactive, with price action driven largely by headlines rather than confirmed developments. Oil, in particular, has become a real-time gauge of geopolitical sentiment, while equities are responding to shifts in inflation expectations and risk appetite. For traders and investors, this creates both opportunities and risks. Short-term moves may be sharp and unpredictable, requiring disciplined risk management and a focus on key catalysts, including: Updates on diplomatic negotiations Developments in the Strait of Hormuz Escalation or de-escalation in military activity Conclusion: Optimism Builds, but Risks Persist Markets are currently pricing in the possibility of de-escalation, leading to a rally in equities and a pullback in oil prices. However, the underlying risks have not disappeared. The path forward will depend on whether diplomatic efforts translate into concrete actions, particularly regarding the reopening of critical energy routes and a reduction in military tensions. Until then, volatility is likely to remain a defining feature of the market landscape. Always trade with strict risk management. Your capital is the single most important aspect of your trading business. Please note that times displayed based on local time zone and are from time of writing this report. Click HERE to access the full HFM Economic calendar. Want to learn to trade and analyse the markets? Join our webinars and get analysis and trading ideas combined with better understanding of how markets work. Click HERE to register for FREE! Click HERE to READ more Market news. Andria Pichidi HFMarkets Disclaimer: This material is provided as a general marketing communication for information purposes only and does not constitute an independent investment research. Nothing in this communication contains, or should be considered as containing, an investment advice or an investment recommendation or a solicitation for the purpose of buying or selling of any financial instrument. All information provided is gathered from reputable sources and any information containing an indication of past performance is not a guarantee or reliable indicator of future performance. Users acknowledge that any investment in Leveraged Products is characterized by a certain degree of uncertainty and that any investment of this nature involves a high level of risk for which the users are solely responsible and liable. We assume no liability for any loss arising from any investment made based on the information provided in this communication. This communication must not be reproduced or further distributed without our prior written permission. -

Does anyone have the Anchored Volume Profile indicator?
Wannabetrader replied to Jack's topic in Ninja Trader 8
can you upload the files please -

Indicators to trade like Fabio Valentini ,Carmine Rosato ,etc.
pygmalion5000 replied to ⭐ kapitansb's topic in Ninja Trader 8
it is actually a rebrand of volumetrica, another italian software company. -
Does anyone have the Anchored Volume Profile indicator?
pygmalion5000 replied to Jack's topic in Ninja Trader 8
https://nexusfi.com/local_links.php?action=ratelink&catid=27&linkid=2720 has several modes -
@Ninja_On_The_Roof @misalto @N9T Please evaluate. Request you to Review and Improvise. Regards!!
-
@apmoo @kimsam @apmoo Please evaluate. Request you to Review and Improvise. Regards!!