⤴️-Paid Ad- Check advertising disclaimer here. Add your banner here.🔥
All Activity
- Past hour
-
It's more or less the same. For beginners – TMA isn’t a holy grail. It works well in sideways markets, but repaints in strong trends. So it’s safer to take signals with the trend. It’s pretty good at spotting the end of pullbacks.
- Today
-

HFMarkets (hfm.com): Market analysis services.
AllForexnews replied to AllForexnews's topic in Fundamental Analysis
Date: 12th March 2026. Oil Tankers Hit: Iran Increases Its Retaliation Attacks Pushing Oil Higher! Thursday is set for a risk-off sentiment as two oil tankers were hit close to the Strait of Hormuz. In response to the attack, surrounding nations also took protective measures, further reducing risk appetite. Iraq, which is a member of OPEC and the sixth-largest exporter of oil, shut down most of the country’s oil terminals. Members of the Iraqi government announced that they have suspended most operations temporarily. Oman, also ordered all ships to leave its port as a precautionary measure. The market is currently playing tug-of-war as to whether the conflict will end soon or if Iran increases its retaliatory attacks and prolongs the war. If Iran intensifies its retaliatory attacks, the US may find it difficult to de-escalate the conflict without suffering reputational damage. Currently, investors remain pessimistic, causing oil to trade higher, the stock market to dip and safe-haven assets to rise. Crude Oil - Two Tankers Attacked By Iran Sending Oil Close to $100 Per Barrel! HFM - Crude Oil 15-Minute Chart The US and other major oil producers are attempting to ensure supply shocks remain at a minimum. The IEA has taken the decision to release 400 million barrels of oil in order to support supply to the market. The move does put pressure on prices, but only to a small extent, particularly if the conflict continues in the long term. According to oil analysts, 400 million barrels is a significant figure, but the flow rate to the market is a maximum of 2 million barrels per day. Therefore, it would take a minimum of 200 days for the IEA to ensure the reserves reach the market. For this reason, the move puts pressure on prices but to a smaller extent due to rising tensions. Oil prices opened with a bullish price gap measuring 2.85% and continued to rise to above $96. However, the price is now correcting and falling back to the day’s open price. However, even the open price of $90 per barrel remains elevated. On a two-hour timeframe the price remains above most moving averages indicating the bullish bias remains. However, up and down spikes remain frequent. On smaller timeframes such as the five-minute chart, the price of oil is showing strong bearish momentum, but the price is now at the 200-bar SMA. The 200-bar SMA can act as a support level which technical analysts will be following closely. If the price remains above $89, the short term bullish bias may remain, particularly if Iran continues to attack oil supply chains. Gold - Gold Rises Despite Dollar Pressures The price of Gold fell in the early hours of the Asian session as traders reacted to an expensive Dollar. However, as the need for safe-haven assets became apparent, the price of Gold rose. The US inflation release on Tuesday afternoon was modestly positive, as inflation remained relatively stable and low. However, this data predates the recent surge in oil prices, which have since risen to a four-year high. The US inflation rate remained at 2.4%. Silver and Palladium are also increasing in value indicating the price of Gold may remain high. The main concern for Gold buyers is the US Dollar which also rose this morning. For buy signals to remain valid for Gold, technical analysts will be looking for the US Dollar Index to remain below 99.00. NASDAQ - Stocks Temporarily Rise But Cannot Maintain Momentum Earlier this week, US President Donald Trump told viewers that the main phase of US operations in Iran may be coming to an end. He also said that most objectives have already been achieved. This initially improved market sentiment and increased traders’ appetite for risk assets such as stocks and higher-yield currencies. The NASDAQ rose for two consecutive days, particularly as investors wanted to take advantage of the lower entry levels. However, escalations again rise, the stock market has come under pressure. HFM - NASDAQ 30-Minute Chart Generally, the situation remains uncertain. Iranian authorities have reportedly rejected diplomatic talks and continue to maintain the blockade of the Strait of Hormuz, a key global oil shipping route. Due to this, analysts believe a quick resolution is unlikely. Some now warn that the conflict could last for several months. If disruptions to global energy supply continue, oil prices could remain elevated. This could increase inflation risks and potentially force central banks to keep interest rates higher for longer. If global central banks opt to increase interest rates and the conflict continues longer than previously projected, the stock market could fall by 13%, according to analysts. However, this is something traders will continue to monitor. Key Takeaways: Attacks near the Strait of Hormuz and precautionary measures by Iraq and Oman increased uncertainty and boosted safe-haven demand. Oil opened with a bullish gap and rose above $96 as markets feared disruptions to global energy supply. The IEA plans to release 400 million barrels, but limited daily supply means the process could take about 200 days. Gold initially fell due to a stronger US dollar but later rebounded as investors sought safe-haven assets. The NASDAQ briefly rose on de-escalation hopes, but renewed tensions and higher oil prices may pressure stocks. Always trade with strict risk management. Your capital is the single most important aspect of your trading business. Please note that times displayed based on local time zone and are from time of writing this report. Click HERE to access the full HFM Economic calendar. Want to learn to trade and analyse the markets? Join our webinars and get analysis and trading ideas combined with better understanding of how markets work. Click HERE to register for FREE! Click HERE to READ more Market news. Michalis Efthymiou HFMarkets Disclaimer: This material is provided as a general marketing communication for information purposes only and does not constitute an independent investment research. Nothing in this communication contains, or should be considered as containing, an investment advice or an investment recommendation or a solicitation for the purpose of buying or selling of any financial instrument. All information provided is gathered from reputable sources and any information containing an indication of past performance is not a guarantee or reliable indicator of future performance. Users acknowledge that any investment in Leveraged Products is characterized by a certain degree of uncertainty and that any investment of this nature involves a high level of risk for which the users are solely responsible and liable. We assume no liability for any loss arising from any investment made based on the information provided in this communication. This communication must not be reproduced or further distributed without our prior written permission. -
 hybrid76 reacted to a post in a topic:
dtb strategy indicator bar type needs to educate last version feb 2026 please
hybrid76 reacted to a post in a topic:
dtb strategy indicator bar type needs to educate last version feb 2026 please
-
hybrid76 reacted to a post in a topic:
dtb strategy indicator bar type needs to educate last version feb 2026 please
-

roboforex Market Fundamental Analysis by RoboForex
RBFX Support replied to RBFX Support's topic in Fundamental Analysis
Geopolitical tensions push Brent towards new price records Geopolitics remains the main driver of oil price gains, with Brent quotes currently standing at 93.70 USD. Discover more in our analysis for 12 March 2026. Brent forecast: key takeaways The Strait of Hormuz remains effectively closed The IEA’s record release of strategic reserves proved largely ineffective Brent prices may continue to rise towards 100.00–110.00 USD per barrel Fundamental analysis Brent fundamental analysis for today, 12 March 2026, takes into account that prices are correcting within an overall uptrend, trading around 93.70 USD per barrel. The Brent outlook for 12 March 2026 also factors in that Brent crude remains in the eye of the storm triggered by the escalation of the conflict in the Middle East. The disruption of key strategic shipping routes poses a serious threat to the oil market and is one of the triggers behind the Brent rally. RoboForex Market Analysis & Forex Forecasts Attention! Forecasts presented in this section only reflect the author’s private opinion and should not be considered as guidance for trading. RoboForex bears no responsibility for trading results based on trading recommendations described in these analytical reviews. Sincerely, The RoboForex Team -
Market Technical Analysis by RoboForex
RBFX Support replied to RBFX Support's topic in Technical Analysis
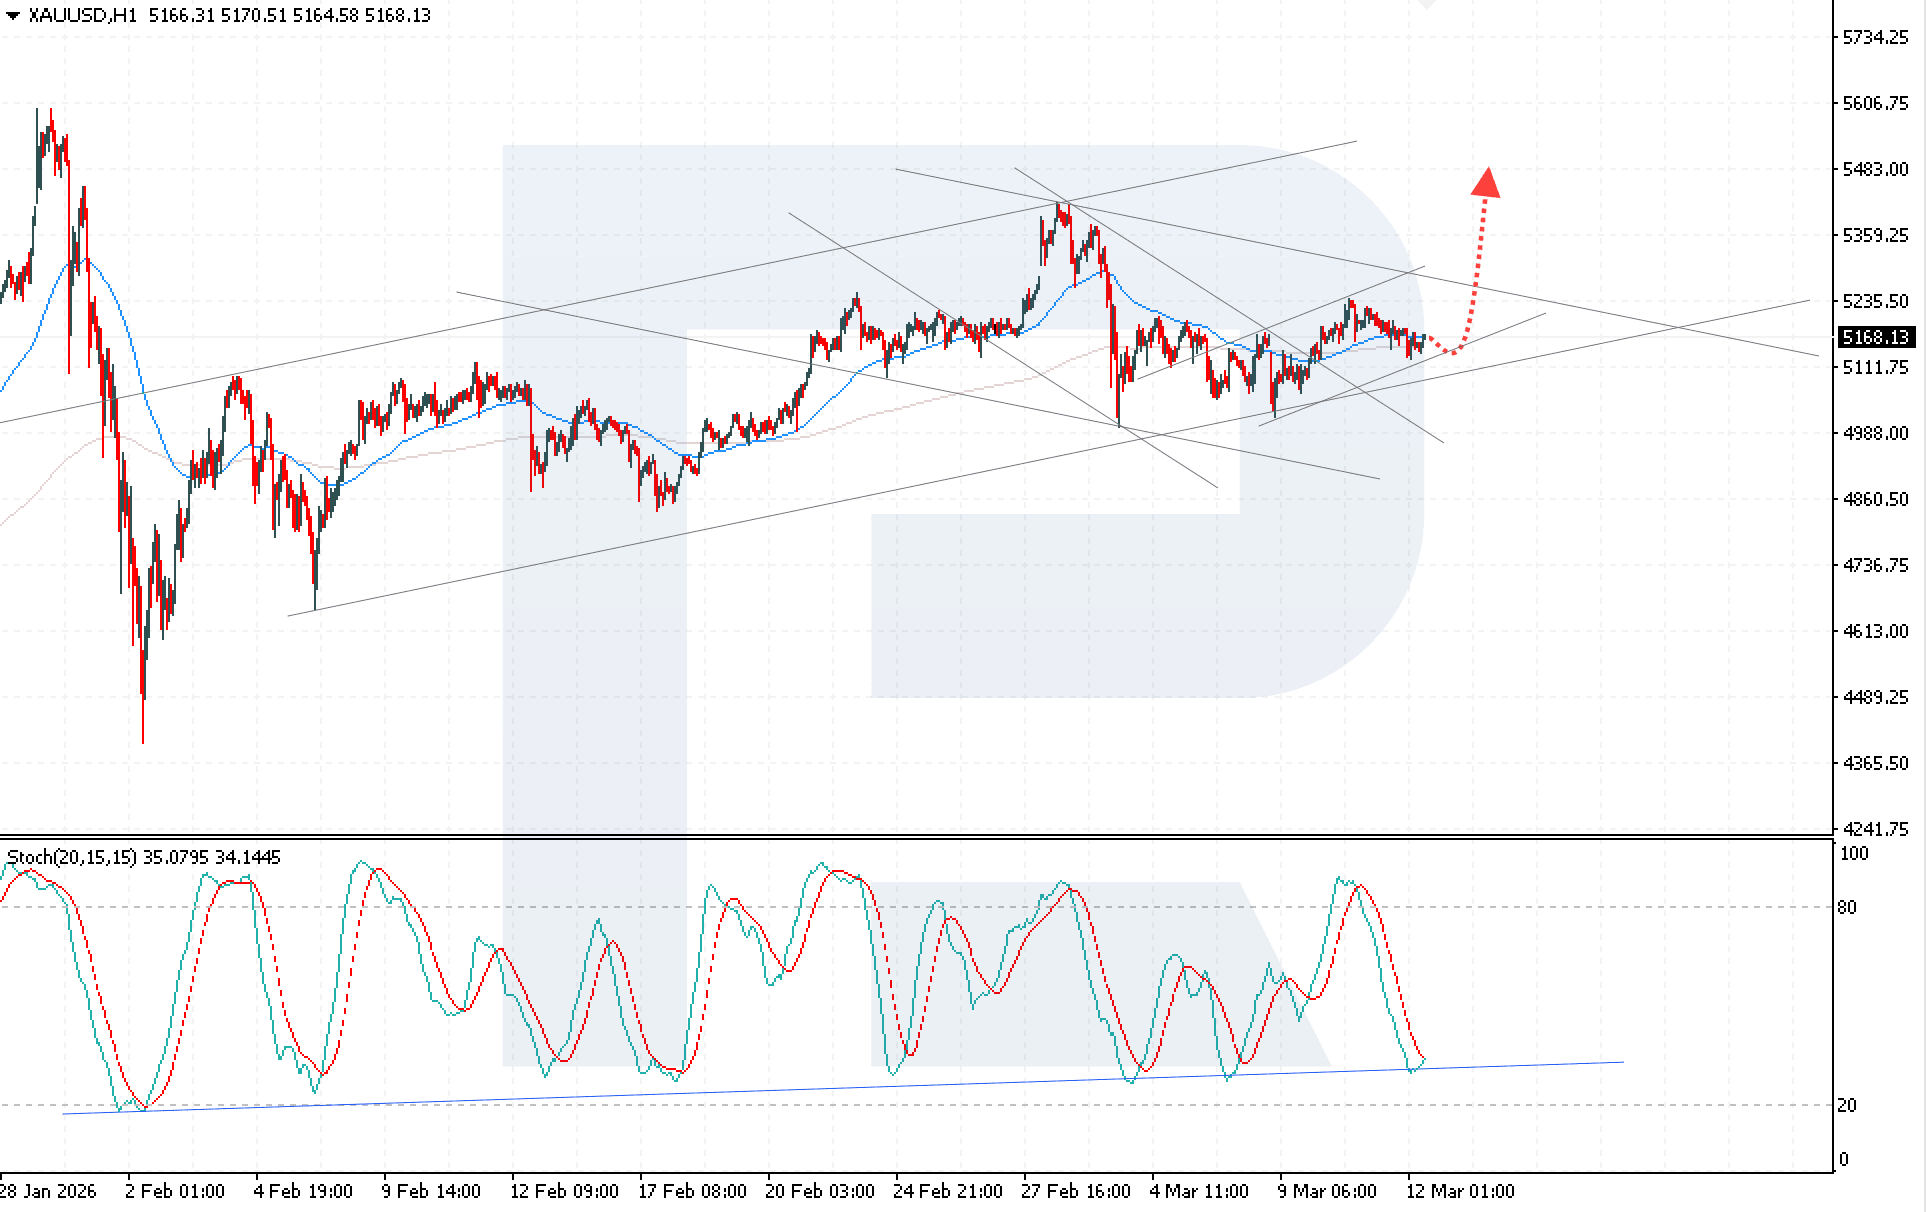
XAUUSD remains under pressure after the release of US inflation data XAUUSD is trading cautiously as investors assess inflation risks and the outlook for US monetary policy, with prices currently at 5,168 USD. Find out more in our analysis for 12 March 2026. Technical outlook XAUUSD quotes are undergoing a correction within an ascending channel. Buyers are holding the 5,115 USD support level, which maintains bullish pressure and limits a deeper bearish correction. Today’s XAUUSD forecast suggests an attempt to recover and form new momentum towards 5,485 USD. The combination of persistent inflation and a stronger US dollar is increasing pressure on XAUUSD, limiting gold’s upside in the near term. Read more - Gold Forecast Attention! Forecasts presented in this section only reflect the author’s private opinion and should not be considered as guidance for trading. RoboForex bears no responsibility for trading results based on trading recommendations described in these analytical reviews. Sincerely, The RoboForex Team
-
Minerva reacted to a post in a topic:
Timingsolution & Nifty Updates - 3
-
yangsey reacted to a post in a topic:
fixed .. ORS Fusion and Axios
-
yangsey reacted to a post in a topic:
fixed .. ORS Fusion and Axios
-

Khit Wong The C.O.R. MASTERCLASS
george09 replied to george09's topic in Forex Clips & Movie Request
yeah m awaiting any reviews of the course before i buy this. as i never got from that website myself so group buy would be awesome but ofcourse not needed. But if its any good will get that. -
Bill A reacted to a post in a topic:
fixed .. ORS Fusion and Axios
-
Ninja_On_The_Roof reacted to a post in a topic:
fixed .. ORS Fusion and Axios
-
Ninja_On_The_Roof reacted to a post in a topic:
fixed .. ORS Fusion and Axios
-
Ninja_On_The_Roof reacted to a post in a topic:
fixed .. ORS Fusion and Axios
-
Ninja_On_The_Roof reacted to a post in a topic:
fixed .. ORS Fusion and Axios
-
Well done!Keep us updated!Mind to share the prop acc size you’re using this strategy?👏🏻
-
You are correct, he is trying to squeeze every penny.
-
I am also 1k away from being funded with your template. I just use 6 micros position 1 one and 1 micro position 2. Thank you very much.
-
bump
-
Amazing! Do you know the name of the other indicators used? I know we can set several moving averages, but I thing there’s something called súper trend, I guess it is the one that switches color and position to indicate trend position
-
I shared mine, I was the first one, if you load the template, everything is inside, I used 7 MNQ contracts like the owner’s one, it’s a little aggressive so I recommended to downsize to be safe and I passed the evaluation in 6 days
-
Opt v 2.2 https://www.4shared.com/s/foLTlSpoMge Opt v 1.6 https://www.4shared.com/s/fg4Gi61Dnge Download both versions. Pass is : 123 First, read install notes as detailed in v 2.2. (Install notes are in text, pic & or pdf files.) Then also read install notes from v 1.6. If you read 2 to 3 times, spend time & understand what you are supposed to do & then install you will have no issues. All the best Regards K
-
await its sharing
-
hi bro, please give me user and password for login optumua 2.2
-
You cant directly install the latest update only! Start reading the thread from beginning to end. 1st you install TSA and then any TS update. Then their respective cr@acked file/patch and run them.
-
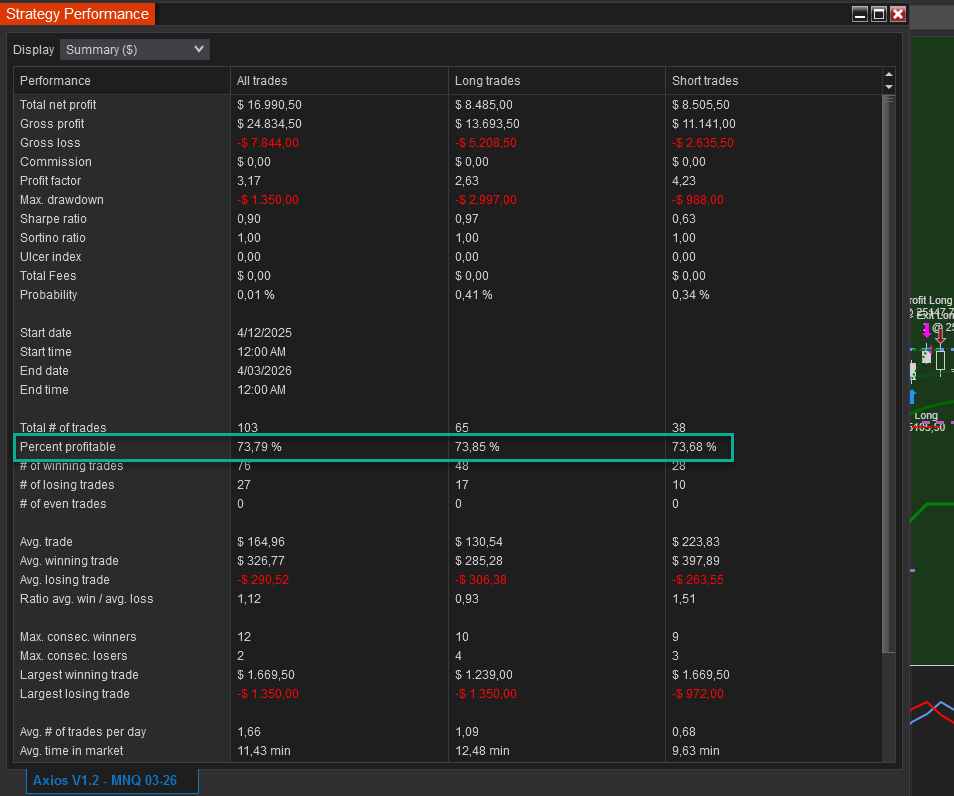
There are two templates posted. Mind sharing which one you used, number of contracts, etc? Did you pass in one day, minis, micros? A screenshot tells us nothing.
-
3 full minis? On a 50K account? Or micros?
-
Here! TDUTMABandsScalper.zip
-
In the page 1 and 2 we have shared some templates that are very close to what they have. You can work on them to improve it
-
What's the difference between this band and ninza's?
-
Because traders get to KISS the Orderflow😂
-
@Minigems please
- Yesterday
-
yeah let us know how it goes…hopefully the strategy will be in the green,and stays there.
-
https://workupload.com/archive/9dxLkHxL7E @Minigems @kimsam @apmoo