⤴️-Paid Ad- Check advertising disclaimer here. Add your banner here.🔥
All Activity
- Today
-
 babeonidi reacted to a post in a topic:
AFLWiz.exe for Amibroker registration.
babeonidi reacted to a post in a topic:
AFLWiz.exe for Amibroker registration.
-
kimsam reacted to a post in a topic:
Introducing BARFI
-
you can evaluate decisions by Qwen-3 here. https://t.me/passion_trades (Don't go by timing mentioned in message, just follow time of message)
-
-
Introducing BARFI: My Fully Automated, Multimodal AI Trading System for XAUUSD (Qwen 2.5/3 + Gemini 3.1 + NT8/MT5) Hey everyone, I wanted to share a project I've been building and backtesting over the last few months. It's now fully automated from market analysis to trade execution. I call it BARFI (Bullion Analytics Research & Forecasting Intelligence). The core goal of BARFI is to solve a massive problem in algorithmic trading: combining raw data (OHLCV) with visual context (Footprint/Order Flow charts) to understand market regimes. Here is exactly how the architecture works, from ingestion to execution. 1. The Data Foundation & Local FineTuning Before automating live data, I built a heavy training dataset to teach a local Small Language Model (SLM) what specific market regimes look like: The Dataset: 1,000+ intraday 5-minute order flow footprint charts and over 1 million rows of historical OHLCV data in CSV format. The Local Brain: I used this data to train/finetune an open source Qwen 2.5 model. Its sole job is pattern matching n recognizing current market regimes by matching live setups against my historical database. 2. The Hourly Ingestion Pipeline Every hour, on the hour, a dual platform bridge triggers: NinjaTrader 8 (NT8): Automatically takes and saves a screenshot of the live 5-minute footprint/order flow chart. MetaTrader 5 (MT5): Automatically exports the last 500 rows of 5min OHLCV data. 3. Layer 1: Local Screening (The SLM) Instead of throwing raw data blindly at an expensive cloud API, BARFI uses the local finetuned Qwen 2.5 model first. The local SLM ingests the new hourly data. It scans the historical database to find the 5 most mathematically and visually matched historical scenarios. It compiles these 5 scenarios into an initial structured analysis report. 4. Layer 2: Deep Reasoning (Qwen 3-Max-Thinking) Once the local report is ready, BARFI calls the Qwen 3-Max-Thinking API. This layer handles the heavy cognitive lifting. Inputs sent: The live 5-minute footprint screenshot + the 500 rows of OHLCV data + the local SLM’s 5 scenario matching report. The Output: Qwen 3-Max conducts an in-depth reasoning analysis, predicts the trend for the upcoming 1 hour, and establishes exact, decisive price levels (Support, Resistance, Invalidation). 5. Layer 3: Agentic Execution & Management (Gemini 3.1 Flash Lite) Once Qwen 3-Max outputs the trend and levels, an agentic AI workflow takes over utilizing Gemini 3.1 Flash Lite for fast, low-latency execution: Broadcast: It formats the trend and levels and instantly sends a broadcast to a private Telegram channel via API. Execution: It parses the decisive levels, calculates risk management metrics (position sizing, risk/reward ratio), and triggers a live trade directly into MT5. Trade Management: Gemini doesn't just "fire and forget." The agent stays active, watching the trade in real-time on MT5 until either the Target Profit or Stop Loss is met. Why This Hybrid Approach Works What I love most about this setup is the efficiency vs. capability balance. Running everything through a massive thinking model every hour is slow and expensive. By utilizing a highly specialized, locally trained model to do the initial "heavy lifting" filter, the cloud model only has to reason across highly curated, relevant data. So far, the multimodal approach (giving the AI both the visual footprint chart and the hard numbers of the OHLCV) has vastly outperformed my old numbers, only models, especially on XAUUSD where volume profile and order flow shifts dictate the intraday trend. Would love to hear your thoughts on this multi model architecture!
-
⭐ ajeet reacted to a post in a topic:
Reversal Predator Discord sharing
-
⭐ ajeet reacted to a post in a topic:
Reversal Predator Discord sharing
-
That’s a solid take. If you’re the kind of trader who likes to get hands on with order flow, ATAS really shines. The built-in footprint charts are sharp, and the default settings just work, plus the free tier is hard to pass up. But let’s be real,these platforms are built so differently when you look at where you want your trading to go in the long run. ATAS is basically a great visual toolkit. On the other hand, NinjaTrader 8 feels more like a playground for developers. Since NT8 hooks right into C# and the .NET library, you can create automated workflows and analysis tools that ATAS just isn’t built to handle. With NT8, you’re not stuck drawing indicators and staring at charts. You can actually write custom scripts to do things like connect your trading setup to Python or AI models, snag chart data automatically, crunch numbers behind the scenes, and feed those results back into your trading system, Or throw together multilayered trading bots that hunt for opportunities across tons of instruments at the same time,all running your own logic. So, yeah,ATAS works wonders if you want to act fast and make manual decisions. But if you’re aiming to scale up and automate, or tap into the latest AI analysis, NT8’s open-source flexibility is a game changer. Good luck on the switch. In the end, it’s just about finding the right tool for how you like to trade.
-
https://limewire.com/d/CXFfQ#YxVHSIUuRN
-
⭐ QuBit reacted to a post in a topic:
Hedge Fund Trender
-
⭐ QuBit reacted to a post in a topic:
tradingstrategyguides.com
-
⭐ goldeneagle1 reacted to a post in a topic:
neoharmonics toolkit
-
pygmalion5000 reacted to a post in a topic:
timekeepertrading.de
-
Pip value depends heavily on your lot size. A 10-pip move can be $1 or $100. That is why risk management is connected to pips.
-
True, doing own research is always important. However, HFM is a safe choice for beginners. The spread is quite low on major currency pairs. You should try a demo account first.
-
mr banker can you please crack the 32bit version? i need it for adding extra planets like uranian astrology
-

Market Technical Analysis by RoboForex
RBFX Support replied to RBFX Support's topic in Technical Analysis
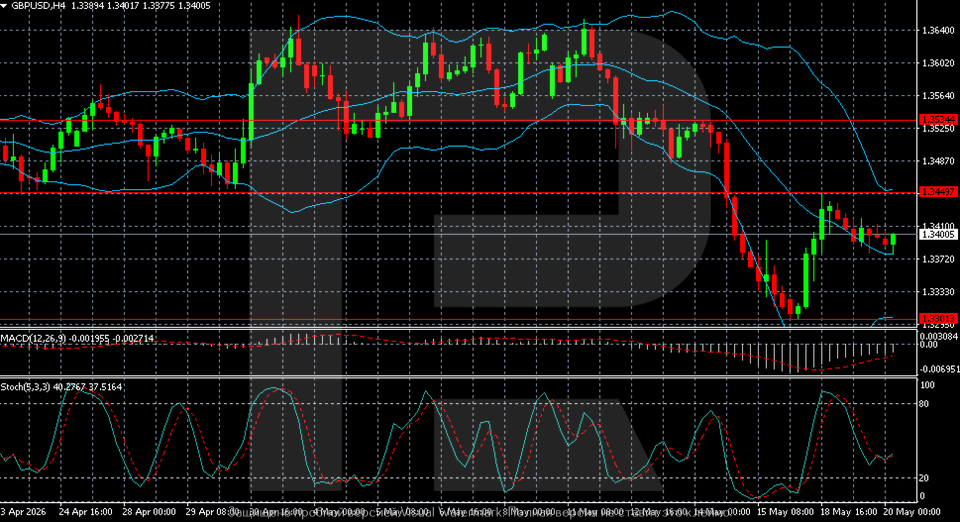
GBPUSD is in a difficult position: too many pressure factors The GBPUSD pair fell to 1.3400 and then stalled. The political crisis in the UK is unlikely to end quickly. Find out more in our analysis for 20 May 2026. Technical outlook On the H4 chart, the GBPUSD pair remains under pressure after a confident decline from the May highs near 1.3640. After a series of failed attempts to consolidate above 1.3600, the market moved into a deeper correction. The GBPUSD pair fell and has now paused. Read more - GBPUSD Forecast Attention! Forecasts presented in this section only reflect the author’s private opinion and should not be considered as guidance for trading. RoboForex bears no responsibility for trading results based on trading recommendations described in these analytical reviews. Sincerely, The RoboForex Team
-
roboforex Market Fundamental Analysis by RoboForex
RBFX Support replied to RBFX Support's topic in Fundamental Analysis
US 30 index forecast: the index has moved very close to its all-time high The US 30 index approached its all-time high and entered a correction; the trend is highly unstable. The US 30 forecast for today is positive. US 30 forecast: key takeaways Recent data: US CPI for April came in at 3.8% year-on-year Market impact: the data is positive for the stock market Fundamental analysis The acceleration of US annual inflation to 3.8% versus the forecast of 3.7% and the previous 3.3% is a negative macroeconomic signal for the market. Higher inflation increases concerns that price pressures will remain elevated longer than expected, meaning the Federal Reserve may keep interest rates higher for longer. For the US 30 index, this news may have a moderately negative impact. The index includes large industrial, financial, consumer, and technology companies that are sensitive to changes in interest rates and expectations for economic growth. RoboForex Market Analysis & Forex Forecasts Attention! Forecasts presented in this section only reflect the author’s private opinion and should not be considered as guidance for trading. RoboForex bears no responsibility for trading results based on trading recommendations described in these analytical reviews. Sincerely, The RoboForex Team -
 ⭐ Azazel reacted to a post in a topic:
Old Tradestation share
⭐ Azazel reacted to a post in a topic:
Old Tradestation share
-
Sorry Bro can i have repload please?
-
thank you - does anyone have millabotpro pls?
- Yesterday
-
Bro. Can you please share the resource and indicator files.
-
Thank u both.🤛
-
 @trader88 kindly post deep stack confluence edu with resource file please
 -
roboforex Market Fundamental Analysis by RoboForex
RBFX Support replied to RBFX Support's topic in Fundamental Analysis
US 500 forecast: the index has started a correction After reaching a new all-time high, the US 500 index has started a correction, which may develop into a downtrend. The US 500 forecast for today is negative. US 500 forecast: key takeaways Recent data: US CPI rose to 3.8% year-on-year in April Market impact: the data has a moderately negative effect on the US stock market Fundamental analysis The increase in US annual inflation to 3.8%, above the forecast of 3.7% and the previous 3.3%, may have a moderately negative impact on the US 500 index. The data shows that inflationary pressures in the US economy are strengthening faster than expected, reducing the likelihood of imminent monetary easing by the Federal Reserve. For the US stock market overall, this news is a restraining factor. Higher inflation reduces consumers’ real purchasing power, increases companies’ costs, and worsens expectations for future profits. RoboForex Market Analysis & Forex Forecasts Attention! Forecasts presented in this section only reflect the author’s private opinion and should not be considered as guidance for trading. RoboForex bears no responsibility for trading results based on trading recommendations described in these analytical reviews. Sincerely, The RoboForex Team -
Market Technical Analysis by RoboForex
RBFX Support replied to RBFX Support's topic in Technical Analysis
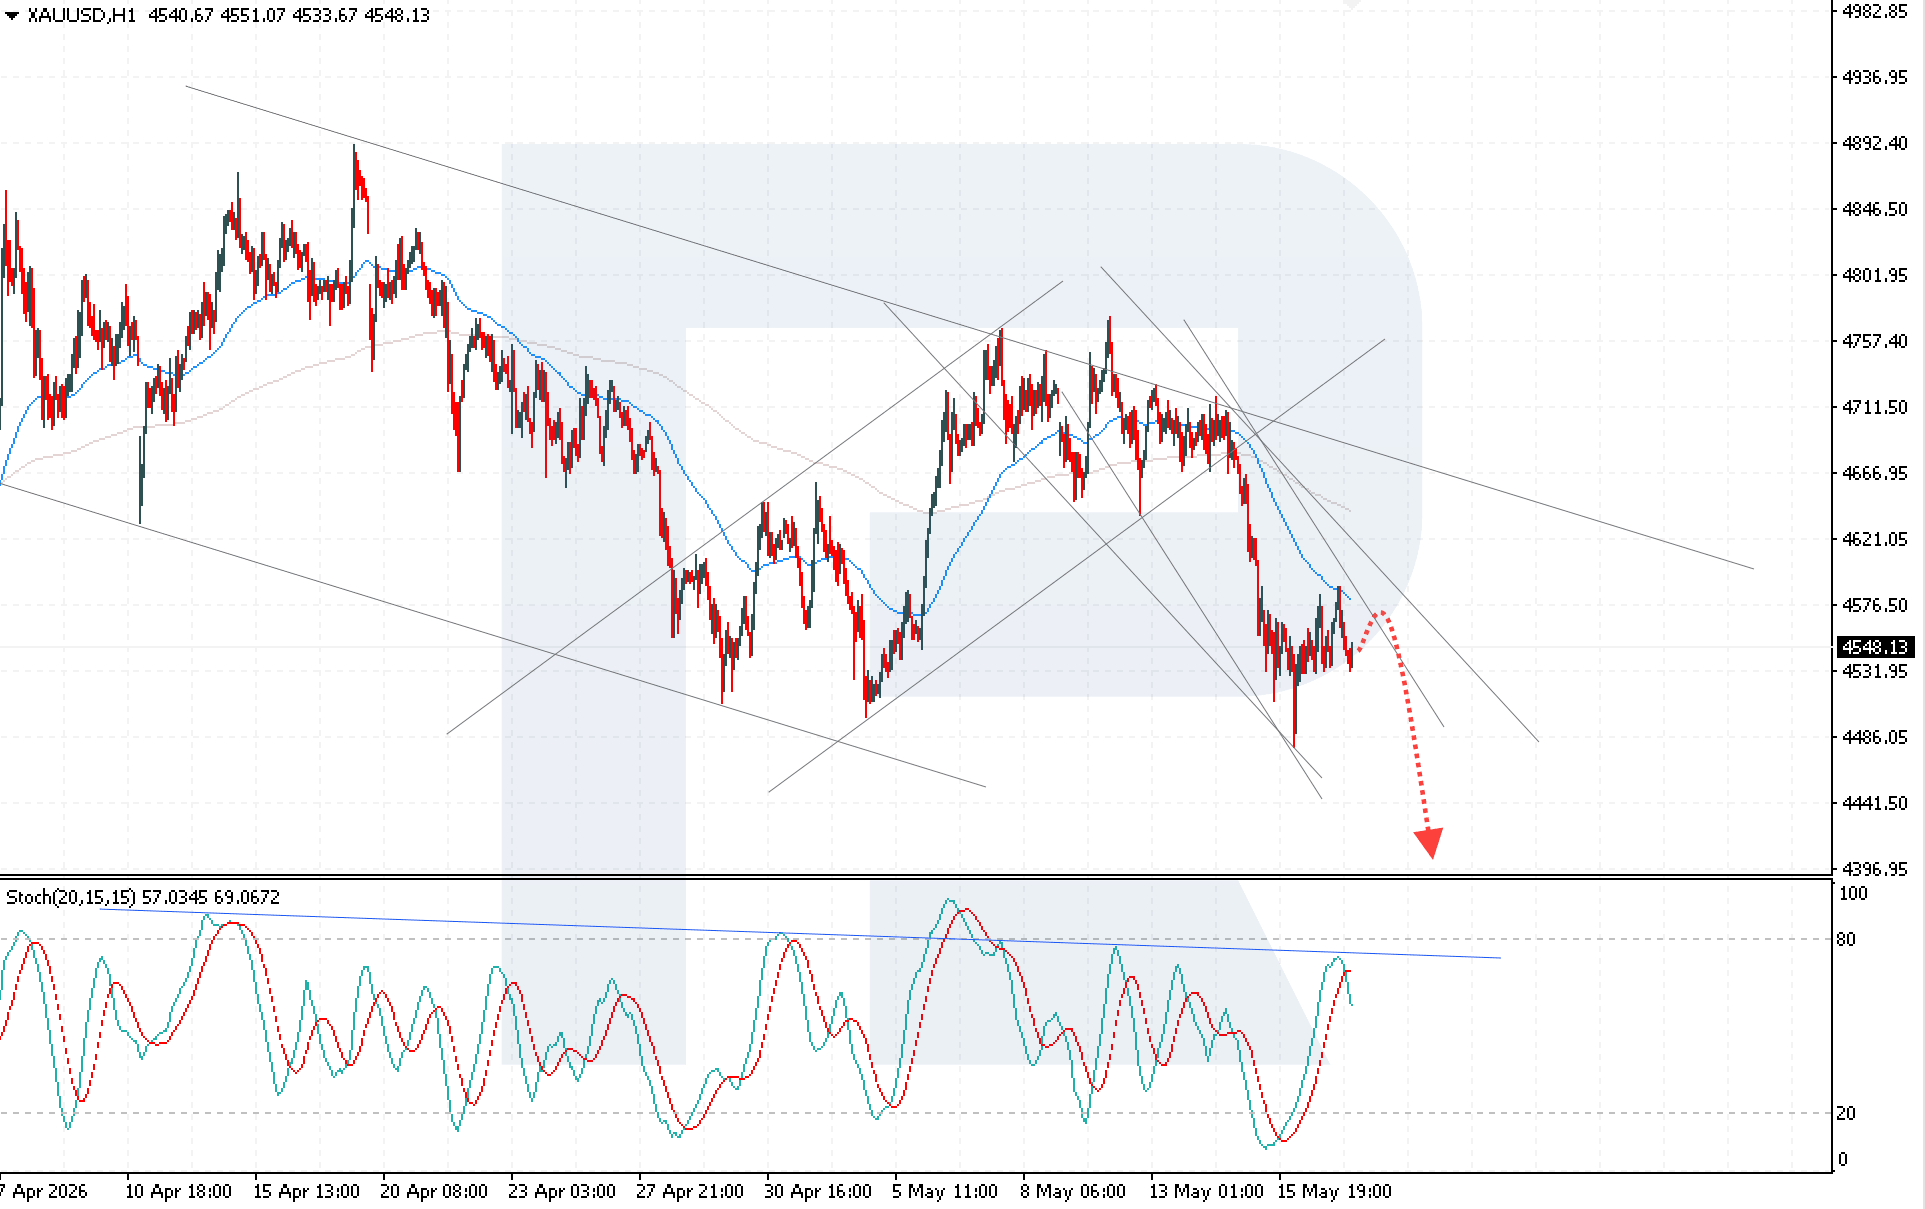
XAUUSD is correcting after rebounding from the 4,505 USD support level XAUUSD quotes are falling amid the escalating conflict in the Middle East, rising oil prices, and increased inflation risks. Quotes currently stand at 4,548 USD. Discover more in our analysis for 19 May 2026. Technical outlook XAUUSD quotes are declining after rebounding from the EMA-65, indicating continued downward momentum and control by the bears. The XAUUSD forecast for today suggests a minor bullish correction and a continued decline towards 4,395 USD. XAUUSD quotes remain highly sensitive to developments in the Middle East conflict, oil price movements, and expectations of further actions by the world’s central banks. Read more - Gold Forecast Attention! Forecasts presented in this section only reflect the author’s private opinion and should not be considered as guidance for trading. RoboForex bears no responsibility for trading results based on trading recommendations described in these analytical reviews. Sincerely, The RoboForex Team
-
dantonshockwave-nopassword.rar no password
-
 some more garbage: https://ibb.co/hJfMFKWT
 -
@trader88 could you kindly share the files the resource files and indicator files that you got it to work,I think it works like the old multi timeframe fusion ninza indicator
-
Need to figure out how to use this thing: https://ibb.co/5gCdQHWg
-

HFMarkets (hfm.com): Market analysis services.
AllForexnews replied to AllForexnews's topic in Fundamental Analysis
Date: 19th May 2026. Markets on Edge: Rising Yields, Oil Volatility, and AI Stocks Under Pressure. Global markets are entering the new trading day with investors facing a difficult mix of geopolitical uncertainty, surging bond yields, and renewed pressure on high-growth technology shares. After months of AI-driven optimism pushing equities to record highs, markets are now confronting the reality of elevated inflation risks and the possibility of interest rates staying higher for longer. Asian Markets Slide as Tech Stocks Lead Losses Asian equities traded mostly lower during Tuesday’s session, with technology shares once again under heavy pressure. South Korea’s KOSPI dropped sharply as semiconductor giants came under renewed selling pressure, reflecting weakness seen overnight in US chipmakers. The broader MSCI Asia Pacific Index declined as investors rotated away from risk assets and toward safer positions amid growing uncertainty surrounding the Middle East conflict and global interest rates. Japanese equities also weakened despite stronger-than-expected GDP data. Although Japan’s economy expanded for a second consecutive quarter, investors largely ignored the positive economic figures and instead focused on rising global bond yields and energy-driven inflation risks. Meanwhile, Hong Kong markets managed modest gains, while Chinese equities remained under pressure as investor sentiment across the region deteriorated. Bond Yields Become the Market’s Main Concern One of the biggest themes dominating financial markets is the relentless rise in government bond yields. The yield on the US 30-year Treasury climbed above 5.1%, reaching its highest level since 2023, while Japan’s 30-year government bond yield surged to record highs not seen since the bond was first introduced in 1999. Markets are increasingly worried that elevated oil prices and resilient economic data could force central banks, especially the Federal Reserve, to maintain restrictive monetary policy for longer than investors had previously expected. Historically, rising Treasury yields have created significant headwinds for equities, particularly growth and technology stocks. Higher yields reduce the attractiveness of future earnings projections, which directly impacts richly valued AI and semiconductor companies that have led the recent rally. This concern is becoming increasingly visible in valuations. The Nasdaq 100 is currently trading above its long-term average forward earnings multiple, leaving the sector vulnerable to corrections if financing conditions tighten further. AI Rally Faces Its Biggest Test Yet The artificial intelligence boom has been the dominant driver of global equity performance throughout the year. However, the environment is becoming more challenging. Chipmakers and AI-related stocks came under renewed pressure after weakness in the Philadelphia Semiconductor Index extended into a second session. Investors are beginning to question whether current valuations can remain justified if borrowing costs continue climbing. Several major technology stories are also shaping market sentiment: NVIDIA Corporation remains in focus ahead of earnings, with investors watching closely for signs that AI demand remains strong. Seagate Technology suffered a sharp decline after management’s comments raised concerns about its ability to keep up with soaring memory demand. Standard Chartered announced plans to cut thousands of support roles as banks increasingly integrate artificial intelligence into operations. Google and Blackstone Inc are reportedly working on a new AI cloud venture designed to compete with existing infrastructure providers. The market’s current challenge is balancing long-term AI optimism against short-term macroeconomic risks. Oil Prices Remain the Key Market Driver Energy markets continue to dominate global sentiment as traders closely monitor developments surrounding Iran and the Strait of Hormuz. Although Donald Trump stated that planned US military strikes on Iran were postponed due to ongoing negotiations, oil prices remain historically elevated. Brent crude slipped below $110 per barrel after the announcement, while West Texas Intermediate traded near $103. However, crude prices remain dramatically higher compared with pre-conflict levels. The near-total disruption of shipping through the Strait of Hormuz continues to raise fears of prolonged supply shortages, especially for Asian economies heavily dependent on imported energy. Higher oil prices are now feeding directly into inflation expectations globally, complicating the outlook for central banks and increasing pressure on both bonds and equities. Gold Retreats as Yields and Dollar Rise Despite ongoing geopolitical tensions, Gold moved lower as rising Treasury yields and a stronger US dollar reduced the appeal of non-yielding assets. Gold prices retreated toward $4,540 per ounce after briefly rallying earlier in the week. Investors appear to be balancing safe-haven demand against expectations that higher interest rates may persist longer than anticipated. The US dollar also continued strengthening as investors sought defensive positioning amid market uncertainty. What Traders Should Watch Today Markets remain extremely sensitive to headlines related to the Middle East conflict, oil supply disruptions, and bond market movements. Key themes traders will monitor throughout the session include: Developments regarding US-Iran negotiations Movements in Treasury yields Crude oil volatility and Strait of Hormuz updates Upcoming earnings from major AI and technology companies Central bank expectations and inflation outlook The current environment suggests volatility is likely to remain elevated. While AI optimism continues to provide long-term support for equities, rising yields and persistent energy inflation are beginning to challenge the sustainability of the rally. For traders, today’s session may revolve around whether markets continue rotating into defensive positioning or whether buyers return to risk assets following recent pullbacks. Always trade with strict risk management. Your capital is the single most important aspect of your trading business. Please note that times displayed based on local time zone and are from time of writing this report. Click HERE to access the full HFM Economic calendar. Want to learn to trade and analyse the markets? Join our webinars and get analysis and trading ideas combined with better understanding of how markets work. Click HERE to register for FREE! Click HERE to READ more Market news. Andria Pichidi HFMarkets Disclaimer: This material is provided as a general marketing communication for information purposes only and does not constitute an independent investment research. Nothing in this communication contains, or should be considered as containing, an investment advice or an investment recommendation or a solicitation for the purpose of buying or selling of any financial instrument. All information provided is gathered from reputable sources and any information containing an indication of past performance is not a guarantee or reliable indicator of future performance. Users acknowledge that any investment in Leveraged Products is characterized by a certain degree of uncertainty and that any investment of this nature involves a high level of risk for which the users are solely responsible and liable. We assume no liability for any loss arising from any investment made based on the information provided in this communication. This communication must not be reproduced or further distributed without our prior written permission. -
Thank you!!! I did not see it on that other thread. Any chance someone have some templates? 🙂
-
it works for me fine, maybe try to reinstall the indi and resource from that other thread posted above
-
thanks - I get this when I add the zip though "Unable to retrieve type info for 'NinjaTrader. Data. BarsType' from assembly 'NinZaNewHorizon_NT8': Unable to load one or more of the requested types. Retrieve the LoaderExceptions property for more information." any ideas pls? thx