
⤴️-Paid Ad- Check advertising disclaimer here. Add your banner here.🔥
All Activity
- Past hour
-
 jamie park joined the community
 - Today
-

Market Technical Analysis by RoboForex
RBFX Support replied to RBFX Support's topic in Technical Analysis
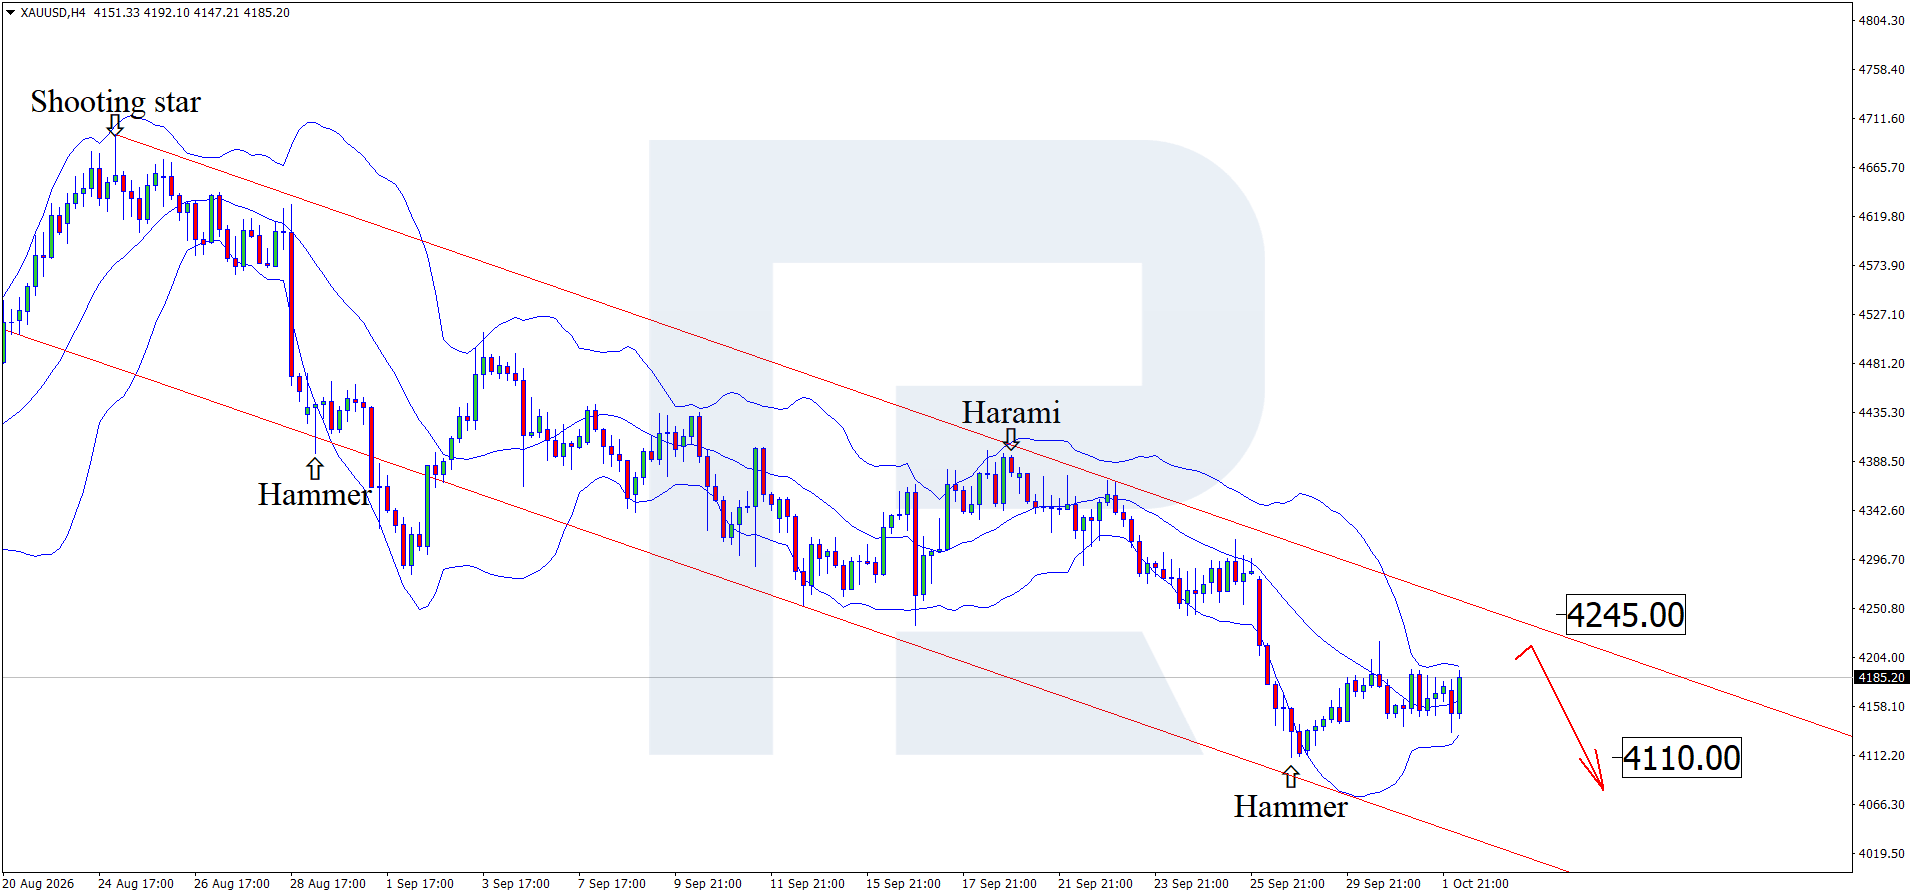
Gold awaits NFP: weak inflation gives XAUUSD a chance to recover Gold continues its corrective wave ahead of the release of US employment data (NFP), with prices hovering at 4,185 USD. Technical outlook On the H4 chart, XAUUSD prices formed a Hammer reversal pattern near the lower Bollinger Band and could continue a corrective wave as the pattern signal plays out. Since XAUUSD remains within a descending channel, the target for a pullback could be the 4,245 USD resistance level. The release of US employment data could provide additional momentum to XAUUSD and trigger a deeper correction. Read more - Gold Forecast Attention! Forecasts presented in this section only reflect the author’s private opinion and should not be considered as guidance for trading. RoboForex bears no responsibility for trading results based on trading recommendations described in these analytical reviews. Sincerely, The RoboForex Team
-
roboforex Market Fundamental Analysis by RoboForex
RBFX Support replied to RBFX Support's topic in Fundamental Analysis
EURUSD strengthens ahead of the Nonfarm Payrolls release The EURUSD pair is undergoing an upward correction as it attempts to recover from the lower boundary of the channel. The rate currently stands at 1.1256. EURUSD forecast: key takeaways Rising energy and fuel prices are adding to pressure on the eurozone industrial sector The likelihood of a Federal Reserve rate hike in October fell to 26.0% from 68.6% a week earlier EURUSD forecast for 2 October 2026: 1.1165 Fundamental analysis The EURUSD rate is correcting after four consecutive trading sessions of declines. On the daily chart, the price has reached the lower boundary of the descending channel, which could limit selling activity and create conditions for a local recovery in the pair. The main factor behind the EURUSD decline remains the aggressive sell-off in the US bond market, where the yield on 10-year US Treasuries has risen to a 24-year high of around 5.34%. RoboForex Market Analysis & Forex Forecasts Attention! Forecasts presented in this section only reflect the author’s private opinion and should not be considered as guidance for trading. RoboForex bears no responsibility for trading results based on trading recommendations described in these analytical reviews. Sincerely, The RoboForex Team -

HFMarkets (hfm.com): Market analysis services.
AllForexnews replied to AllForexnews's topic in Fundamental Analysis
[B]Date: 2nd October 2026.[/B] [B]Bitcoin Starts Q4 Near Key Resistance as ETF Demand and Fed Expectations Drive the Outlook.[/B] Bitcoin enters the fourth quarter trading close to recent highs, supported by improving institutional demand, stronger spot-market activity and a constructive longer-term technical structure. However, momentum has started to cool on the daily chart, leaving traders focused on whether Bitcoin can break through the next major resistance zone or enter a broader period of consolidation. With US spot Bitcoin ETF inflows strengthening and several important US economic releases approaching, Bitcoin's next major move could depend as much on developments in traditional financial markets as on crypto-specific factors. Bitcoin Technical Analysis: Longer-Term Momentum Remains Positive From a weekly perspective, Bitcoin continues to trade close to the upper Bollinger Band, suggesting that bullish momentum remains present despite the recent slowdown. The Relative Strength Index remains elevated but has not yet moved beyond the commonly watched 70 level associated with overbought conditions. Meanwhile, the Stochastic oscillator is already trading within overbought territory, making the coming weekly closes important for determining whether buyers can maintain the current momentum. The MACD also continues to support the broader bullish trend, with its histogram remaining firmly in positive territory. One particularly important technical development has been Bitcoin's move back above its 365-day moving average. According to CryptoQuant data referenced in the original analysis, this represents the first reclaim of the indicator since March 2023. Historically, the long-term moving average has attracted attention because sustained moves above it have often coincided with stronger phases of previous Bitcoin market cycles. However, historical performance does not guarantee that the same pattern will repeat. Bitcoin Daily Chart Shows Signs of Consolidation The shorter-term picture is more cautious. Bitcoin has pulled back from its latest high and is currently moving within a relatively narrow range. This suggests that the strong upward momentum seen previously has started to lose some strength. Both the RSI and Stochastic indicators are approaching elevated levels, while the MACD histogram has slipped slightly below its zero line. At the same time, the Average Directional Index, or ADX, has started moving lower. Because the ADX measures the strength of an existing trend rather than its direction, its decline suggests that Bitcoin's latest directional move is becoming less powerful. This does not necessarily signal a bearish reversal. Instead, it may indicate that the market is entering a period of consolidation while traders reassess valuations and incoming economic data. Key Bitcoin Support and Resistance Levels The immediate technical levels could become increasingly important if volatility rises. On the downside, the first significant support area sits around $83,000, followed by the psychological $80,000 level. Below this region, approximately $77,000 could also attract attention. This area is close to Bitcoin's aggregate Realized Price cited in the underlying market data, which measures the average acquisition price of Bitcoin currently held across the network. On the upside, initial resistance can be found near $85,000, followed by approximately $87,000. A potentially more important support area sits between $88,000 and $90,000. A sustained break above this region could suggest that the market is successfully absorbing the selling pressure created by existing holders. Beyond this area, approximately $96,000-$97,000 could develop into another major resistance zone. Bitcoin Levels to Watch Support: $83,000 Major psychological support: $80,000 Secondary support: approximately $77,000 Initial resistance: $85,000 Secondary resistance: $87,000 Major support zone: $88,000-$90,000 Higher resistance: approximately $96,000-$97,000 Bitcoin ETF Inflows Strengthen Institutional Demand One of the most supportive developments for Bitcoin has been the recovery in US spot Bitcoin ETF demand. US-listed spot Bitcoin ETFs recorded approximately $2.39 billion in weekly net inflows, their strongest weekly performance of 2026 according to the data cited in the original report. The significance lies not only in the size of the inflows but also in when they occurred. Demand remained relatively strong even as Bitcoin pulled back from above $87,000 towards the $83,000 area. This may indicate that institutional investors were willing to increase exposure during weaker price action rather than simply entering after strong rallies. The ETF market has also experienced a substantial improvement compared with earlier in the year. After recording a multi-billion-dollar year-to-date deficit during the summer, cumulative flows reportedly returned to positive territory. Spot-market trading volumes have also increased considerably compared with their August lows, providing another sign that participation is recovering. Continued ETF inflows could therefore remain one of the most important fundamental factors supporting Bitcoin during Q4. Options Market Points to Higher Resistance Levels Bitcoin derivatives markets are also providing useful information about investor positioning. Options activity has maintained a relatively bullish bias, with the put-to-call ratio remaining below 1 during the period covered by the report. Call options give traders the right to buy an asset at a predetermined price, while puts provide the right to sell. A lower put-to-call ratio can therefore indicate stronger demand for upside exposure, although options positioning should never be interpreted in isolation. Large positioning has also appeared around substantially higher Bitcoin strike prices for December expiry. Dealer hedging activity reportedly highlights the $95,000-$97,000 region as one of the first major resistance areas should Bitcoin extend its recovery. Bitcoin Remains Highly Sensitive to NASDAQ and Global Risk Sentiment Despite developments specific to the cryptocurrency market, Bitcoin continues to trade as part of the wider global risk environment. Recent price action demonstrated this relationship when Bitcoin, gold and the Nasdaq all declined during the same period. Bitcoin fell from around $84,500 towards $82,800, while US technology stocks and gold also came under pressure. Interestingly, the US Dollar Index also weakened during the move. That combination differs from a traditional flight-to-safety environment, in which investors would normally expect the dollar to strengthen. Instead, the simultaneous decline across several asset classes could point towards broader position reduction or deleveraging. For Bitcoin traders, this reinforces the importance of monitoring equity markets, Treasury yields and overall investor risk appetite rather than focusing exclusively on cryptocurrency developments. Federal Reserve Expectations Could Be Crucial for Bitcoin The Federal Reserve remains another major risk factor heading into the remainder of Q4. Two FOMC meetings remain during the quarter: October 27-28 and December 8-9. At the beginning of the period covered by the source material, financial markets were pricing a higher probability of another 25-basis-point increase in October than of unchanged interest rates. However, these probabilities can change rapidly following inflation, employment and economic-growth releases. Higher interest rates generally increase yields available on lower-risk assets while tightening financial conditions. This can create pressure on assets such as cryptocurrencies and growth stocks. Conversely, softer inflation or weaker economic data could reduce expectations for additional tightening, potentially improving sentiment towards risk assets. This means incoming US economic releases could become just as important for Bitcoin as crypto-specific news. US Inflation and Labour Data Come Into Focus Several important economic indicators could influence the Federal Reserve's next decision. Core PCE inflation remains particularly significant because it is one of the Fed's preferred measures of underlying inflation. A stronger-than-expected inflation reading could reinforce expectations that interest rates need to remain restrictive for longer. A weaker result, by contrast, could reduce pressure on policymakers to tighten monetary policy further. US economic growth is another factor traders will monitor closely. Strong GDP growth can demonstrate economic resilience, but it can also provide the Federal Reserve with greater flexibility to maintain higher interest rates. Labour-market data will also remain important tomorrow with NFP. If employment remains strong and unemployment stays low, policymakers may see less urgency to loosen financial conditions. Conversely, signs of material labour-market weakness could shift expectations towards a more cautious Fed stance. Bitcoin's reaction to upcoming macroeconomic releases may therefore depend heavily on how those figures change expectations for interest rates. Q4 Has Historically Been Strong for Bitcoin – But History Is Not a Guarantee The fourth quarter has historically produced some of Bitcoin's strongest returns. Bitcoin's average Q4 performance since 2013 has been particularly strong compared with other periods of the year. However, averages can be misleading. Bitcoin has also recorded weaker fourth quarters, and the structure of the cryptocurrency market has changed considerably over time. Institutional participation is significantly larger, spot ETFs have become an important source of market demand and Bitcoin is increasingly influenced by global liquidity conditions and monetary policy. Another important consideration is the gradual reduction in returns across Bitcoin's major historical cycles. Each successive cycle has produced a smaller multiple from its market low than the previous cycle. This trend could suggest that as Bitcoin matures into a larger asset class, investors may need to moderate expectations regarding the scale of future gains. Crypto Adoption Continues Despite Market Volatility While cryptocurrency prices have experienced considerable volatility, blockchain activity has remained relatively resilient. According to Chainalysis data cited in the source material, worldwide crypto activity declined only slightly over the year through June, despite a much larger fall in total cryptocurrency market capitalisation. A notable part of that activity came from areas outside speculative trading. Domestic peer-to-peer transactions expanded significantly, while international stablecoin transfers also increased. Stablecoin balances remained comparatively stable even as broader crypto asset values declined sharply, suggesting that blockchain-based payment and settlement activity may be developing independently from short-term market valuations. This distinction could become increasingly important as investors evaluate whether cryptocurrency adoption is being driven primarily by speculation or by growing financial utility. Tokenization Becomes a Larger Traditional Finance Theme Another longer-term development is the increasing interest in tokenized financial markets. US regulators have recently discussed the potential expansion of tokenized assets, on-chain financial infrastructure and round-the-clock trading. The CFTC has highlighted the possibility that financial markets could experience significant structural changes over the next decade as blockchain technology becomes more integrated into traditional finance. Regulatory developments around stablecoins, tokenized securities and 24-hour markets could therefore become an increasingly important theme for both cryptocurrency and traditional financial markets. Bitcoin Q4 Outlook: What Could Drive the Next Move? Bitcoin begins Q4 with several constructive factors behind it. Institutional ETF demand has strengthened, spot-market activity has recovered and Bitcoin's broader technical structure remains positive. However, the market is also approaching important resistance areas while short-term momentum indicators show signs of cooling. A stronger bullish scenario could develop if ETF inflows remain persistent and Bitcoin successfully breaks above the $88,000-$90,000 resistance region. A move beyond this supply zone could shift attention towards approximately $95,000-$97,000. The downside scenario would become more relevant if inflation remains elevated, Federal Reserve expectations turn increasingly hawkish or investors begin taking substantially larger profits into price strength. For now, the $83,000-$85,000 region may act as an important short-term battleground between buyers and sellers. Whether Bitcoin can defend its recent gains while absorbing overhead supply could determine if the cryptocurrency extends its recovery during Q4 or enters a broader consolidation phase. [B]Always trade with strict risk management. Your capital is the single most important aspect of your trading business.[/B] [B]Please note that times displayed based on local time zone and are from time of writing this report.[/B] Click [URL='https://www.hfm.com/hf/en/trading-tools/economic-calendar.html'][B]HERE[/B][/URL] to access the full HFM Economic calendar. Want to learn to trade and analyse the markets? Join our webinars and get analysis and trading ideas combined with better understanding of how markets work. Click [URL='https://www.hfm.com/en/trading-tools/trading-webinars.html'][B]HERE[/B][/URL] to register for FREE! [URL='https://analysis.hfm.com/'][B]Click HERE to READ more Market news.[/B][/URL] [B]Andria Pichidi HFMarkets[/B] [B]Disclaimer:[/B] This material is provided as a general marketing communication for information purposes only and does not constitute an independent investment research. Nothing in this communication contains, or should be considered as containing, an investment advice or an investment recommendation or a solicitation for the purpose of buying or selling of any financial instrument. All information provided is gathered from reputable sources and any information containing an indication of past performance is not a guarantee or reliable indicator of future performance. Users acknowledge that any investment in Leveraged Products is characterized by a certain degree of uncertainty and that any investment of this nature involves a high level of risk for which the users are solely responsible and liable. We assume no liability for any loss arising from any investment made based on the information provided in this communication. This communication must not be reproduced or further distributed without our prior written permission. -
MT5 support makes sense, especially if the indicator is going to be used with brokers that are gradually moving away from MT4. For beta testing I'd mainly check whether the signals match the web version exactly and whether anything changes with different symbols, broker feeds or time zones. Those little implementation differences can matter a lot
-
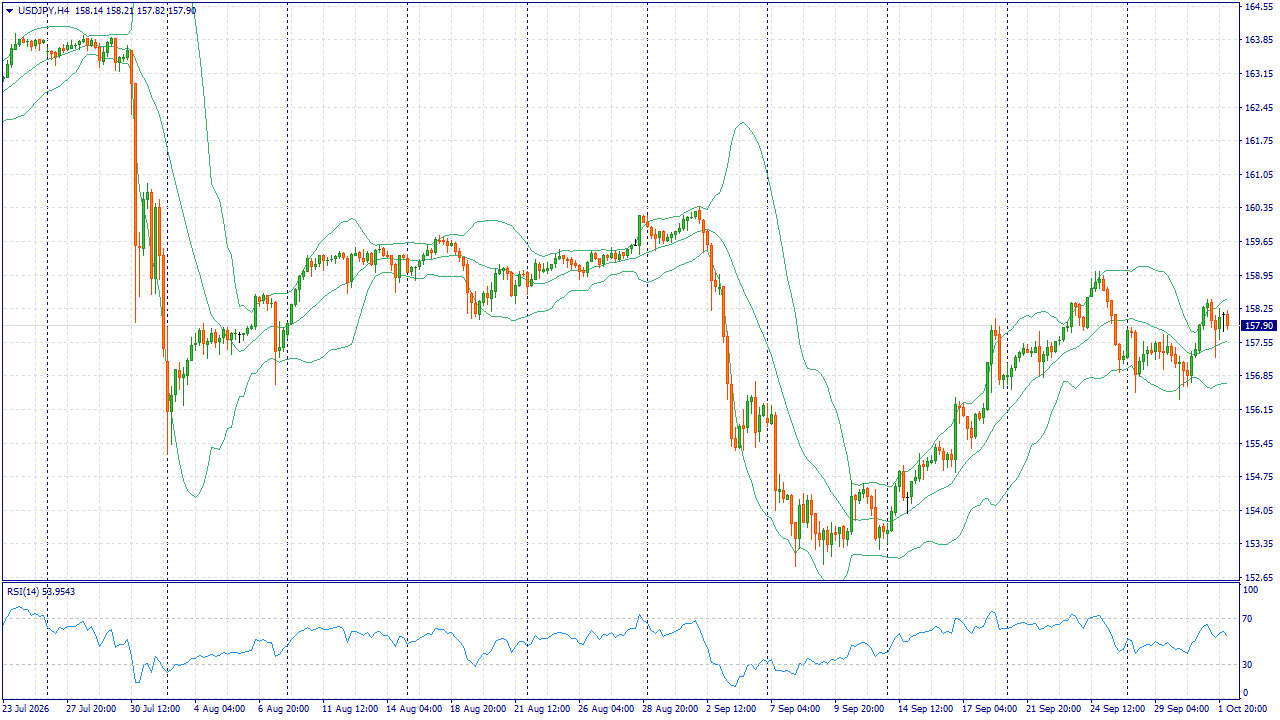
 Fundamental Market Analysis for October 02, 2026 USDJPY Event to watch today: 15:30 EET. USD - Unemployment Rate USDJPY: $25 for a risk-free start! Register, complete verification, enter promo code INDOINVEST10 in your Personal Area, and get a trading bonus with no deposit required. Inflation in Tokyo gave the yen fresh support: the core measure excluding fresh food accelerated in September to 2.7% from 1.8%, exceeding expectations of 2.4%. Core inflation excluding fresh food and fuel reached 3%, and services inflation also strengthened. This expands the case for further Bank of Japan rate hikes, although part of the acceleration is linked to the end of subsidies. High US bond yields continue to support the dollar, but their rise cannot be fully explained by expectations of an imminent Fed rate hike. Softer US inflation and cautious signals from the regulator have reduced the likelihood of an immediate move. Amid European budget risks, safe-haven demand could support both the dollar and the yen, so their ratio requires separate assessment. For USD/JPY, the new Japanese inflation signal now creates grounds for a decline despite the persistent interest rate differential. The US employment report could cancel this scenario if strong wage growth again fuels expectations of Fed tightening. Prior to the release, the base idea is to sell the pair: yen support relies on new data, not just the risk of currency intervention. Trading idea: SELL 157.95, SL 158.30, TP 157.15 Our company provides the opportunity to earn income not only from your trading. By attracting clients within the affiliate program, you can earn up to $30 per lot! You can find more analytical information on our website.
- Yesterday
-

VIP Membership - FREE upgrade for OLD and ACTIVE Members
KJs replied to MrAdmin's topic in Announcements
Dear Traderbeuty, Greetings!! Please add me as VIP Member. Warm Regards. -
Welcome to Indo-Investasi.com. Please feel free to browse around and get to know the others. If you have any questions please don't hesitate to ask.
-

VIP Membership - FREE upgrade for OLD and ACTIVE Members
juanfer replied to MrAdmin's topic in Announcements
Hi, I don't think I'm set up as a VIP; could you upgrade me? Thanks. -
p.s. demo trading is the perfect place to build that routine, but it takes serious patience. Don’t rush into high leverage, protect your capital first and keep learning every day.
-
Reviving this thread because the point about the 5-7% success rate really stuck with me. Anyone here moved past the demo stage and can share what actually made the difference between losing and staying profitable long term?
-
 FillyWaelde joined the community
 -
 J1024 joined the community
 -
HFMarkets (hfm.com): Market analysis services.
AllForexnews replied to AllForexnews's topic in Fundamental Analysis
[B]Date: 1st October 2026.[/B] [B]NASDAQ Hits Record High as Softer Inflation and Strong US Growth Boost Stocks.[/B] Markets had four key new economic releases to analyse and digest on Wednesday. For Gold and the US Dollar, the news was neither completely positive nor negative. However, the data was ideal to spur a bullish trend in the stock market. This morning the NASDAQ trades at a new all-time high after rising 1.22% in the Asian session and 0.23% the day before. Currently, US and Asian indices are all trading higher, while European indices continue to struggle. The best performing indices so far are the NIKKEI 225 and the NASDAQ 100. The following economic releases were the main price drivers for the latest volatility: Core PCE Price Index: 0.2% VS 0.3% (lower than previous expectations) ADP Non-Farm Employment Change: 90,000 VS 73,000 (higher than previous expectations) Final US Quarterly GDP: 2.2% VS 1.5% (higher than previous expectations) US Personal Monthly Spending: 0.9% VS 0.8% (higher than previous expectations) NASDAQ (USA100) - Economic Resilience and Lower Inflation Impels Ideal Conditions For Stocks The NASDAQ had been trading sideways in range bound conditions for a good part of the past five days. However, the latest economic releases were quick to spur a new bullish impulse wave. The NASDAQ is now trading more than 18% higher in 2026 and looks on track to complete a fourth bullish year. HFM - NASDAQ Daily Chart The Core PCE Price Index, the Federal Reserve’s preferred inflation reading, rose 3% year-on-year, coming in below 3.2% which markets were expecting. The lower inflation reading does not completely erase the possibility of an interest rate adjustment on October 28th. However, there now is a possibility of a pause until the central bank gathers further data. There is a 35% possibility of an interest rate hike in October according to the CME Group. This is significantly lower than 70% which was being advised a few days ago. However, many economists continue to advise that if tomorrow's NFP data continues to read positive, the Fed will hike. According to analysts with a hawkish view, the strong economic performance allows the Fed to tackle inflation, and even with a slightly softer PCE reading, the figure remains firmly above 2% with no real evidence to suggest 2% is achievable in the foreseeable future. Nonetheless, the softer inflation reading along with strong employment indicates less certain hikes, along with a strong economy and consumer demand. This provides ideal conditions for the stock market, particularly before the upcoming earnings season, which is two weeks away. Alphabet and Micron Stocks Boost NASDAQ’s Bullish Trend In terms of components, the top six companies are the main price drivers behind the latest price movement. These include NVIDIA, Microsoft, Apple, Alphabet, Amazon and SpaceX. All of the six most influential companies for the NASDAQ rose in value. Alphabet stocks are particularly providing support after rising more than 1% on Wednesday and a further 1.70% in after hours trading. Another key stock which is experiencing strong volatility, particularly during earnings seasons, is Micron Technology. Micron Technology issued a stronger-than-expected outlook for the current quarter, supported by booming AI-related demand. However, the company warned that higher employee compensation costs could put pressure on profit margins. The company expects fiscal first-quarter revenue of around $61.5 billion, with adjusted earnings of approximately $38.15 per share. NASDAQ (USA100) - Technical Analysis In terms of technical analysis, the NASDAQ is seeing strong bullish signals from both indicators and technical analysis. The price is trading above the day’s VWAP and all key moving averages. Bollinger bands are widening and the price is trading at the upper band indicating strong bullish momentum. However, the price is overbought on the RSI on all timeframes below the 1-hour chart and is witnessing divergence on the 4-hour chart. This indicates the possibility of the trend losing momentum and either retracing or moving sideways. The price movement in October will largely depend on oil prices, the Fed’s rate decision and earnings reports. The ideal scenario for the NASDAQ would be for Oil to continue falling below $85 per barrel, for the Fed to pause and for earnings to remain strong. HFM - NASDAQ 5-Minute Chart On the 5-minute timeframe, the bullish signals remain strong and intact for now. Bearish signals are not likely to arise on indicators unless the price falls below $30,658.50. Above this level will see bullish indications remain. Key Takeaways: The NASDAQ reached a new all-time high after the latest string of economic releases. Softer PCE inflation reduced expectations for an immediate Federal Reserve rate hike supporting stocks. Strong GDP growth and consumer spending reinforced confidence in the US economy’s resilience ahead of the upcoming earnings season. Mega-cap technology and AI-related stocks remained key drivers of the market’s advance. Of particular interest was Alphabet and Micron Technology stocks. ical signals remain mixed, with short-term bullish momentum but larger timeframes still pointing to downside risk. Always trade with strict risk management. Your capital is the single most important aspect of your trading business. Please note that times displayed based on local time zone and are from time of writing this report. Click HERE to access the full HFM Economic calendar. Want to learn to trade and analyse the markets? Join our webinars and get analysis and trading ideas combined with better understanding of how markets work. Click HERE to register for FREE! Click HERE to READ more Market news. Michalis Efthymiou HFMarkets Disclaimer: This material is provided as a general marketing communication for information purposes only and does not constitute an independent investment research. Nothing in this communication contains, or should be considered as containing, an investment advice or an investment recommendation or a solicitation for the purpose of buying or selling of any financial instrument. All information provided is gathered from reputable sources and any information containing an indication of past performance is not a guarantee or reliable indicator of future performance. Users acknowledge that any investment in Leveraged Products is characterized by a certain degree of uncertainty and that any investment of this nature involves a high level of risk for which the users are solely responsible and liable. We assume no liability for any loss arising from any investment made based on the information provided in this communication. This communication must not be reproduced or further distributed without our prior written permission. -
Market Technical Analysis by RoboForex
RBFX Support replied to RBFX Support's topic in Technical Analysis
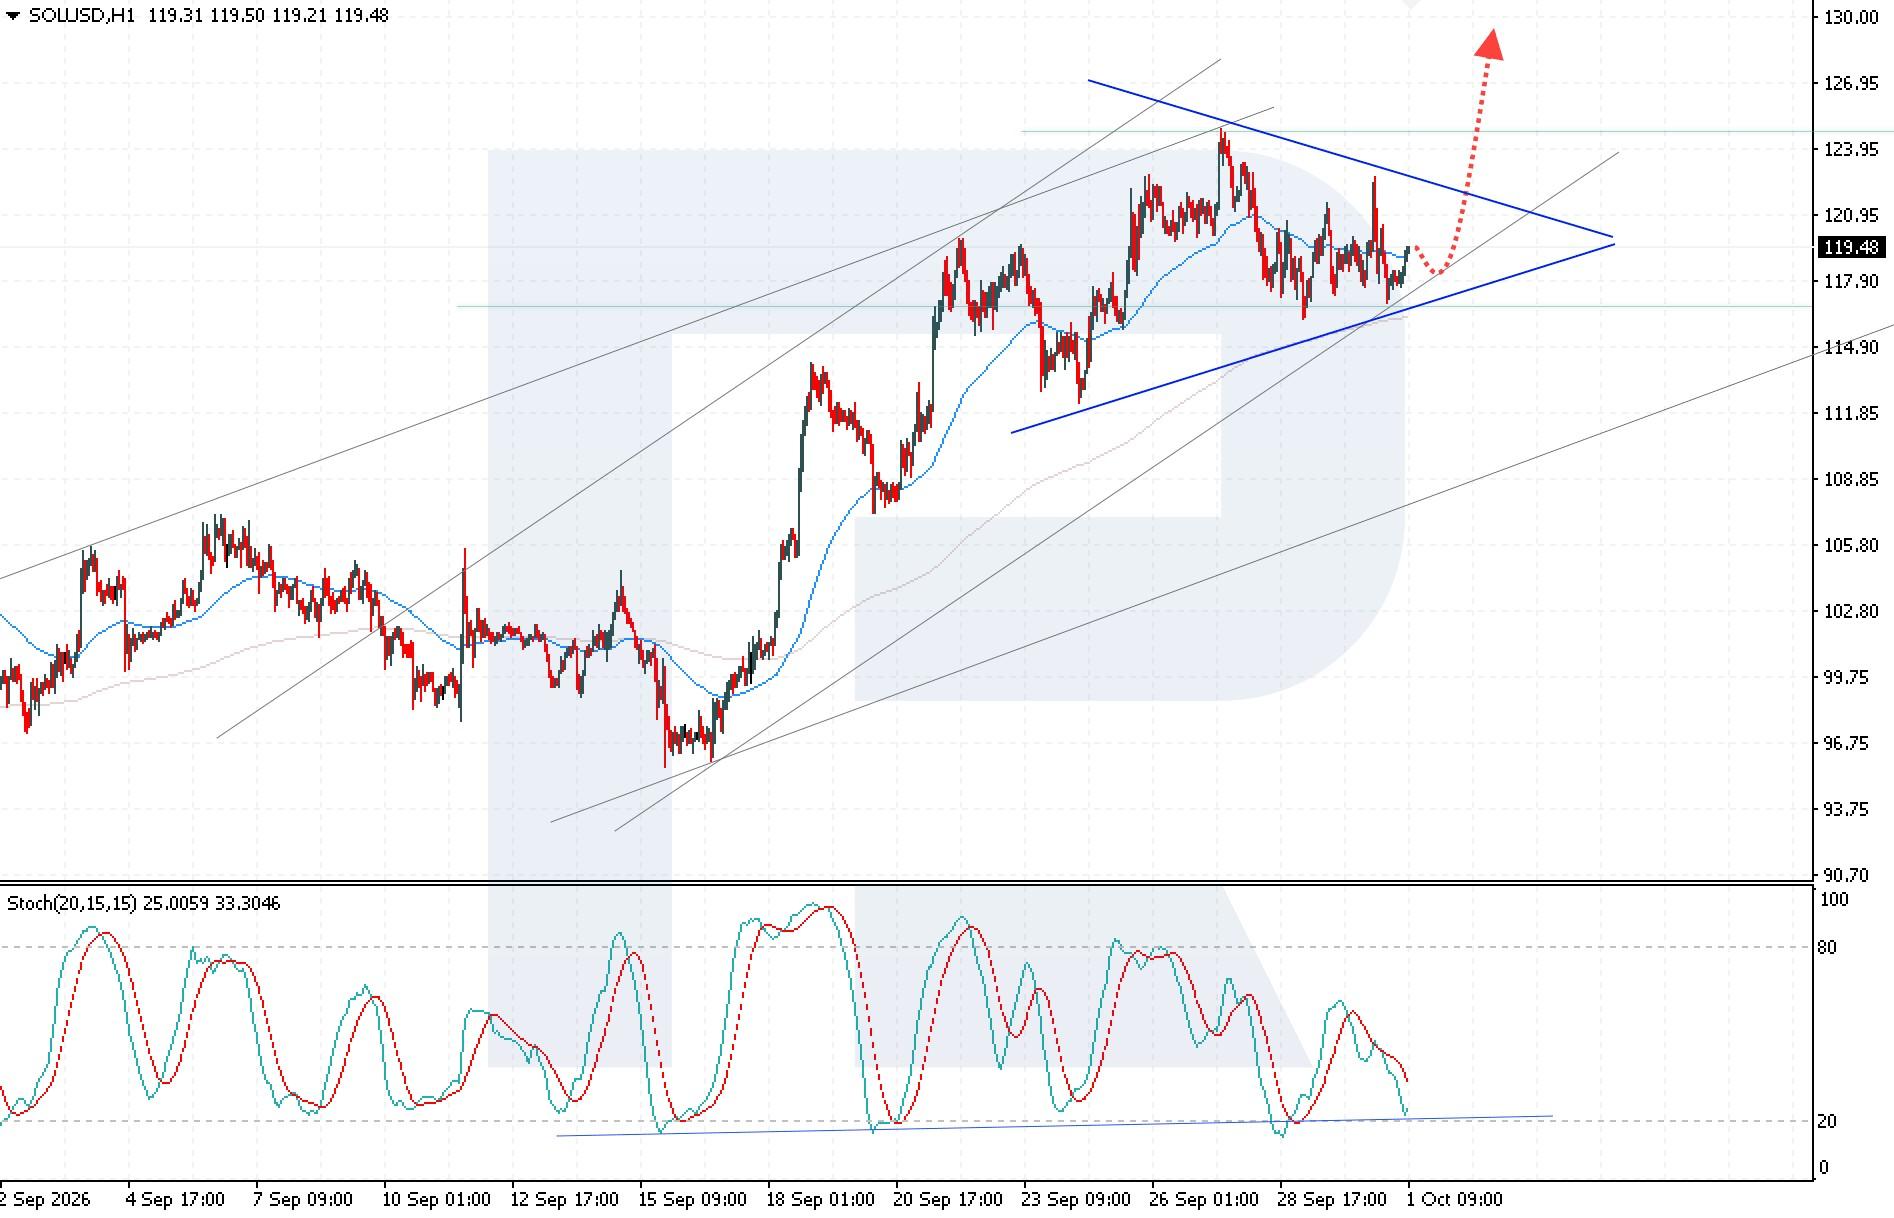
SOLUSD strengthens amid record inflows into Solana ETFs SOLUSD is strengthening amid strong buyer demand and positive developments within the Solana ecosystem. The current price is 119.48. Technical outlook SOLUSD has consolidated above the EMA-65 line, although the risk of a Triangle pattern forming remains. Today's SOLUSD forecast suggests a continuation of the upward move towards the 130.00 target. SOLUSD retains the potential to continue rising after rebounding from the 117.20 USD support level, while a breakout above the 121.85 USD. Read more - SOLUSD Forecast Attention! Forecasts presented in this section only reflect the author’s private opinion and should not be considered as guidance for trading. RoboForex bears no responsibility for trading results based on trading recommendations described in these analytical reviews. Sincerely, The RoboForex Team
-
roboforex Market Fundamental Analysis by RoboForex
RBFX Support replied to RBFX Support's topic in Fundamental Analysis
JP 225: PMI supports further gains The JP 225 index has completed its correction and is poised to resume growth. The current price stands at 65,453.0. JP 225 forecast: key takeaways The S&P Global Japan Services PMI stood at 51.6 The Bank of Japan raised its key interest rate to 1.3% JP 225 forecast for 1 October 2026: Fundamental analysis The JP 225 forecast for today, 1 October 2026, takes into account that the decline in the S&P Global Japan Services PMI from 52.5 to 51.6 in September 2026 is a moderately negative signal for the Japanese stock market, but does not indicate a contraction in business activity. For the JP 225 index, the initial reaction to such data could be moderately negative or neutral. A slowdown in the services sector reduces expectations for the pace of domestic demand growth. RoboForex Market Analysis & Forex Forecasts Attention! Forecasts presented in this section only reflect the author’s private opinion and should not be considered as guidance for trading. RoboForex bears no responsibility for trading results based on trading recommendations described in these analytical reviews. Sincerely, The RoboForex Team -
Thank you, Mr. Kesk. Your contributions are appreciated by everyone.
-
Welcome to Indo-Investasi.com. Please feel free to browse around and get to know the others. If you have any questions please don't hesitate to ask.
-
 soheni3299 joined the community
 -
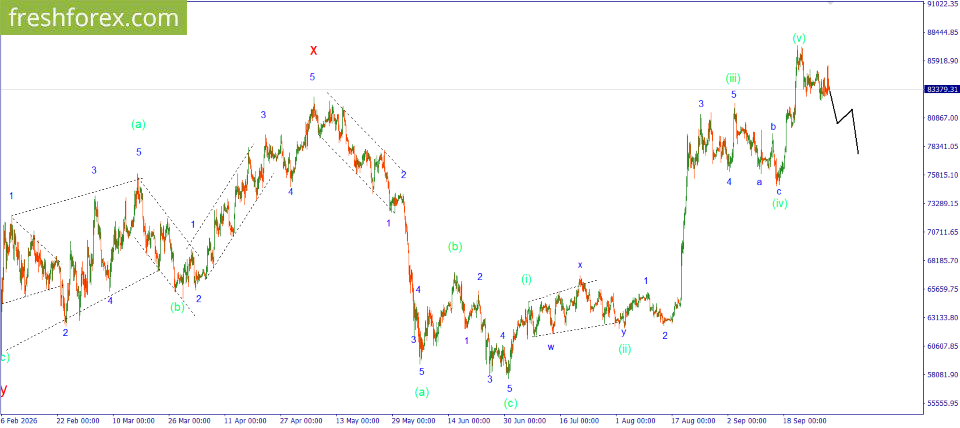
Elliott wave analysis of the market for October 1, 2026 BTCUSD BTCUSD: SELL 82850, SL 84300, TP 77000. $25 for a risk-free start! Register, complete verification, enter promo code INDOINVEST10 in your Personal Area, and get a trading bonus with no deposit required. Bitcoin continues its desperate resistance. This has once again delayed the emergence of another downward wave of the anticipated correction. It is likely that a downward movement will occur today after all. It may turn out that the formed downward wave will become a full-fledged final one for the zigzag correction. After this, price growth will resume. However, it is necessary to monitor how events develop subsequently. For now, it is recommended to consider opening a sell trade at current market prices. Investment idea: SELL 82850, SL 84300, TP 77000. FreshForex offers an amazing bonus 300% on every deposit from $100, providing an opportunity to increase trading volumes! You can find more analytical information on our website.
-
https://mega.nz/file/udZl3YyA#roCr-yUSEcMT1l0hD5y3yfMAgOTX4kbj0KL9i127LaQ Timing Solution Advanced 29 Sep 2026 version ONLY. Not the usual Terra update. Don't have access to this now and once gain access, possibly will resume it.
- Last week
-
roboforex Market Fundamental Analysis by RoboForex
RBFX Support replied to RBFX Support's topic in Fundamental Analysis
XRP under pressure again: ETF inflows slow and US crypto regulation stalls The XRP price is completing a correction after the recent upward momentum, currently trading at 1.4903. XRPUSD forecast: key takeaways Total net inflows into spot XRP ETFs have approached 1.79 billion USD Ripple is developing tools for automated payments using XRP and the RLUSD stablecoin XRPUSD forecast for 30 September 2026: 1.6965 Fundamental analysis The XRPUSD pair is trading amid renewed interest in cryptocurrencies, although XRP's next move largely depends on US Federal Reserve monetary policy, institutional capital inflows, and the development of Ripple's payment infrastructure. One of the main factors supporting XRP remains capital inflows into US exchange-traded funds that invest directly in the cryptocurrency. Total net inflows into spot XRP ETFs have approached 1.79 billion USD. RoboForex Market Analysis & Forex Forecasts Attention! Forecasts presented in this section only reflect the author’s private opinion and should not be considered as guidance for trading. RoboForex bears no responsibility for trading results based on trading recommendations described in these analytical reviews. Sincerely, The RoboForex Team -
Oil back near $100: U.S. reserves at their lowest since 1982 The oil market has once again approached a key psychological level. #BRENT is trading around $99.70, recovering after recently falling into the $96–97 range. At the same time, the fundamental backdrop remains tense: U.S. strategic petroleum reserves have fallen to 283.8 million barrels — the lowest level since October 1982, while the situation around the Strait of Hormuz continues to pose a risk of supply disruptions. What is supporting oil prices right now: U.S. oil reserves are at their lowest level in more than 40 years. The ability to quickly offset major supply disruptions with additional releases from strategic reserves has become significantly more limited. The Strait of Hormuz remains the main source of uncertainty. The conflict between the U.S. and Iran is still far from a final resolution, so the risk of disruptions to oil supplies continues to be reflected in prices. Alternative logistics are more expensive. Exporters have to rely on more complicated transportation and transshipment routes, increasing costs and supporting crude prices. Negotiations are simultaneously limiting the upside. Any signs of a potential agreement between the U.S. and Iran quickly bring sellers back into the market. As a result, price action remains volatile: several dollars of gains can be followed by an equally rapid correction. It is precisely this uncertainty that is keeping #BRENT within a broad range. Over the past few sessions, the price has fallen to around $96, climbed back above $100, and then corrected again. This shows that the market has not yet settled on a clear direction, but buyers continue to return actively on dips. According to FreshForex analysts, the key range for #BRENT right now is $97–101. If oil remains mostly within this range through the beginning of October and does not establish itself below $97, this would indicate that demand is holding up after each correction. In that case, a decisive move above $101 could push the price first toward the $103–105 area and, if tensions surrounding supplies persist, potentially open the way toward $106 and higher. For now, low U.S. reserve levels and uncertainty surrounding the Strait of Hormuz continue to leave room for a significant move higher, rather than simply fluctuations around the $100 level. Trade with the Cashback promotion and receive up to $20 in real funds for every lot! We also offer deposit promotions — learn more. Invest in oil
-
HFMarkets (hfm.com): Market analysis services.
AllForexnews replied to AllForexnews's topic in Fundamental Analysis
[B]Date: 30th September 2026.[/B] [B]Gold Rebounds Temporarily? Weaker US Data and Yields Offer Support.[/B] Gold rebounds on Tuesday as the bearish trend takes a pause and investors purchase at the lower price. Gold has now been in a downward-facing trend measuring 12.50% for five weeks. From the highest price in 2026 to now, the price is trading more than 25% lower. The price on Wednesday is trading higher, but what does the future look like for Gold? Of particular interest was the quick and sudden decline seen on Monday. Gold fell more than 4% throughout all four sessions and with no attempt to rebound. The decline took the price to seven weeks now and close to the psychological price of $4,000. This is also key when analysing the rebound over the past 24 hours, as prices often rebound after such a sharp decline. HFM - Gold 1-Hour Chart Gold - Weaker JOLTS Job Openings and Yields Allow A Rebound In the past 24 hours, gold rose close to 1.90%, which is a moderate rise, but when compared with the previous decline, the rebound remains weak. The attempt to rebound is due to price attractiveness, weaker job vacancies and weaker-than-expected inflation from certain countries. Australia, which is one of the world’s inflation hotspots, saw its inflation fail to reach previous expectations of 4.1%. The same is also being seen in the UK and Japan. As a result, Gold seems slightly more attractive. The latest JOLTS report showed US job openings falling to around 7.08 million in August 2026, down from roughly 7.3 million in July. This points to softer labour demand. Hiring was broadly stable, quits remained subdued, and layoffs stayed relatively low, suggesting that employers are becoming more cautious about adding workers rather than making large-scale job cuts. Another reason why Gold is attempting to rebound is the decline in oil prices and bond yields. Oil prices have fallen for three consecutive days, moving away from the $100 per barrel level which investors fear. Crude oil is now trading 14% lower than the most recent high. Furthermore, the US 10-year Treasury yield fell 33 basis points to 5.23% on Wednesday but remains close to its highest level since 2007. Meanwhile, the 30-year yield rose as high as 5.62%, reaching levels last seen in 2002. The slight fall in bond yields also allows for Gold to retrace higher, but the persistently high levels remain a negative. Traders should note that the rise currently does not remove all bearish signals, and pressure factors remain for Gold. In the upcoming days, key releases include the Core PCE Price Index, Final Gross Domestic Product and US Non-Farm Payroll data on Friday. Gold - Economic Release To Drive Upcoming Swings Markets are expecting the Core PCE Price Index to add a further 0.3% keeping the year on year figure at 3.3%. If the figure rises more than 0.3%, an October rate will almost become certain. However, a 0.4% rise has not been seen since February. If the Core PCE Price Index rises less than the current predictions, Gold may gain bullish momentum. The outcome of the release, along with the final GDP, will be key. The same will apply to the upcoming Non-Farm Payroll figures scheduled for Friday. A weaker figure may support Gold, while a higher figure is likely to see the bearish trend potentially continue. These three releases are likely to determine the medium-term trend. Currently, the possibility of an interest rate hike on October 28th is 45%, significantly lower than the 71% the day before. The reason for the fall is the weaker JOLTS Job Openings yesterday afternoon. However, this release is not enough to maintain momentum. In order for gold to continue to rise and rate hike expectations to fall, the NFP and PCE Index will need to fail to reach current expectations. Gold - Market Forecasts and Technical Analysis HFM - Gold 15-Minute Chart On smaller timeframes, Gold maintains a neutral position and signal from most indications. The neutral sentiment is likely to remain between $4,166.85 and $4,187.60. A breakout of these levels may see indications strengthen. On the 15-minute timeframe, the price maintains a bullish indication while the 30-minute and larger timeframes maintain a bearish signal. If the price breaks above the upper range bound area, bullish indications can materialise. Potential targets can be seen at the $4,213.60 level (at the 100-bar moving average) and $4,279.18 (Monday’s open price). To validate these indications, traders will ideally want to see weaker US data alongside rising prices across other metals. A bearish breakout will see bearish sentiment rise and fall in line with the picture seen on larger timeframes. Stronger-than-expected releases will validate the decline with indications pointing towards a decline to $4,111.50 and $4,019.00. Key Takeaways: Gold is rebounding, but the broader trend remains bearish, with prices still sharply lower over the past five weeks. Weaker JOLTS data, lower oil prices and softer Treasury yields have helped support the recent recovery. Core PCE, US GDP and Non-Farm Payrolls are likely to drive Gold’s next major move and influence Fed rate expectations. Technical signals remain mixed, with short-term bullish momentum but larger timeframes still pointing to downside risk. [B]Always trade with strict risk management. Your capital is the single most important aspect of your trading business.[/B] [B]Please note that times displayed based on local time zone and are from time of writing this report.[/B] Click [URL='https://www.hfm.com/hf/en/trading-tools/economic-calendar.html'][B]HERE[/B][/URL] to access the full HFM Economic calendar. Want to learn to trade and analyse the markets? Join our webinars and get analysis and trading ideas combined with better understanding of how markets work. Click [URL='https://www.hfm.com/en/trading-tools/trading-webinars.html'][B]HERE[/B][/URL] to register for FREE! [URL='https://analysis.hfm.com/'][B]Click HERE to READ more Market news.[/B][/URL] [B]Michalis Efthymiou HFMarkets[/B] [B]Disclaimer:[/B] This material is provided as a general marketing communication for information purposes only and does not constitute an independent investment research. Nothing in this communication contains, or should be considered as containing, an investment advice or an investment recommendation or a solicitation for the purpose of buying or selling of any financial instrument. All information provided is gathered from reputable sources and any information containing an indication of past performance is not a guarantee or reliable indicator of future performance. Users acknowledge that any investment in Leveraged Products is characterized by a certain degree of uncertainty and that any investment of this nature involves a high level of risk for which the users are solely responsible and liable. We assume no liability for any loss arising from any investment made based on the information provided in this communication. This communication must not be reproduced or further distributed without our prior written permission. -
Market Technical Analysis by RoboForex
RBFX Support replied to RBFX Support's topic in Technical Analysis
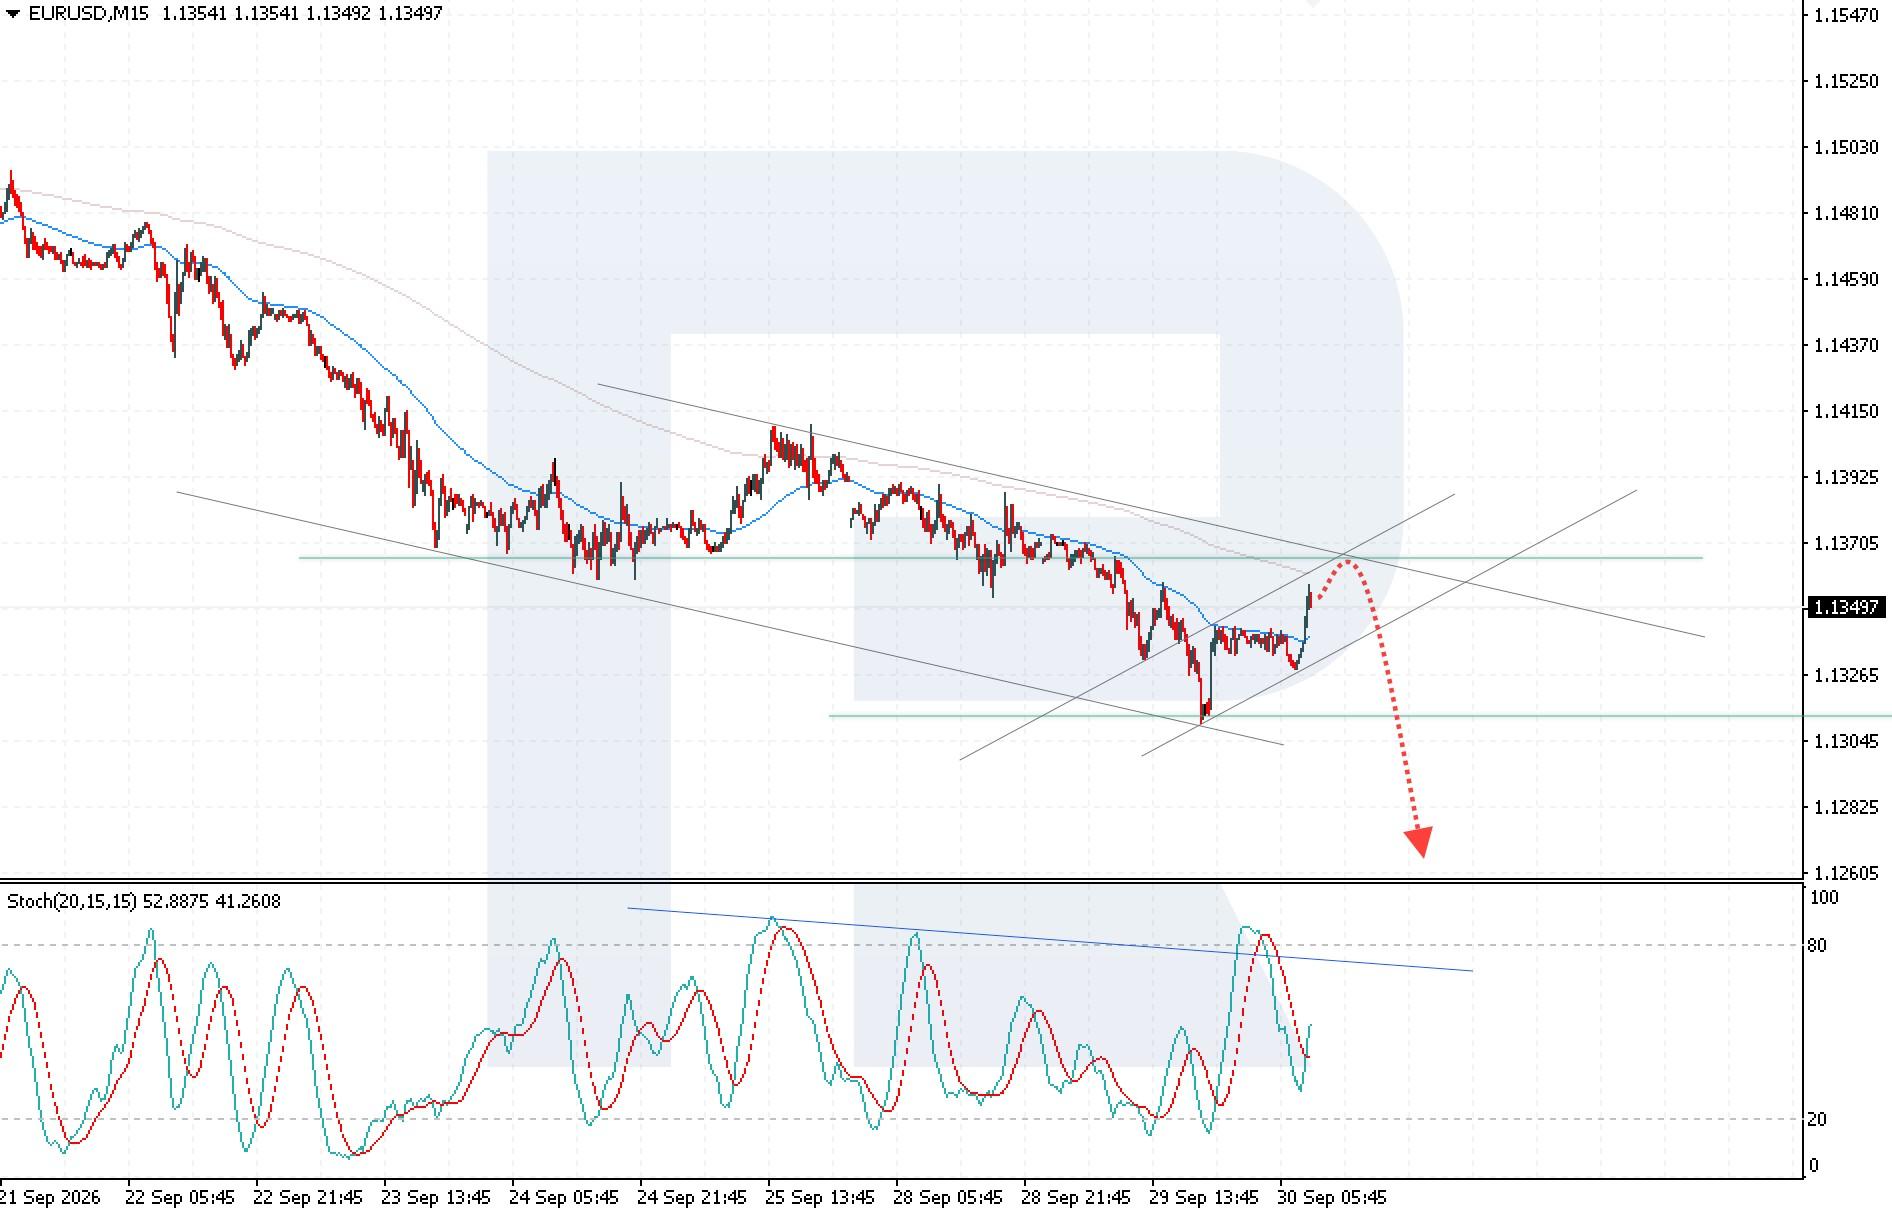
EURUSD poised for another decline after correction The EURUSD pair is recovering but remains under pressure from the strong US dollar, with the rate currently standing at 1.1349. Technical outlook The EURUSD pair is strengthening but remains within a descending channel. The EURUSD forecast for today, 30 September 2026, suggests that the decline could resume, with the nearest target at 1.1265. The EURUSD forecast for 30 September 2026 points to continued selling pressure despite the local recovery in the pair. Read more - EURUSD Forecast Attention! Forecasts presented in this section only reflect the author’s private opinion and should not be considered as guidance for trading. RoboForex bears no responsibility for trading results based on trading recommendations described in these analytical reviews. Sincerely, The RoboForex Team
-
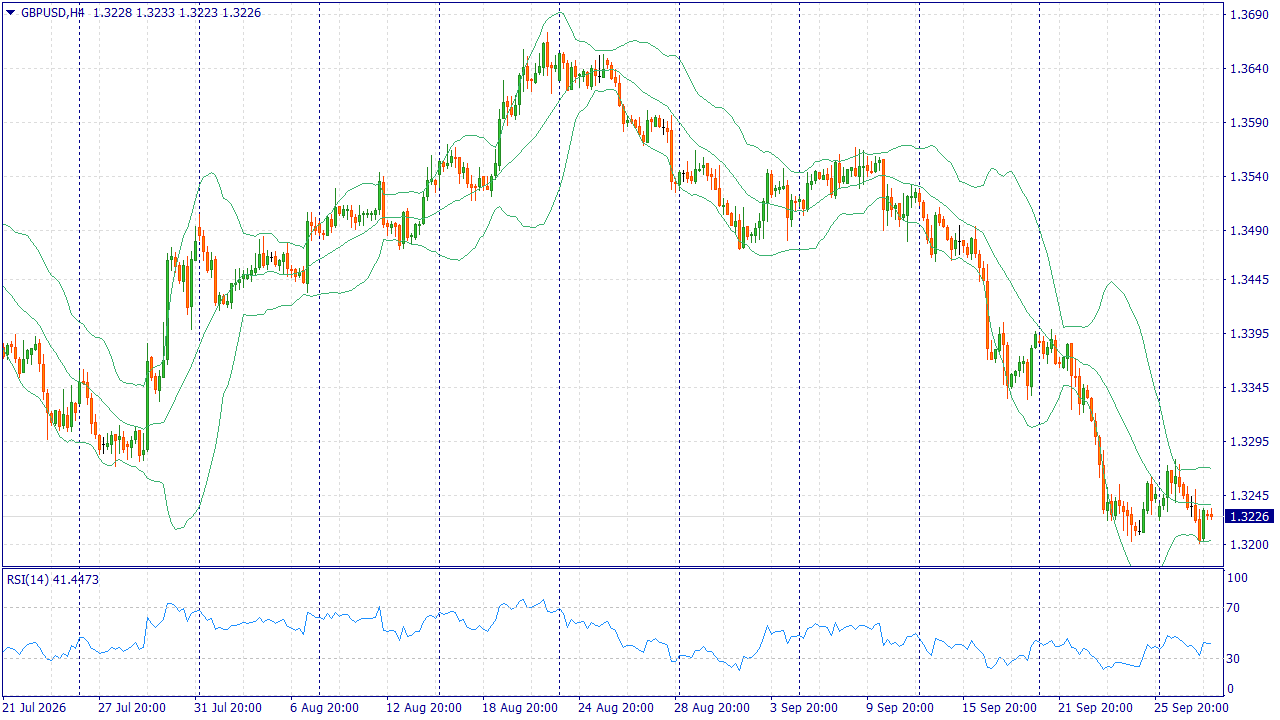
Fundamental Market Analysis for September 30, 2026 GBPUSD Event to watch today: 15:30 EET. USD - Change in GDP volume quarter-on-quarter GBPUSD: The pound is approaching the European session near three-month lows, although the domestic backdrop in the UK does not appear unequivocally weak. The market anticipates a more hawkish trajectory from the Bank of England due to inflationary pressures, and statements on fiscal discipline have partially supported British assets. These factors limit the pace of GBP/USD decline but have not yet formed a sustained bullish momentum for the pound. The key external factor remains the divergence between high yields in the US and the more vulnerable valuation of British assets. The dollar is supported by strong US economic data and expectations of another Fed rate hike this year. John Williams' statement reduced the likelihood of immediate tightening in October, but the market still awaits confirmation from inflation and employment data. For GBP/USD, the picture looks more balanced than for the euro: the Bank of England can contain pressure on the pound, but the overall dollar momentum remains stronger. Given the already realized decline, selling potential is limited, so the base scenario assumes moderate continuation of the move, unless US statistics provide grounds for a significant revision of Fed expectations. Trading idea: SELL 1.3240, SL 1.3270, TP 1.3180 Up to $20 for each lot in real money - get a guaranteed income by connecting Cashback promotion! You can find more analytical information on our website.
-
 arlo1286 joined the community
 -
HFMarkets (hfm.com): Market analysis services.
AllForexnews replied to AllForexnews's topic in Fundamental Analysis
[B]Date: 29th September 2026.[/B] [B]AUDUSD Falls Despite RBA Hike as Gold Drops to an 7-Week Low.[/B] The Reserve Bank of Australia increases interest rates for the fourth time taking the rate to a 15-year high. However, the Australian Dollar saw a considerable decline after the governor’s speech due to economic concerns. The best performing currencies of the day are the Japanese Yen and US Dollar. The US Dollar continues to find support from higher bond yields and expectations of further interest rate hikes. The stronger Dollar and higher yields saw a pause in the stock market’s bullish trend, but Gold saw the harshest ripple effect. Gold fell 4.00% in total on Monday taking the price to an 8-week low. AUDUSD - RBA Hikes But Economic Worries Take The AUD Lower The Australian Dollar Index is currently trading 0.44% lower during this morning Asian session and 0.50% against the US Dollar. The Reserve Bank of Australia increased its interest rate from 4.35% to 4.60% and remains the most hawkish central bank of 2026. This has been one of the primary reasons behind the bullish trend seen this year. The Reserve Bank of Australia has been particularly hawkish as inflation has remained far above its 2% target. Between 2015 to 2020, Australia’s inflation rate on average was 1.85%. Whereas the average over the past 5 years has been 4.3%. Inflation is the key reason behind the bank’s hawkish stance, however, the economy has also been weakening as a result. The fourth rate increase is expected to add around $480 per month to repayments on an average $730,000 mortgage compared with January. This equates to more than $5,000 per year. One of the reasons behind the decline and the market reaction was that the hike was already priced into the market. The second is that economists and the central bank are expecting higher rates to cause an economic slowdown. Economists now advise the possibility of a recession for Australia has risen to 35%. Higher Australian rates are also becoming a growth risk. This was the RBA's fourth increase this year, and the bank acknowledges that previous tightening is already slowing parts of the economy. That means additional hikes could eventually become negative for the Australian Dollar if investors become more worried about Australian growth. Lastly, another key factor is the strength of the US Dollar. The stronger Dollar is also placing downward pressure on Gold prices, which could further weigh on AUDUSD given Australia’s close exposure to commodity markets. HFM - AUDUSD 20-Minute Chart Gold Declines 4% To Seven-Week Low! Gold is retracing higher on Tuesday after Monday’s strong bearish decline but continues to remain low. The bullish momentum seen on Tuesday is forming a retracement but is also not indicating a stronger increase. The price action continues to remain relatively weak compared to the previous day's volatility. The decline is due to higher bonds, a strong US Dollar, rate hike expectations and also fear that oil prices will remain around $100. If oil prices remain high and rate hikes expectations continue, Gold prices may fall to the $4,000 psychological price. Another negative indication for Gold is that all metals are currently declining, despite Gold’s small upward retracement. Traders remain concerned about the lack of progress toward a peaceful settlement in the Middle East. The Wall Street Journal reported that the White House rejected Tehran’s proposal to unblock Iranian assets and ports in exchange for restoring traffic through the Strait of Hormuz. Trump later said talks could continue this week. The risk of renewed escalation in the Persian Gulf is raising concerns about further disruptions to oil supplies and prolonged inflation. This could increase expectations for tighter Federal Reserve policy, particularly as officials continue to warn about persistent price pressures. Gold (XAU/USD) - Technical Analysis HFM - Gold 20-Minutes On the 5-minute chart, AUDUSD remains under short-term pressure, with price trading below key moving averages and VWAP. The Bollinger Bands continue to reflect bearish momentum, while RSI remains below 50, indicating sellers still have the upper hand. However, if RSI moves toward oversold territory and price starts recovering above VWAP and the middle Bollinger Band, a short-term rebound could develop. On the 30-minute and 60-minute charts, the broader technical structure remains bearish. Price is still below the main moving averages, while the Bollinger Bands continue to favour the downside. RSI remains below 50 but has not yet reached deeply oversold levels, suggesting further weakness remains possible. RSI entered oversold territory on Monday but has since recovered above that level. A sustained recovery above VWAP and the short-term moving-average cluster would be needed to signal that bearish momentum is starting to weaken. Key Takeaway: The RBA raised interest rates to 4.60%, but concerns over economic growth weighed on the Australian Dollar. A stronger US Dollar and higher bond yields continue to place pressure on AUDUSD, equities and Gold. Gold declined by approximately 4%, reaching an seven-week low as expectations for tighter monetary policy increased. AUDUSD remains technically bearish, with price trading below key moving averages and VWAP. [B]Always trade with strict risk management. Your capital is the single most important aspect of your trading business.[/B] [B]Please note that times displayed based on local time zone and are from time of writing this report.[/B] Click [URL='https://www.hfm.com/hf/en/trading-tools/economic-calendar.html'][B]HERE[/B][/URL] to access the full HFM Economic calendar. Want to learn to trade and analyse the markets? Join our webinars and get analysis and trading ideas combined with better understanding of how markets work. Click [URL='https://www.hfm.com/en/trading-tools/trading-webinars.html'][B]HERE[/B][/URL] to register for FREE! [URL='https://analysis.hfm.com/'][B]Click HERE to READ more Market news.[/B][/URL] [B]Michalis Efthymiou HFMarkets[/B] [B]Disclaimer:[/B] This material is provided as a general marketing communication for information purposes only and does not constitute an independent investment research. Nothing in this communication contains, or should be considered as containing, an investment advice or an investment recommendation or a solicitation for the purpose of buying or selling of any financial instrument. All information provided is gathered from reputable sources and any information containing an indication of past performance is not a guarantee or reliable indicator of future performance. Users acknowledge that any investment in Leveraged Products is characterized by a certain degree of uncertainty and that any investment of this nature involves a high level of risk for which the users are solely responsible and liable. We assume no liability for any loss arising from any investment made based on the information provided in this communication. This communication must not be reproduced or further distributed without our prior written permission.