⤴️-Paid Ad- Check advertising disclaimer here. Add your banner here.🔥
All Activity
- Today
-
 Fundamental Market Analysis for August 3, 2026 EURUSD Event to watch today: 17:00 EET. USD — ISM Manufacturing Index EURUSD: The euro remains supported after the ECB decided to keep its key interest rates unchanged in July. Maintaining the existing policy settings gave the market no reason to expect immediate monetary easing, allowing the single currency to retain some demand. However, the Federal Reserve’s rate remains higher, and the European backdrop alone is not strong enough to generate sustained gains. Only for our readers: mention the one-time promo code GIFT20 in the support chat and get +20% on your next deposit of any amount. The maximum bonus amount is $500. Only one promo code can be applied to a deposit at a time. The main driver of the current session is US dollar weakness following confirmed coordinated operations by the United States and Japan to support the yen. Pressure on the dollar has spread beyond USDJPY: the US Dollar Index remains lower after a notable weekly decline, while the yield on the 10-year US Treasury note has fallen. This combination supports EURUSD despite the interest rate differential remaining in favor of the United States. The market is awaiting US manufacturing activity data, which could alter expectations regarding the Federal Reserve’s next steps. A strong report may restore some demand for the dollar, but until its release, the weakening impulse in the US currency remains dominant. If the current fundamental backdrop persists, the base-case scenario allows for further gains in EURUSD. Trading idea: BUY 1.1530, SL 1.1495, TP 1.1605
 -

Market Technical Analysis by RoboForex
RBFX Support replied to RBFX Support's topic in Technical Analysis
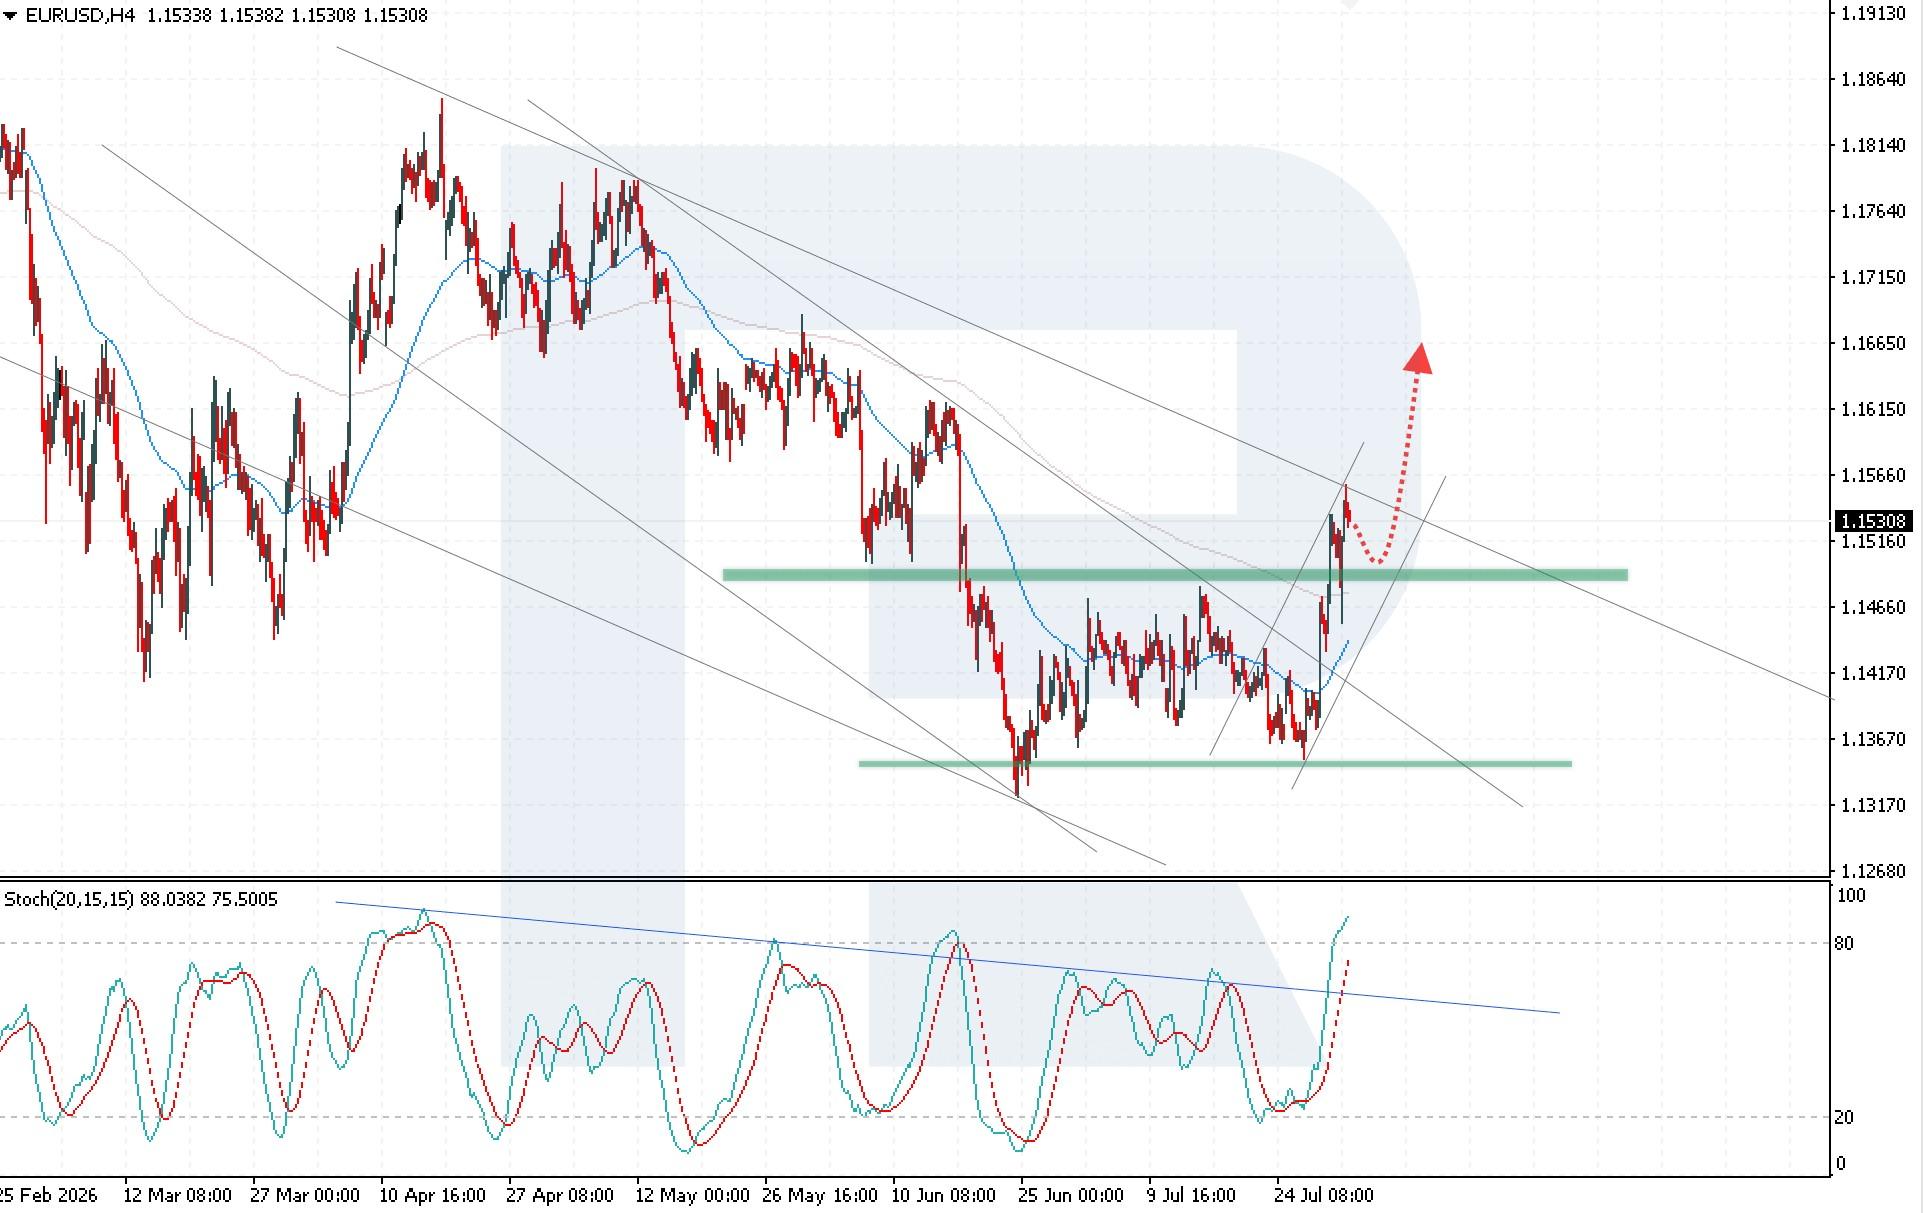
EURUSD strengthens as market rate expectations shift The EURUSD pair is correcting after Friday’s rise but maintains upward momentum thanks to improving eurozone economic indicators. The rate currently stands at 1.1530. Technical outlook The EURUSD pair rebounded from the upper boundary of the descending channel, with buyers gaining a foothold above the EMA-65, indicating continued bullish momentum in the short term. Today’s EURUSD forecast suggests a resumption of the upward move, with a potential target at 1.1665. The EURUSD pair maintains bullish momentum after breaking above the key resistance level and amid an improving fundamental backdrop for the euro. Read more - EURUSD Forecast Attention! Forecasts presented in this section only reflect the author’s private opinion and should not be considered as guidance for trading. RoboForex bears no responsibility for trading results based on trading recommendations described in these analytical reviews. Sincerely, The RoboForex Team
-
roboforex Market Fundamental Analysis by RoboForex
RBFX Support replied to RBFX Support's topic in Fundamental Analysis
Bitcoin awaits the week’s key trigger Easing tensions in the Middle East provided temporary support for BTCUSD, with the price currently hovering at 62,620. BTCUSD forecast: key takeaways Investors have begun to return to riskier asset classes Public companies continue to increase their Bitcoin reserves Improving global risk appetite is supporting the cryptocurrency market Fundamental analysis Today, Bitcoin is trading near 62,620 USD, remaining under pressure after failing to consolidate above the 63,550 USD resistance level. Sellers retain the initiative, while the market has shifted into wait-and-see mode ahead of new macroeconomic drivers. Following the US president’s statement that he was prepared to continue diplomatic contacts with Iran, investors began to return to riskier asset classes. Reduced concerns about further escalation of the conflict dampened demand for safe-haven instruments and supported the cryptocurrency market, including Bitcoin. RoboForex Market Analysis & Forex Forecasts Attention! Forecasts presented in this section only reflect the author’s private opinion and should not be considered as guidance for trading. RoboForex bears no responsibility for trading results based on trading recommendations described in these analytical reviews. Sincerely, The RoboForex Team -
 Minerva reacted to a post in a topic:
Timingsolution & Nifty Updates - 3
Minerva reacted to a post in a topic:
Timingsolution & Nifty Updates - 3
- Last week
-
True many times I paid somebody from iran, 2 times $50 each and I did not recover my crypto from paypal
-
Welcome to Indo-Investasi.com. Please feel free to browse around and get to know the others. If you have any questions please don't hesitate to ask.
-
 zackgray8888 joined the community
 -
 Sujan joined the community
 -
I have the Old Volsignals, I thought it was publish it already here by me, so people will learn option ideas and strategy. If I published it already,know need to post it back, since I got only Google hard drive, and somebody will post it with it. This is a request that somebody is asking me. If I got it wrong then I will find and Post the old course
-
 Earnings season splits major tech stocks Major technology companies reported strong revenue growth, particularly in cloud services, advertising, and digital products. However, the market reaction has been mixed. Some companies have demonstrated that heavy investments are already supporting both revenue and profitability. Others have raised concerns, as rising costs put pressure on future financial stability. Investors are no longer focusing solely on revenue figures. The key question now is how quickly investments in artificial intelligence, data centers, and new infrastructure will pay off. Companies showing clear returns are receiving market support, while high spending without proportional profit growth may increase pressure on stock prices. The final day of the summer 202% deposit bonus from $202 has been extended. Enter the promo code July202 in your client area to participate. Terms apply. Key drivers of U.S. stocks: #Microsoft — Azure revenue grew by 43%, confirming strong returns on large-scale investments #Amazon — AWS sales increased by 37%, strengthening confidence in its investment strategy #Meta (Facebook) — total revenue rose by 28%, but heavy infrastructure spending significantly reduced free cash flow #Google — cloud revenue surged by 82%, though rising costs continue to keep investors cautious #Apple — quarterly revenue increased by 16%; strong sales support the company, but supply constraints may limit future growth These companies reflect different outcomes of the same investment race. #Microsoft and #Amazon appear more resilient due to rapid cloud growth. #Google is also expanding its cloud business but with higher spending. Meta remains more dependent on advertising and has yet to monetize cloud infrastructure. #Apple is less involved in aggressive spending but remains sensitive to supply chain conditions. According to FreshForex analysts, the coming months will depend heavily on earnings quality. The market will continue comparing revenue growth with development costs. The key factor is whether companies can maintain investment momentum without weakening financial stability. Investor appetite for higher-risk assets will also play a role. Even in a positive scenario, managing risk and preparing for changing market conditions remains essential. For those looking to take advantage of market opportunities with a larger deposit, a special promo code July202 (202% from $202) is currently available. More details can be found on the FreshForex website or via support chat. The offer is limited in time. Invest in tech giants Only for our readers: mention the one-time promo code GIFT20 in the support chat and get +20% on your next deposit of any amount. The maximum bonus amount is $500. Only one promo code can be applied to a deposit at a time.
 -

HFMarkets (hfm.com): Market analysis services.
AllForexnews replied to AllForexnews's topic in Fundamental Analysis
Date: 31st July 2026. Japan Intervenes to Boost the Yen. The Japanese government intervened in the currency market for the fourth time this year to strengthen the Japanese Yen. The Yen rose 3.30% against the US Dollar, taking the exchange rate to its lowest level since mid-May. However, the Japanese Yen did not find any support from the Bank of Japan, which chose to keep interest rates at 1.00%. The currency also came under pressure from weaker economic and inflationary data made public yesterday afternoon. Global stocks are rebounding on relief over unchanged interest rates and positive earnings. However, many negative price drivers remain, including bond yields, which are almost at a 20-year high, and expectations of up to three rate hikes this year. USD/JPY The USD/JPY is trading at 160.40 after the Japanese government chose to boost the currency before the BOJ’s rate decision. The intervention took place in two phases, the first at the end of the Japanese session, and another larger intervention before the opening of the US session. It is no secret that the Japanese government is looking to keep the USDJPY exchange rate below 160.00. Before the intervention, the price of USD/JPY was almost at 164.00 and, with no rate adjustment from the BOJ this morning may even have edged closer to 165.00. Any price above 160.00 is at risk of seeing the Japanese government intervene. According to reports, the US government is also in favour of the exchange rate weakening slightly and is assisting Japan in boosting the currency. However, traders should note that interventions are known not to support currencies in the long-term. The Japanese government has taken similar currency operations on three occasions this year and many more since 2022. However, the Japanese Yen has continued to decline. This is due to the Bank of Japan lacking decisiveness over its monetary policy and rate hikes. According to the Bank of Japan Governor, Mr Ueda, the central bank will ‘manage the policy to avoid falling behind the curve’. However, many economists and investors still deem this less hawkish than the Federal Reserve. Many analysts advise that the Japanese government may even continue to intervene further in the upcoming days. Key levels for the Japanese Yen are 159.00, 160.88, 161.69, and 162.94. HFM - USDJPY 30-Minute Chart Always trade with strict risk management. Your capital is the single most important aspect of your trading business. Please note that times displayed based on local time zone and are from time of writing this report. Click HERE to access the full HFM Economic calendar. Want to learn to trade and analyse the markets? Join our webinars and get analysis and trading ideas combined with better understanding of how markets work. Click HERE to register for FREE! Click HERE to READ more Market news. Michalis Efthymiou HFMarkets Disclaimer: This material is provided as a general marketing communication for information purposes only and does not constitute an independent investment research. Nothing in this communication contains, or should be considered as containing, an investment advice or an investment recommendation or a solicitation for the purpose of buying or selling of any financial instrument. All information provided is gathered from reputable sources and any information containing an indication of past performance is not a guarantee or reliable indicator of future performance. Users acknowledge that any investment in Leveraged Products is characterized by a certain degree of uncertainty and that any investment of this nature involves a high level of risk for which the users are solely responsible and liable. We assume no liability for any loss arising from any investment made based on the information provided in this communication. This communication must not be reproduced or further distributed without our prior written permission. -
Market Technical Analysis by RoboForex
RBFX Support replied to RBFX Support's topic in Technical Analysis
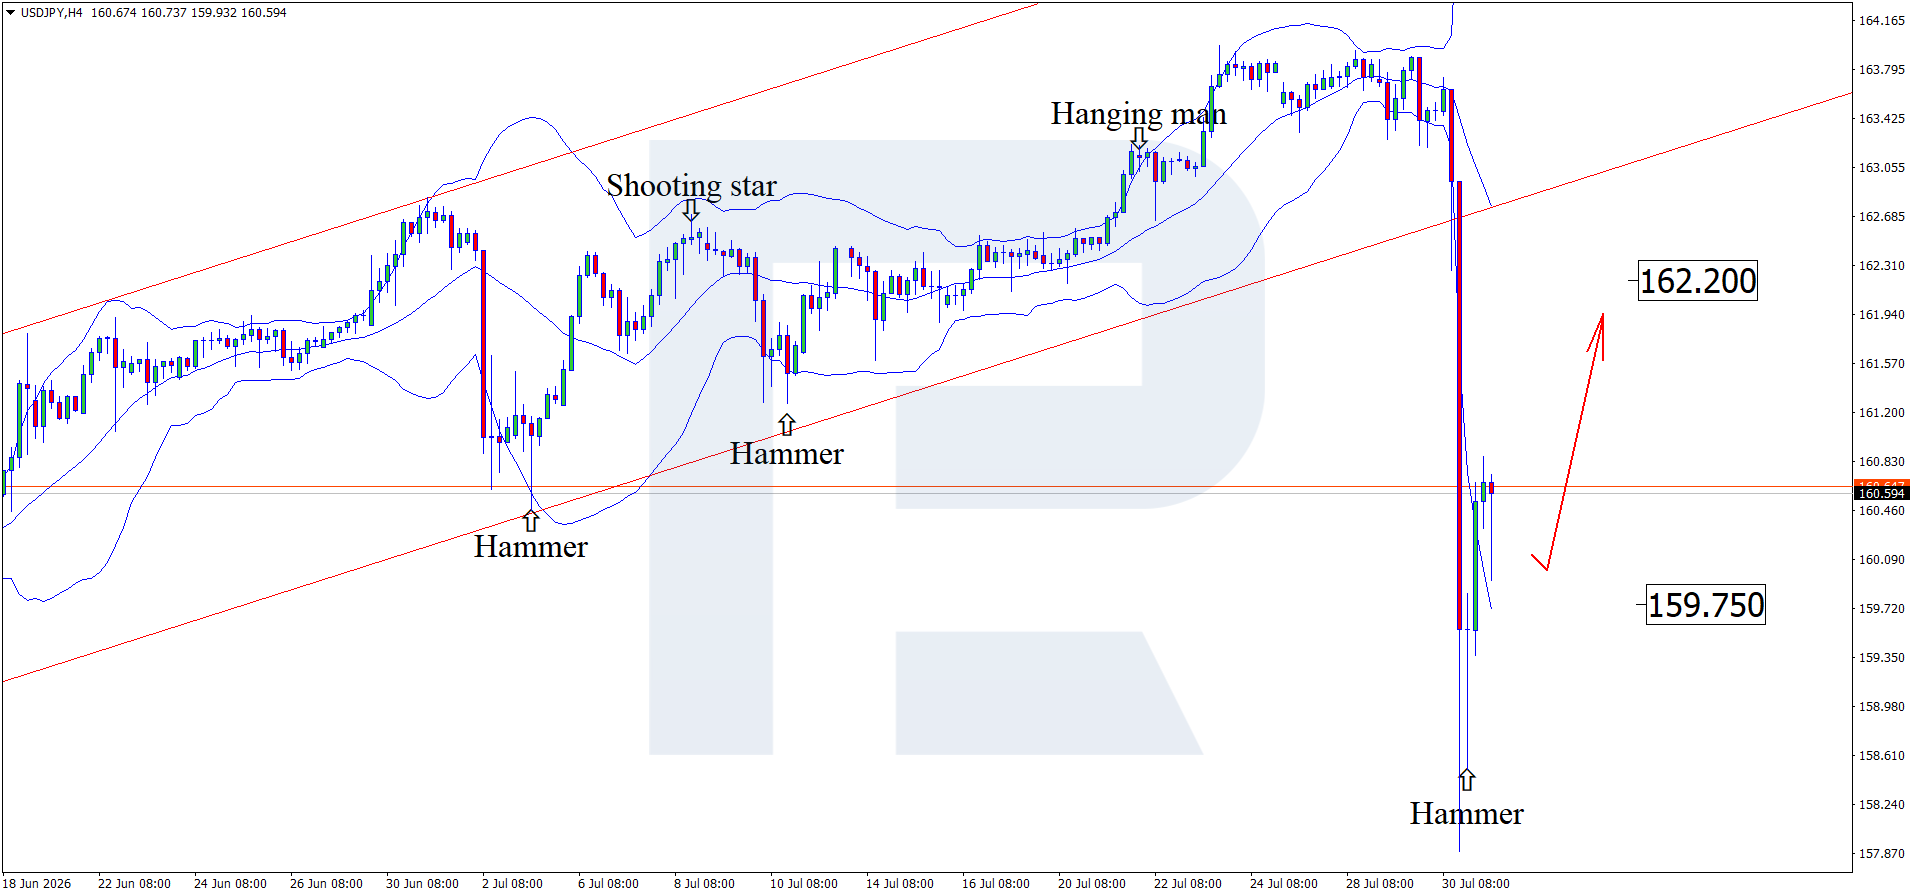
Intervention fails to save the yen: USDJPY prepares for another surge The USDJPY rate continues to rise despite government efforts to strengthen the yen, with the price currently at 160.30. Technical outlook On the H4 chart, the USDJPY pair formed a Hammer reversal pattern near the lower Bollinger Band and is trading around 160.30. Since the price has broken out of the ascending channel, it may form an upward wave following the pattern’s signal and return to the channel, with the first upside target at 162.20. Another attempt by the Japanese government to strengthen the yen proved temporary, with the USDJPY rate resuming its upward trajectory after a sharp decline. Read more - USDJPY Forecast Attention! Forecasts presented in this section only reflect the author’s private opinion and should not be considered as guidance for trading. RoboForex bears no responsibility for trading results based on trading recommendations described in these analytical reviews. Sincerely, The RoboForex Team
-
roboforex Market Fundamental Analysis by RoboForex
RBFX Support replied to RBFX Support's topic in Fundamental Analysis
US Tech forecast: the index enters a downtrend The US Tech index has fallen 12% from its all-time high and continues to decline. The US Tech forecast for next week is negative. US Tech forecast: key takeaways Recent data: the US Federal Reserve kept the interest rate at 3.75% Market impact: the current data is negative for the technology sector Fundamental analysis The Federal Reserve’s decision to hold interest rates steady within the 3.50–3.75% range is moderately favourable for the US Tech index, as the regulator did not raise borrowing costs further. However, the accompanying statements by the Fed chairman significantly weaken the positive effect of keeping the rate unchanged. This is particularly important for the US Tech index. A significant share of its market capitalisation consists of companies whose valuations depend on expectations of high future profits. RoboForex Market Analysis & Forex Forecasts Attention! Forecasts presented in this section only reflect the author’s private opinion and should not be considered as guidance for trading. RoboForex bears no responsibility for trading results based on trading recommendations described in these analytical reviews. Sincerely, The RoboForex Team -
Market Fundamental Analysis for July 31, 2026 USDJPY USDJPY: The Bank of Japan kept its short-term interest rate unchanged at 1%, providing the market with no new reason for a sustained strengthening of the yen. One board member supported a rate increase, while the central bank maintained the possibility of further action if inflation risks intensify. However, the decision to leave the rate unchanged supported a recovery in USDJPY after the sharp decline during the previous session. Only for our readers: mention the one-time promo code GIFT20 in the support chat and get +20% on your next deposit of any amount. The maximum bonus amount is $500. Only one promo code can be applied to a deposit at a time. The interest rate differential remains the main factor supporting the dollar. The Federal Reserve’s rate stands within the 3.50–3.75% range, while the yield on the 10-year US Treasury remains above 4.6%. Under these conditions, interest rate differential trades remain attractive, while the absence of immediate tightening by the Bank of Japan limits demand for the yen. The main risk to the USDJPY buying scenario remains confirmed action by the Japanese authorities in the foreign exchange market and the possibility of renewed intervention if the yen weakens again. This factor could trigger a sharp reversal, meaning that the pair’s upside potential is not one-sided. Nevertheless, following the Bank of Japan’s decision, the current fundamental momentum continues to favor a further recovery in USDJPY. Trading idea: BUY 160.80, SL 160.25, TP 161.90
-
 JBente joined the community
 -
Welcome to Indo-Investasi.com. Please feel free to browse around and get to know the others. If you have any questions please don't hesitate to ask.
-
 sportsmanrahul joined the community
 -
 hb5590 joined the community
 -
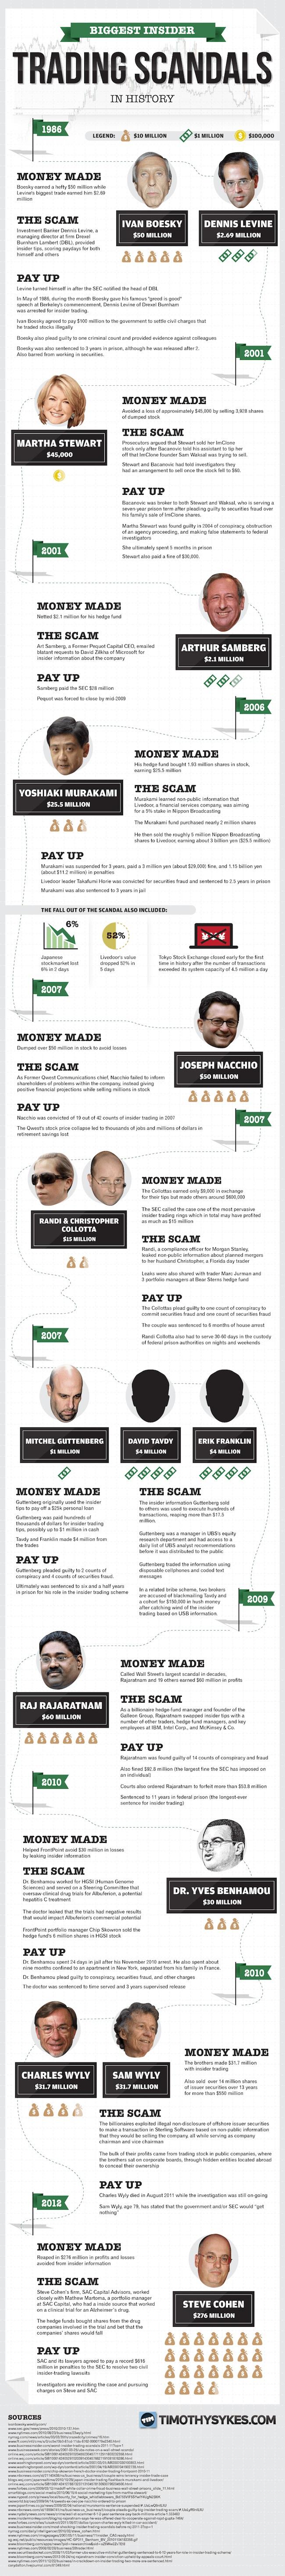
 I found this list in my archives; unfortunately, it’s not up to date, but it gives a good idea of how the family of “gentlemen” is particularly… large… and… diverse (see attachment: Trading Scandals): Here are two more recent examples: Jim Cramer’s "One Of The Great Ones" Who Did $1+ Million In Newsletter Sales For TheStreet.com Lenny Dykstra — Indicted for 2 Dozen Alleged Crimes: https://www.timothysykes.com/blog/jim-cramers-one-of-the-great-ones-who-did-1-million-in-newsletter-sales/ ------------------------------------------------ Justin Bieber’s Penny Stock Pump: The Latest Celebrity To Fall Prey To A Failing Company With Paid Promoters, 50+ Financings In 2 Years, Just $97k In Cash, Sales Dropping 48% & $10 Million In Annual Losses: https://www.timothysykes.com/blog/justin-biebers-penny-stock-pump-dump-the-latest-celebrity-to-fall-prey-to-a-failing-company-with-paid-promoters-50-financings-in-2-years-just-97k-in-cash-sales-dropping-48-10-million-in-annua-2/
-
HFMarkets (hfm.com): Market analysis services.
AllForexnews replied to AllForexnews's topic in Fundamental Analysis
Date: 30th July 2026. Hawkish Fed Talk, Iran Tensions, and Mixed Tech Earnings Pressure Markets. The Federal Reserve opts for a hawkish pause, with the chairman, Kevin Warsh, warning markets about rising inflation. Simultaneously, the US continues to strike Iranian targets, sending oil prices higher for a second day and adding to inflation fears. As a result, the stock market continues to decline, the US Dollar took a dive but is now recovering, and Gold continues to experience swings in both directions. The stock market’s first reaction to the Federal Reserve’s decision was positive, as 36% of the market had previously been expecting a rate cut. However, US indices were quick to fall back lower as the chairman’s hawkish tone hit investor sentiment. Microsoft Earnings Saves The NASDAQ From Larger Declines The NASDAQ has fallen to its lowest level since 29 April as investors price in higher inflation, rate hikes, and mixed earnings reports. During the early hours of this morning’s Asian session, the NASDAQ rose upwards after finding some support from positive earnings reports. Microsoft stock saw a significant rise after market close due to its stronger-than-expected quarterly earnings report for the second quarter. After the report was made public, the stock rose 8.90%, a much-needed boost for a stock that was trading at a 17% loss. According to analysts, without the boost from Microsoft’s positive earnings report, the NASDAQ would likely be trading below 27,000 points. Microsoft’s revenue reached $90 billion, up 18% year over year and above Wall Street’s expectation of approximately $87 billion. Earnings were $4.74 per share, comfortably beating the expected $4.24. Furthermore, Azure and cloud services revenue grew 43%, exceeding the roughly 40% growth analysts expected. Azure also generated more than $100 billion in annual revenue for the first time. Meta, on the other hand, saw a significant decline after making its own report public. Analysts had feared that Meta’s aggressive AI expansion and rising investment costs could weigh on its results. This fear indeed was proven through the latest quarterly report. Free cash flow collapsed by 91%, falling to just $784 million, as spending on data centres, chips, and other AI infrastructure increased sharply. In addition to this, Meta reported earnings of $6.18 per share, below analysts’ estimate of around $7.20. HFM - NASDAQ 2-Hour The price of the index retraced upwards but is seeing another bearish swing. However, sell indications may not be seen until the price falls to $27,240.00. On larger timeframes, the indications remain in favour of a bearish sentiment. The main concern for investors remains higher interest rates, trade tariffs, and rising inflation. Gold - A Hawkish Fed Keeps the Pressure on Gold The price of Gold rose in response to the Federal Reserve’s pause. However, concerns remain, and bearish signals remain in place. The US Dollar Index fell 0.74% after the announcement and formed a bearish breakout. However, Gold’s upward price movement formed no breakout, and the momentum did not follow the traditional correlation magnitude. For this reason, indications remain in favour of a range-bound condition with a bearish sentiment. The US 10-year treasury yield rose to 4.70%, up 78 points, and the US Dollar index is again on the rise. Currently, the US Dollar is the best-performing currency of the day. This applies further pressure on Gold, particularly if the Dollar Index again rises above 101.00. Most metals are trading lower this morning, but Silver is particularly trading with a large decline. If Gold prices fall below $4,034.65, sell signals are likely to strengthen, while the support level can be seen at $4,010.00. HFM - Gold 1-Hour Chart USDJPY - The US Dollar Rises After a Sharp Fall on Wednesday The worst-performing currency of the Asian session is the Japanese Yen while the best performing is the US Dollar. The US Dollar continues to remain under the influence of last night’s press conference. Chairman Kevin Warsh told markets that the committee has no soft inflation target and that many members support his position. Three members of the FOMC voted to hike interest rates, while nine voted for a pause. However, almost 70% of the market believes the Federal Reserve will hike in September. Previously, a hike in September was deemed a 50/50 possibility. This morning’s oil prices rose to a weekly high, also adding further pressure on the Federal Reserve to start hiking. This afternoon, the US will release its Core PCE Price Index and advance Gross Domestic Product. If these reports exceed expectations, they will likely support the US Dollar, especially if the PCE Price Index comes in higher than expected. In addition to this, the Bank of Japan will also announce its rate decision tomorrow. If the central bank does not hike or convince markets that it can keep up with the global adjustments and inflation, the USD/JPY could potentially rise to 165.00. Key Takeaways: The Federal Reserve’s hawkish pause increased concerns about persistent inflation and raised expectations of future interest rate hikes. Microsoft’s stronger-than-expected earnings gave the NASDAQ important support and helped prevent an even larger decline. Meta shares fell sharply after weak earnings and heavy AI spending caused free cash flow to drop significantly. Rising oil prices added to inflation concerns, putting further pressure on global stock markets and investor sentiment. The US Dollar recovered after an initial decline, while Gold remained volatile and continued to face bearish pressure. Always trade with strict risk management. Your capital is the single most important aspect of your trading business. Please note that times displayed based on local time zone and are from time of writing this report. Click HERE to access the full HFM Economic calendar. Want to learn to trade and analyse the markets? Join our webinars and get analysis and trading ideas combined with better understanding of how markets work. Click HERE to register for FREE! Click HERE to READ more Market news. Michalis Efthymiou HFMarkets Disclaimer: This material is provided as a general marketing communication for information purposes only and does not constitute an independent investment research. Nothing in this communication contains, or should be considered as containing, an investment advice or an investment recommendation or a solicitation for the purpose of buying or selling of any financial instrument. All information provided is gathered from reputable sources and any information containing an indication of past performance is not a guarantee or reliable indicator of future performance. Users acknowledge that any investment in Leveraged Products is characterized by a certain degree of uncertainty and that any investment of this nature involves a high level of risk for which the users are solely responsible and liable. We assume no liability for any loss arising from any investment made based on the information provided in this communication. This communication must not be reproduced or further distributed without our prior written permission. -
 MDT joined the community
 -
Market Technical Analysis by RoboForex
RBFX Support replied to RBFX Support's topic in Technical Analysis
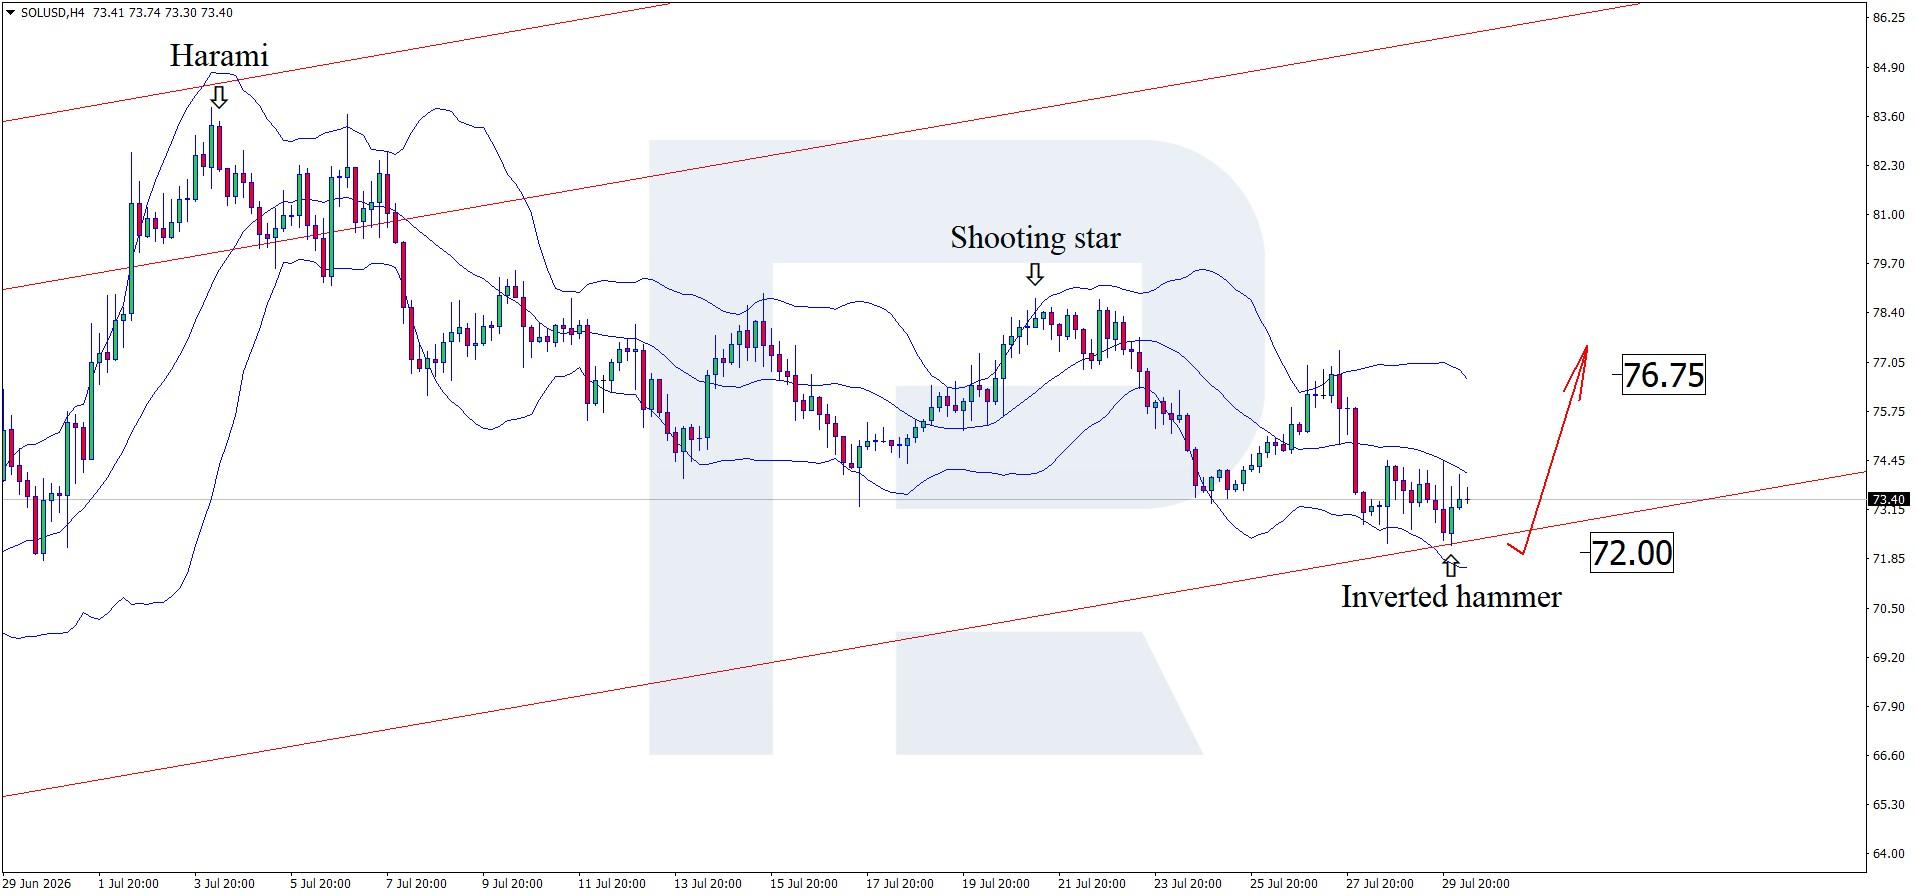
Solana boosts network capacity by 66%: market awaits SOLUSD reaction The SIMD-0286 upgrade increased the maximum computing capacity by 66%, but the Solana price continues to correct, currently standing at 73.20. Technical outlook On the H4 chart, the SOLUSD price formed an Inverted Hammer reversal pattern near the lower Bollinger Band. At this stage, the price may develop an upward wave following the pattern signal, with the upside target at the 76.75 resistance level. The Federal Reserve’s tight monetary policy continues to weigh on SOLUSD despite the successful network upgrade. Read more - SOLUSD Forecast Attention! Forecasts presented in this section only reflect the author’s private opinion and should not be considered as guidance for trading. RoboForex bears no responsibility for trading results based on trading recommendations described in these analytical reviews. Sincerely, The RoboForex Team
-
roboforex Market Fundamental Analysis by RoboForex
RBFX Support replied to RBFX Support's topic in Fundamental Analysis
JP 225 forecast: decline from the high reaches 18% The JP 225 stock index has hit a new six-month low within the downtrend and is now attempting to establish support. The JP 225 forecast for today is negative. JP 225 forecast: key takeaways Recent data: Japan’s core inflation rate rose by 1.6% in June Market impact: the effect on the Japanese stock market is mixed Fundamental analysis The increase in Japan’s core consumer price index from 1.4% to 1.6% year-on-year indicates a slight increase in inflationary pressure. However, the actual reading fully matched the market forecast and remained below the Bank of Japan’s 2% target for the fifth consecutive month. For the JP 225 index, the news is mainly neutral or moderately negative. On the one hand, accelerating inflation confirms that price pressure in the Japanese economy has not disappeared completely. RoboForex Market Analysis & Forex Forecasts Attention! Forecasts presented in this section only reflect the author’s private opinion and should not be considered as guidance for trading. RoboForex bears no responsibility for trading results based on trading recommendations described in these analytical reviews. Sincerely, The RoboForex Team -
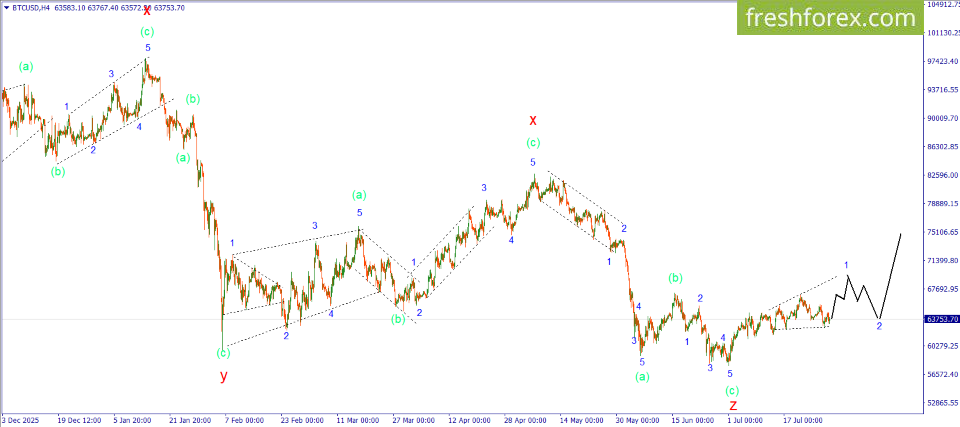
Elliott wave analysis of the market for July 30, 2026 BTCUSD BTCUSD: BUY 64100, SL 62900, TP 68900 There were no significant developments in Bitcoin during the previous trading session. The price continued to trade confidently within the expanding range, remaining near its lower boundary. Only for our readers: mention the one-time promo code MR20 in the support chat and get +20% on your next deposit of any amount. The maximum bonus amount is $500. Only one promo code can be applied to a deposit at a time. As a result, the previously discussed bullish outlook remains unchanged. The expected rally is still likely to be driven by the development of the final fifth wave of the leading diagonal. The completion of this move would also mark the end of Wave 1, after which a corrective pullback is expected to develop, most likely in the form of a simple zigzag. Under these conditions, the current market environment continues to favor long positions. Investment idea: BUY 64100, SL 62900, TP 68900.
-
 Jordan joined the community
 -
 sunnylove joined the community
 -
Welcome to Indo-Investasi.com. Please feel free to browse around and get to know the others. If you have any questions please don't hesitate to ask.
-
 mavidelisi joined the community
 -
The calm before the storm: Crypto is preparing for its next move As of July 29, 2026, the cryptocurrency market remains in wait-and-see mode ahead of today’s Federal Reserve decision. BTCUSD is trading around $63,700, ETHUSD near $1,900, and SOLUSD at approximately $73. Open interest continues to rise while funding rates remain neutral, suggesting that traders are building positions without committing to a clear market direction. Meanwhile, the Bitcoin Volatility Index (BVIV) has fallen into the 34–38% range — a level that has historically preceded significant price moves. The longer the market stays quiet, the stronger the eventual breakout could be. Our Summer 202% Drawdown Bonus on deposits of $202 or more has been extended!. Enter the promo code July202 in your Client Area and claim your bonus! BTCUSD: Institutional investors remain cautious. Demand for spot Bitcoin ETFs remains inconsistent. Strong inflows recorded on July 20–22 were followed by outflows on July 23–24, while net outflows narrowed to $11.6 million on July 27. Although selling pressure has eased, there is still no clear sign of sustained institutional buying. ETHUSD: Strong technology, weak demand. Ethereum continues to underperform Bitcoin. After $70.7 million in ETF outflows on July 24, funds attracted only $11.7 million on July 27, indicating that investors are returning cautiously. The Fusaka network upgrade launched in May has significantly improved Ethereum’s scalability, but stronger technology alone has not yet been enough to offset the market’s limited appetite for risk. SOLUSD: Risk appetite remains the key driver. Solana continues to attract institutional interest, with cumulative inflows into SOL ETFs reaching $1.14 billion. However, only $1 million of new inflows was recorded on July 27, highlighting the market’s cautious stance. Historically, Solana tends to react more aggressively to changes in investor sentiment, making Bitcoin’s next move a key factor for SOLUSD. What could move the market? Today’s Federal Reserve interest rate decision is expected to be the main catalyst for cryptocurrency markets. Investors are split between expectations of unchanged rates and the possibility of a more hawkish policy stance. However, the accompanying statement may prove even more important than the decision itself, as it will influence both the U.S. dollar and Treasury yields. A more dovish tone could support Bitcoin (BTCUSD) and lift Ethereum (ETHUSD) and Solana (SOLUSD) alongside it. Conversely, a hawkish message or a stronger U.S. dollar could trigger another wave of selling across the crypto market. According to FreshForex analysts, today’s calm should not be mistaken for inactivity — it may simply be the market preparing for its next major move. Experienced traders know that periods of low volatility often create the foundation for the strongest trends. Only for our readers: mention the one-time promo code GIFT20 in the support chat and get +20% on your next deposit of any amount. The maximum bonus amount is $500. Only one promo code can be applied to a deposit at a time If you want to be ready when volatility returns, now is the perfect time to strengthen your trading account. Use the promo code July202 to receive a 202% Drawdown Bonus on deposits of $202 or more.