

⤴️-Paid Ad- Check advertising disclaimer here. Add your banner here.🔥

osijek1289
-
Posts
246 -
Joined
-
Last visited
-
Days Won
2
Content Type
Profiles
Forums
Articles
Posts posted by osijek1289
-
-
1 hour ago, V1s said:
@osijek1289 do you know how to use this with AMP? I'm not sure what it means "1. For AMP please use any key that starts with @AMP"
I have this NT8 running but I don't find any key that starts with @AMP.
How can we trade live with AMPI didn't post about the Profitwalla version, but I did try that NT version with whatever default key it comes with, and a CQG live account connection to Amp was established. The @AMP key reference from those instructions is from years ago, when that was the requirement, based on the then Ninjatrader requirements. And it was likely at the time when new users who establish Amp as their brokerage, were allowed to choose NT as their charting package to trade with. But today, Amp does not offer NT any longer, because NT Corp does not allow them to, ever since they created their own brokerage. So, any default key should work, and you will be able to trade a live account you have at Amp. Here's the (default) one I use:

- V1s and ⭐ SignalTime
-
 1
1
-
 1
1
-
1 hour ago, XandarT said:
I’m currently developing two projects that are nearing completion, which is why I’ve started this third project: an MBO suite (along with some other L2/L1 indicators). If you can bear with me for a bit, I'll be able to offer you a very solid alternative."
Well this is epic!
-
7 hours ago, epictetus said:
@epictetus What version of non-Edu NT are you using? In 8.1.5.2 the DLLs will not load, and give a few errors.
-
18 hours ago, N9T said:
Can try on regular NT 8.1.5.2?
I know it's annoying uninstall and install different NT versions on same PC
Enable virtualization in your BIOS, and install Oracle Virtualbox. It will allow you to run a completely sandboxed copy of Windows, from within your main windows. That way, you have a master copy of NT installed on your PC that is part of your production and regular use environment, and you can have and create as many separate instances of other Windows sessions, into which you can have different copies of Windows installed, running whichever version of NT you want. Using a Windows 10 edition already made light and customized is the best way to go. https://t.me/software_application/1452 should lead to a file called "Win10 LiteOS 21H2 Pro Gamer19044.1387.iso" which you can use as the install source for your new VirtualBox Windows 10 session(s).
-
46 minutes ago, pygmalion5000 said:
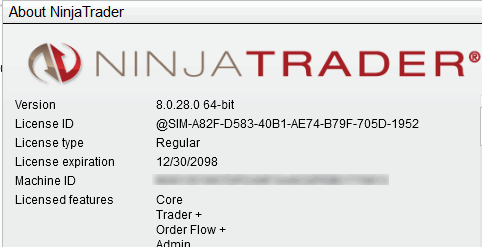
Using 8.0.28.0 cracked.
When opening indicator windows, Ninjatrader crashesEven if it didn't crash as it loaded up in v8.0.28, it won't work, because it uses newer C#8 coding and syntax not available in the then existing C#5 ninjascript. It just takes 1 line of code, and the whole indicator will not work. It's a shame the NT programmers did this, to save all of a few lines of code. That aside, they specifically say 8.1.5 is required: https://bestorderflow.com/userguide/install/clean-nt8
-
41 minutes ago, RichardGere said:
The profitwala version runs much faster. The unknown version took much longer to load charts or bring up the menus.
I could immediately feel the difference in speed.
I timed the loading of the FLD indicator. Profitwala version took 8 seconds to load. The unknown educator version took 35 seconds.
This is super interesting, and consequential - thanks for taking the time to check this out. I might see if I can get similar results. A big downside though, is that the profitwala version can't connect to Tradovate.
-
8 hours ago, marie said:
Please any one have a ninjatrader 8 that works
8.0.28 is available via this link. It works completely fine for connecting to a live broker, can handle at least 1 Rithmic connection, and multiple Tradovate, CQG and most other available NT connections. It has full orderflow capability enabled. It's not the latest version, but is MultiPC, meaning you don't need a license, and it's not tied to any one hardware ID. Few people need the newer/newest copies of NT, unless a specific indicator uses some of the modified scripting they've introduced.
-
35 minutes ago, mmicro said:
but they don't use ninja, you would need tradescyncer to copy to them from another account.
They give you credentials to for the "Rithmic Paper Trade" server, which you can connect directly to from v8.0.28 "opened" NT8 found in the thread below.
They offer prop "$25K" prop accounts for as little as $59 initially, then $29/month to extend, where you need to make ~$2000, but in ~$167 daily amounts, which takes 12 days, without any losing days. You're getting a proper Rithmic L2 datafeed on all the CME exchanges, and you can trade your way to some money.
-
Yes, NT 8.0.28-Multi-PC connects fine. They can and will enable L2 on all exchanges.
-
-
5 hours ago, BeingSimple said:
Iam looking for OrderFlow solution for MT4 or MT5 as I currently use MT4/MT5 for trading these pairs...
The definition of the word "Orderflow" includes and implies buyers and sellers. That can be pulled from a datafeed that has level 2 buying and selling quantity, and is displayed in a cumulative delta indicator, footprint chart or DOM. MT4 & MT5 datafeeds don't have that ability: they just stream the price, time & volume and plot it on your chart. The volume you are streamed contains no information about the buys or sells or who the aggressor is.
Also, to have a proper view of orderflow, it needs to be a centralized exchange, meaning, exactly one exchange that all the transactions flow through - that's why having the CME/Nymex/Comex to show orderflow of ES/CL/GC works to show a complete picture of all the buying or selling. Forex transactions do not occur on a centralized exchange: there are banks and datafeeds that show a good amount of transactions that they do, but there are clearing houses and exchanges all over the major financial centers of the world, and there's no good way to have a complete picture of how much EURUSD was bought or sold at a specific price. (There are datafeeds that bring various major bank's forex data into one feed, but this gets costly, and, displaying very large actual dollar transactional volume at every pip becomes unfeasible, and generally isn't practical.)
-
17 hours ago, tdktown said:
I thought TFD Rithmic doesn't connect to NT. Does this version allow it to?
The NT 8.0.28 Multi-PC version allows a Rithmic connection to the Rithmic Paper Servers, which is what TFD uses. But, if it is a dedicated node Rithmic server, those are not in the list built in to NT, and one cannot connect.
10 hours ago, roddizon1978 said:I think what he is saying is that you are not a true trader, why get it when you don't trade anyway. I am not putting you down, I am saying the facts that you cannot afford to trade, right now because you need a little money to do it. Why not start with MT4, and build your funds .
MT4 is definitely a good option to start, to learn and employ the basics of trading. But NT allows for better and proper charting, along with the benefit of maybe using actual transaction volumes, DOM, footprint, large trades, and other things that proper datafeeds allow for. And they are expensive as a monthly fee, so free or close to free can be a good cost savings. It should also be possible to get trial Rithmic and CQG datafeeds that last 14 or 30 days, and then when requesting it again, use a (free) VPN to have it originate from a different IP address, and use a temporary email where they send you your ID & password.
-
There's a decent library of indicators on google drive, here:
-
9 hours ago, laser1000it said:
Thanks for the share, but if he doesn't have the money to buy NT lifetime and the RT data provider and he's not able to reset the PC after the Rithmic demo is over, he doesn't need it.
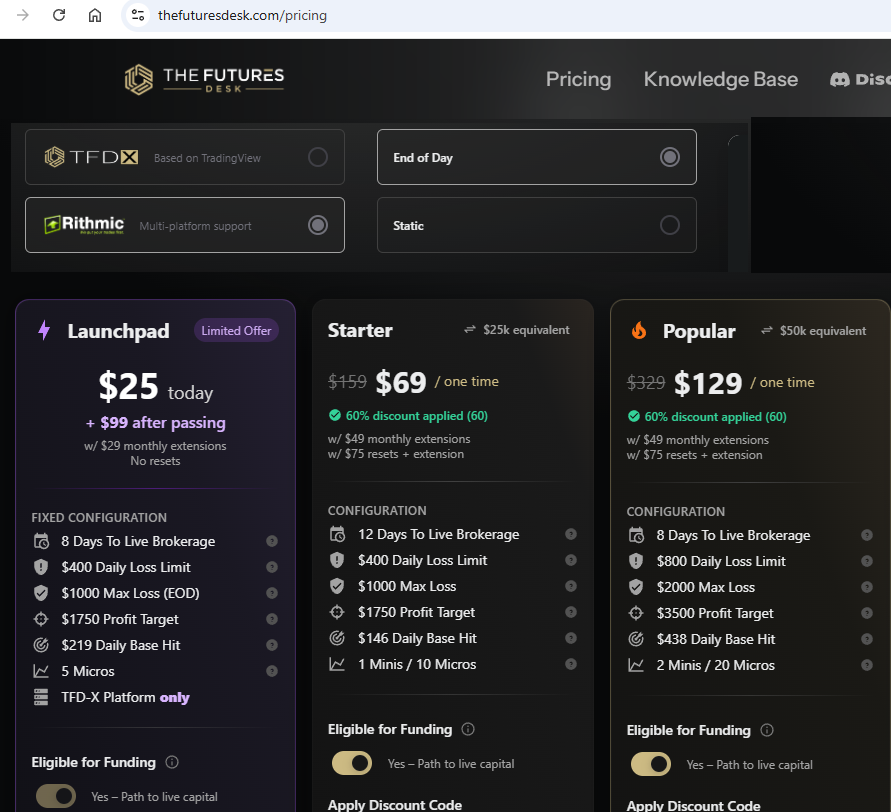
Using a minimal cost prop trading provider could be an option. And it can serve as an incentive to try and get some form of funded account. There are some very cost effective options out there. Oneuptrader had a $19/month special with a Rithmic datafeed and L2 enabled. (The 'sale' is no longer on.) They call it a $25K account, one can trade up for 30 micros, and try to attain $1500 profit. Another currently cheap option is TheFuturesDesk offering a similar account for $25/month, and then $29/month extensions. They too offer 'free' L2 Rithmic. I'm only offering these as alternatives to paying for a monthly L2 datafeed, with I believe are all over $60.
I used to use CQG free trials, constantly renewing them biweekly or monthly, by going to a landing page like this, under a VPN that changed the location they saw I was applying for, and then use different names & email addresses, and you should be able to constantly renew. https://www.ampfutures.com/why-amp/cqg-data-quality
Here's that current $25/$29 offer from TheFuturesDesk:
-
8.0.28 MultiPC with Orderflow is available here:
- ivan2007007, Kmail and ⭐ goldeneagle1
-
2
-
1
-
1 hour ago, Koroni said:
Ive tried to log into Ninjatrader, Rithmic, etc with my current ninjatrader username password and i also have subscribed data and its just says wrong log in etc
You have said you are "subscribed to data" and you have called it "live data" but it's unclear which brand or who you bought it from? From Ninjatrader directly? If so, did they not specify how to connect it, meaning, which option to use among all the "Connection adapters" ? Is it live Tradovate data? Ninjatrader will give a live data 2 week demo, but after that, unless you have a brokerage account with them, they will not sell you a data subscription package. Are you paying for a datafeed? But, if you have one of the brands listed under connections of the 8.0.28 version provided in this thread, they will work. Some of that detail from Ninjatrader is found here:
-
-
-
can you run two ninjatrader at the same time, my goal is to run 32bit and 64bit at the same time.
Best is to install Oracle VM virtualBox. You can run a copy in each session you launch.
-
BTW, you can get a lot of the bookmap-like funcionality, basically for free in Sierra Charts. If you have a real trading account, a 2nd login ID is usually +$10/month, so you can run NT and SC together. http://www.tradergav.com/sierra-chart-book-sharing-market-depth-historical-graph/
-
Do you've verified MT4 data? it seems that its not right.
I'm not exactly sure what you're saying ... I think it's that you don't trust or know of a good source of MT4 data? It really depends on the broker. And, historically what is stored within MT4 is 1 minute data, simply showing the high/low/close/open. BUT, since the realtime gyrations flow in (but are not saved or recorded by MT4), if DDE is used to read it into ninja, then ninja will have close to tick resolution.
Overall IMHO none of this is really worth it (I have tried) and in the end, one ends up using lots and lots of time to not only set up, but maintain (since it 'breaks' quite often), that it is better to save all that time, and put it to use to learn the markets and price action - people too often seem to forget they are in this to try and make money, not spend their time creating convoluted solutions.
- ⭐ laser1000it and bassmark
-
2
-
There was a fellow who had developed a DDE bridge to feed data from MT4 to NT. I believe it was over on the actual ninjatrader support forums that you'd be able to find it, searching using 'MT4'It's possible? -
... I think both methods, gomrecorder and recording to ninjatickfile within ninjatrader use quite some system performance, unfortunally).
Actually, they are extremely and highly efficient recording and storage/recall methodologies that are used (to create/read the gom files) - impact to system performance from having various gom footprint charts running is imperceptible. The performance hit caused by too many indicators, which can be poorly written sometimes too, or running against tick charts, etc - can cause a far bigger system performance issue. This is experience from when I had a amdx4 955. As an aside, anyone seeking the best performance increase (based on $$ spent) should really have an SSD that at least Ninja runs off; 120GB SSDs can easily be found I assume world over for <$100, and you can easily put your OS and have room left over, while your harddisks are reserved for space hogging programs that do not require access speed.
-
D over at OFA will tell you that the way non-OFA packages are and have been doing it, is completely wrong - I believe the most recent video on his youtube channel within the 1st 20min gets into the 'ludicruosness' of this,with him referring to it as something that children can determine as being wrong. (The reference to a diagonal mismatch of buyers and sellers and other's volume footprint charts). But, the premise remains that buyers lift the price and sellers push it down; in a instrument like CL where 1 cent increments don't mean an awful lot (to the big players who will accumulate as selling pushes price down, and also do the opposite), I do not believe this makes a huge difference to the prices at each and every 1 cent price level. Instead, it is key to try and determine which range is seeing accumulation and distribution, and then when it stops as it comes to key levels of previous chart supply/demand, POCs, fibs (current day and previous day's), along with other things on that chart (and sometimes in other instruments as real time price and events/news unfold).Can anyone put some light on feature advantage which OFA has over Gom Ladders, i am literally confused on which one to choose. Since the learning curve is too time consuming i dont want to make a wrong choice and then switch later on after having lost all the time and effort.Any seniors who have used both may pls guide me.
Thanx!!!!
I have recently started using OFA and having watched some/many of the videos, I am starting to see that there's been some cherry picking of scenarios involved. It's important to note that the behaviour of CL ES TF GC can all be very very different when it comes to viewing them in anyone's volume footprint or orderflow charts: divergences can be extremely different, the range that price will retrace can be very different,and overall intent can take much much longer to play out in some of these instruments, causing incredible doubt and inevitable grief to a retail trader's psychology and often to their account balance (by running stops, ie., which will be FAR wider in GC and CL than say ES -and the actual $$$ it will cost you - this has to do with liquidity differences but also inherent price behavious differences). Personally, there is FAR too little attention paid to the differences in these in these instruments price action and behaviours by the majority of people, which, is why indicator's arrows/signals to buy or sell at a single point simply do not work *consistently* - in trading, there is no such thing as a 'one size fits all' (instruments) approach.
Having now used OFA for a few days, the blue and red momentum dots in something like CL can be very dubious, if one is simply looking to them. They work a little better and more consistently it seems in ES, but that seems to be mostly because it's gone straight up for 8/9 days since the 1730 bottom, now getting into back into the 1830's. I wont be able to give a better assessment of it until I have seen many more weeks of the market's price action.
I have been using the gom indicators for years now. I like them better. A lot of that is because I have become used to the system and patterns and general 'ongoings' of price in instruments like oil. As I mentioned, in comparison to OFA, it will still show accumulation/distribution buyers/sellers initiating, over a range, which can easily be 50cents.
There are 2 ways to collect the data from gom: an 'estimation' methodology (because ninja does not store the up and down tick data, so to plot a historical chart needs to use this method) but part of gom is that if your PC is running and receiving a realtime data feed, it actually records this very relevant data (to exactly determine if it is the buyer or seller that initiated that tick) and it then stores that data in an incredibly efficient file, so that when you request historical data against that instrument, your buy/sell data is 100% accurate. Thus, if you have a completely unfiltered data feed (IB for example is terrible data), you will have completely accurate historical buy/sell data stored within your NT, by way of the proprietary gom data files. The down side to this of course is that to capture this data, your PC and Ninja needs to be running and receiving this data for all the periods you want it for, ie., running 5 days a week, 24 hours a day, or, during the time period your instrument trades. (if your ISP charges you for data overages beyond a set gigabyte amount, this can be a problem {towards your monthly ISP bill} or, if your data connection drops more often, ninja doesn't always reconnect as it should, so you wake up and see that you may be missing hours of gom data. The positive flipside here is that you can run the replay {after 5pm est, and a 16x speed or more, to re-collect or 'fill in' those data gaps})
If using OFA within Ninja, I believe it uses the estimation methodology I mentioned UNLESS one has IQ/Feed as your data provider, since it is one of the only/few data providers that will send historical data with the up/down tick information. (Not completely sure on OFAs abilities here). If this is so, OFA would in theory give the same accuracy as having your gom infrastructured PC collect (and store) the up/down tick data.
Having said all that, I'd say the differences between the 2 data collection/portrayal methodologies are about 93 to 97% similar, and probably more. Just a guess on that, from having compared volume footprint chart of gom, and ranchodinero, the latter of which would be using a tick/data collection methodology similar to OFA. I have not yet done a chart side-by-side comparison of OFA to GOM volume footprints because the OFA indicators default to using their specific bar type (6/4 for ES, 12/6 for CL) and I like to use either minute or range/tick charts for GOM. I am not sure if OFA allows one to change the bar type, and still see their portrayal of volume footprint charts.
The other aspect in choosing between volume footprintcharts from OFA, gom or rancho (there are others too), might be esthetic or functionality. The rancho/acme ones have a very nifty built-in feature that when you resize the chartwidth and/or height, it will decrease/increase the font size of the buyer/seller numbers within the bar. But, I'm not a fan of how it is laid out graphically - I prefer the fixed font/bar size nature of gom, but more so the 'cleaner' way it is displayed, also having a histogram corresponding to the number of buyers and sellers at each price, at each bar. Gom also display the actual candle between the sellers and buyers, allowing you to see any wick lengths, therebuy (to me) giving me more information within the volumefootprint chart - this latter item I do not believe I have seen on any other competitor's volume footprint charts. There are other feature differences too, that can have a useful impact to day-to-day usage, like the gom ability to consolidate price on it's volumefootprint to 2 price levels, since the 1 cent granular level in CL is in my opinion too much data sometimes, and, can become a screen real estate issue. Also, the gom infrastructure has shown itself to be extremely versatile, with widely varying ways to display the data (because it is all open source), and there have been fantastic programmers who have created indicators like metrovolumeadditionv2/3 to display the data very differently; this latter one I think has made a purposeful attempt to make it look and act more like OFA, right down to doing the 'correct' diagonal buyer-to-seller comparison. It is a combination of these indicators that I have mentioned (along with some other really good ones) that has prompted folks like LePrivateBanker (check his twitter feed) to create some really nifty order flow charts, drawing on this open source code - check his tweet of January 16 for a view of how the orderflow data can be displayed) In closing, I would say that the versatility of gom allows for finding a better chart view and methodology for the individual trader, but finding the right indicators that work for you can take some time, and they can be tough to find (they are all almost exclusively found on bigmike trading).


NinjaTrader 8.0.28
in Ninja Trader 8
Posted
There's a thread still on the first page of the forum that contains links to a few of them that connect to Rithmic. Just takes a quick read. Here it is - followed the embedded referenced posts for details on it's features and connectivity. I've posted the direct link here too, it's for 8.0.28:
https://drive.google.com/file/d/19mlw5M1tyI_hBXfcqWaxnLF2NMwd6Bpu/view