⤴️-Paid Ad- Check advertising disclaimer here. Add your banner here.🔥
All Activity
- Past hour
- Today
-
I have both
-

HFMarkets (hfm.com): Market analysis services.
AllForexnews replied to AllForexnews's topic in Fundamental Analysis
Date: 24th March 2026. Markets Rebound on De-Escalation Hopes, but Risks Remain. On Monday, the stock market saw a strong rebound while the US Dollar and oil fell near a two-week low. This price action suggests that risk appetite and overall market sentiment are improving. However, traders are still assessing whether this recovery has enough momentum to continue in the coming sessions. The trend change, which took place during the middle of the European session, was primarily due to the US. More specifically, Trump told journalists that the ‘ultimatum’ he previously mentioned would not proceed and that the conflict will most likely end with negotiations. This comment alone quickly changed market expectations. Traders previously were pricing in a higher probability of escalation, which drove energy prices higher and equities lower. Once the rhetoric softened, markets began to unwind those positions for two reasons. The ultimatum which was seen as a serious escalation would not hold and that there is a greater chance of ending the conflict. As a result: Oil pulled back as immediate supply disruption fears eased, falling 14% in 30-minutes. The US Dollar weakened as safe-haven demand declined, Falling to a two-week low. The NASDAQ rose 3.70% before losing momentum and moving sideways. However, the move appears driven more by sentiment than confirmed developments. Markets are now highly sensitive to headlines, meaning any shift back towards escalation could quickly reverse this trend. De-Escalation or Fake News? In addition to these comments from White House officials, the US also announced it would not attack Iran’s energy infrastructure for five days. The decision was reportedly linked to constructive discussions with the leadership of the Islamic Republic. These talks were said to be aimed at easing the armed conflict. At the same time, several media outlets, including Iran’s Tasnim and Fars, cited their own sources. They said there is effectively no active negotiation channel with the United States. According to these reports, the pause in strikes reflects growing pressure from financial markets. It also reflects rising risks linked to US debt instruments and Western financial systems. Official sources in Tehran have repeatedly stated that the Islamic Republic will continue its defensive strategy until it achieves what it considers a sufficient level of deterrence, according to regional media reports. In addition to this, Iran also advised that it will keep the Strait of Hormuz closed even after the conflict has ended. For this reason, even after the recent comments and attempts to de-escalate, risks for the broader economy and investments remain. NASDAQ The NASDAQ, which had been trading 10% lower than its recent highs, was quick to rebound after the comments from the US administration. The NASDAQ rose 3.70% and still remains 2.75% higher than yesterday’s lows. Of the 100 stocks within the NASDAQ, 81 stocks rose on Monday while 19 stocks continued to decline. This analysis of the individual components verifies the upward price movement, as does the VIX, which fell almost 5%. Nonetheless, the price of the VIX on a weekly basis is still trading almost 18% higher, and technical analysis continues to signal stress levels. Regardless of the upward price movement on Monday, the price remains below the 75-bar EMA and below the VWAP. In order for the price to be able to obtain further buy signals in the short term, it would need to rise above $24,267.30. Above this level would push the price above the key moving averages and increase the possibility of a higher high. However, if the price falls below $24,117.75, the possibility of a buy signal would weaken. HFM - NASDAQ 15-Minute Chart US Dollar Declines on Monday The best performing currency of the day remains the US Dollar despite the strong decline the day before. The price of the US Dollar Index opened the day with a bullish price gap measuring 0.22% and is trading above the 200-bar SMA on the 5-minute timeframe. However, similar to the NASDAQ, on larger timeframes the price is trading below key moving averages. However, the US Dollar has been trading within an upward trend throughout most of 2026 and is also supported by fundamental factors. If the price of the Index rises above 99.23, the price will form a breakout indicating an upward correction. HFM - US Dollar Index 15-Minute Chart The GBP, NZD, and AUD are the weakest performing currencies of the day while the US Dollar and CAD are the best performing. Key Takeaways: Stocks rebounded strongly after Trump signalled the ultimatum would not proceed and negotiations were more likely. Oil dropped sharply as traders reduced fears of immediate supply disruptions and broader conflict escalation. The US Dollar weakened as safe-haven demand faded and overall market risk appetite improved. The rebound appears sentiment-driven, so any renewed escalation could quickly reverse the move. Despite Monday’s recovery, Iran-related risks still threaten the broader economy, market stability, and investor confidence. Always trade with strict risk management. Your capital is the single most important aspect of your trading business. Please note that times displayed based on local time zone and are from time of writing this report. Click HERE to access the full HFM Economic calendar. Want to learn to trade and analyse the markets? Join our webinars and get analysis and trading ideas combined with better understanding of how markets work. Click HERE to register for FREE! Click HERE to READ more Market news. Michalis Efthymiou HFMarkets Disclaimer: This material is provided as a general marketing communication for information purposes only and does not constitute an independent investment research. Nothing in this communication contains, or should be considered as containing, an investment advice or an investment recommendation or a solicitation for the purpose of buying or selling of any financial instrument. All information provided is gathered from reputable sources and any information containing an indication of past performance is not a guarantee or reliable indicator of future performance. Users acknowledge that any investment in Leveraged Products is characterized by a certain degree of uncertainty and that any investment of this nature involves a high level of risk for which the users are solely responsible and liable. We assume no liability for any loss arising from any investment made based on the information provided in this communication. This communication must not be reproduced or further distributed without our prior written permission. -
Thanks for all your work, i have a question, You only open a developer account? Or we need to an Schwab account, i have a denied api for two times
-
not work for me!
-
You guys are really going at it hard huh!🤗 I truly admire and envy all of your sheer dedication and hardwork to iron this one project out. Not to mention, your precious time. I can see your knowledge flowing through every single line.❤️
-
 ⭐ laser1000it reacted to a post in a topic:
Metastock 20 realtime c*****d
⭐ laser1000it reacted to a post in a topic:
Metastock 20 realtime c*****d
-
kimsam reacted to a post in a topic:
KimSam NT8 GEX Calc
-
You can also add the conversion ratio ( say QQQ to NDX is 1:42) and GEX Ratio: 0.48 ; Flow Ratio: 1.00; Strike filter (±3%); distance_from_flip; Gamma Intensity: MODERATE ==> --> 42.8% expiring in 7 days; Market Stability: STABLE; Pin Force: +0.0014 and Pin Confidence (if available). few of these may not fit into the model of realtime publication of your important metrics that is currently implemented, but this could act as a overall session summary metrics or a different timeframe summarization like 30min summarization. some ideas GEX_SUMMARY| spot=…;flip=…;peak=…;net=…; pos_wall=…;neg_wall=…; vol_zero=…;vol_pos=…;vol_neg=…; vix_regime=Risk-Off;vix_multiplier =1.35; hmm_regime=BULL;hmm_conf=0.8 Divergence flags: price crossing flip while net GEX sign unchanged, etc. VIX adjusted walls = Flip × VIXMultiplier, PosWall × VIXMultiplier, etc. GammaRegime = {LongGamma, ShortGamma} Distance from flip = (future price - schwab flip) / ATR volume weighting vs OI weighting. some of the ideas I am writing so that you can think about.
-
 axsx reacted to a post in a topic:
KimSam NT8 GEX Calc
axsx reacted to a post in a topic:
KimSam NT8 GEX Calc
-
bassmark2 reacted to a post in a topic:
quantvue.io
-
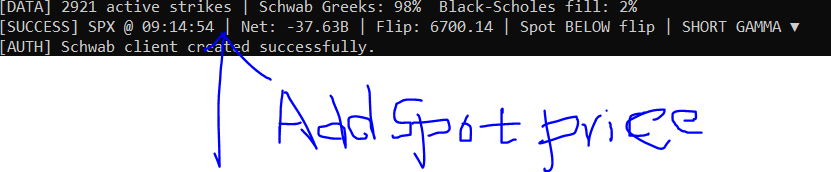
making some updates .. RO] Starting Native TCP Engine for SPY on Port 5602 [FETCH] Querying Schwab for SPY... [DEBUG] Fetching Chain (Light): SPY... [SUCCESS] SPY Chain loaded: 34 Calls, 34 Puts. [DEBUG] Truth Engine: Spot 653.38 | Net GEX -0.12B | Flip 646.0 | FlowZero 641.0
-
add spot price to the logs.

-
 JackSparrow440 reacted to a post in a topic:
KISS strategy
JackSparrow440 reacted to a post in a topic:
KISS strategy
-
JackSparrow440 reacted to a post in a topic:
KISS strategy
-
Sir, you are 100% correct. I am having mtpredictor 8.5.3 NTaddons. In India for the Ninjatrader data providers are very few and not accurate data. For EOD it's very hard for getting data. There are multiple data providers For the standardlone version intraday and EOD data . So that I am asking standardlone version
-
Kermit 1981 reacted to a post in a topic:
KISS strategy
-
omni69 reacted to a post in a topic:
KISS strategy
-
Harrys reacted to a post in a topic:
Sky's MTF Panel
-

Market Technical Analysis by RoboForex
RBFX Support replied to RBFX Support's topic in Technical Analysis
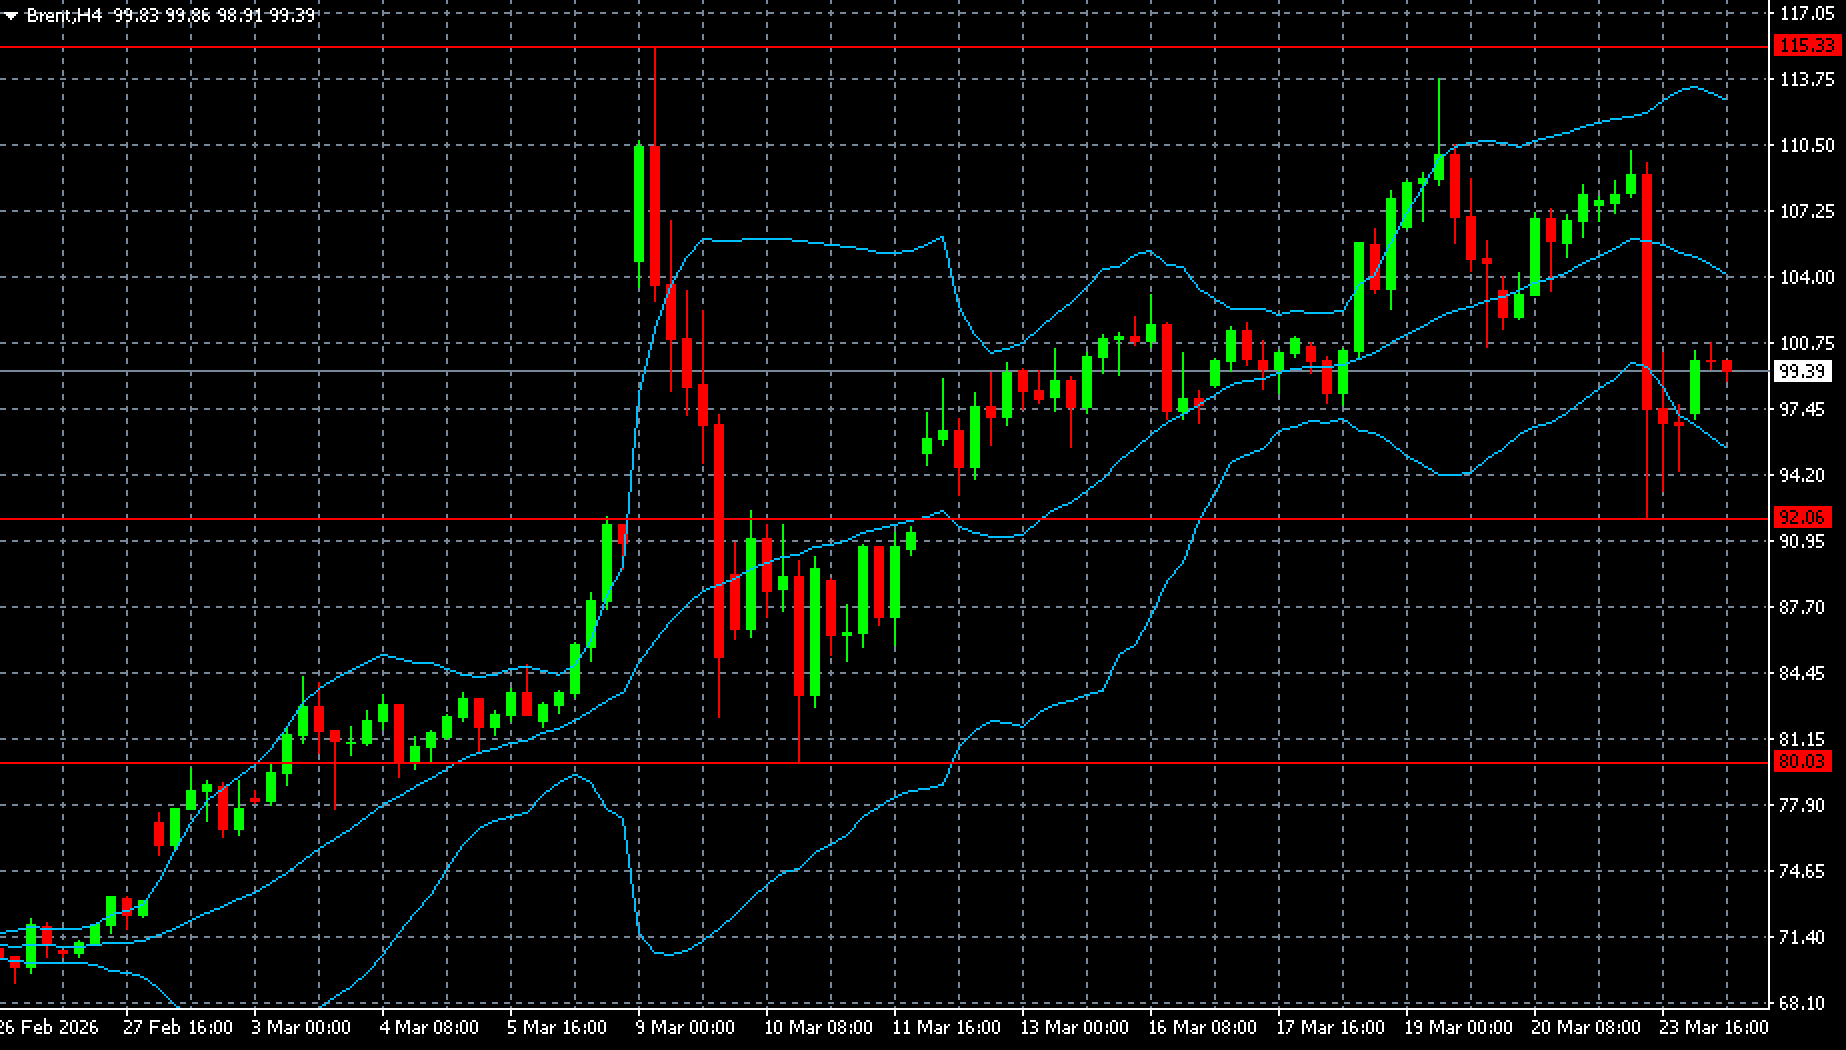
Brent has a chance to rise again: the Middle East remains in conflict Brent oil recovered some of its losses and returned to 99.40 USD. Negotiations on Iran have not yet been confirmed. Find out more in our analysis for 24 March 2026. Technical outlook The Brent H4 chart shows that a strong upward momentum formed at the start of the period, with prices climbing from the area around 80 to the zone above 110. The move was accompanied by an expansion of Bollinger Bands, indicating strong demand and faster trend development. Brent prices are recovering after the previous day’s collapse because news on Iran has not been confirmed. Read more - Brent Forecast Attention! Forecasts presented in this section only reflect the author’s private opinion and should not be considered as guidance for trading. RoboForex bears no responsibility for trading results based on trading recommendations described in these analytical reviews. Sincerely, The RoboForex Team
-
roboforex Market Fundamental Analysis by RoboForex
RBFX Support replied to RBFX Support's topic in Fundamental Analysis
Gold is losing its crown: why the dollar is now at its peak while XAUUSD is falling After the decline, gold (XAUUSD) is attempting to recover, with quotes testing the 4,370 USD mark. Discover more in our analysis for 24 March 2026 XAUUSD forecast: key takeaways US manufacturing PMI: previously at 51.6, projected at 51.5 US services PMI: previously at 51.7, projected at 52.0 XAUUSD forecast for 24 March 2026: 4,612 Fundamental analysis Today’s XAUUSD price forecast shows that gold prices continue their corrective wave, currently hovering around the 4,370 USD per ounce level. Yesterday, 23 March, the market went on a real rollercoaster ride: prices first plummeted below 4,100 USD, breaking through five support levels in a row, and then sharply surged by more than 300 USD on news from the White House. RoboForex Market Analysis & Forex Forecasts Attention! Forecasts presented in this section only reflect the author’s private opinion and should not be considered as guidance for trading. RoboForex bears no responsibility for trading results based on trading recommendations described in these analytical reviews. Sincerely, The RoboForex Team -

Latest MTP PREDICTOR NT8 ADDON EDU
Ninja_On_The_Roof replied to danielndiso254's topic in Ninja Trader 8
The 8.5.3 version was already posted and it was also educated. Didn't you see the link? PB? Are you talking about "pull back" signals? If so, there are many indicators out there that can give you these types of signals. A bunch of Ninza indicators have this type of BP signals. The infamous SolarWave or the same Nova has this. The Zenith has it. The Zephyrus Force has it. The Trading123 Cloud also has this, surprisingly. If you have some decent knowledge regarding reading your chart and spotting your critical and major levels, I personslly think, you seriously wouldn't need anything to tell you where price might pull back on you.🤗 Regardless, those mentioned above could and possibly provide you with what you need with your trading activity. And honestly, if you notice, MTP guy never has anything live. In a live trading mode, when everything moves swiftly, you wouldn't have time to sit there and click this, click that, just to analyze your entries and stops. You would need to make that split decision or else, your train has already left you behind, price already has gone to other places. Especially, if you mess with the NQ. BTW, there are also free indicators out there which can also give you your trade info like risk and reward ratio and so on... -
One of the simplest and best things I've read yet .....the one on the SuperTrend, obviously
-
⭐ laser1000it reacted to a post in a topic:
KISS strategy
-
Hi sir, I am sorry, I don't have previous version also. I have only 8.1.1 version. In that version PB signal is not available. If you have any 8.5 standardlone educated version which have PB signals pls share. That will be more helpful. Thank you.
-
Latest MTP PREDICTOR NT8 ADDON EDU
Ninja_On_The_Roof replied to danielndiso254's topic in Ninja Trader 8
Use a hammer, then "crack" the file open - just like how you "crack" a coconut. See what is inside of it... This version is still pretty much the same as the previous version. All the major important functions and concepts are all there with the old version.🤗 MTP is not a just plug-in and play. One still needs to have some basic knowledge such as how to analyzing his/her charts, S/R levels, mutil different time frames analysis...If you think you can just sit and wait for the signal to show up and enter your trades purely based off the MTP's signals, you are in for a world of pain, drowning in a sea of red. -
This got confusing. I think the original topic was about the Kiss strategy from the Timeless dude. Gotta admit, he came up with cool names for his stuff. Timeless and Trendbender... Kiss Orderflow is entirely different. These 2 are not related. This dude, named Joey, is the same dude that used to trade with his Analytic Polarity ATI stuff all over YouTube, if I recall correctly. I remember because I did try out the Polarity stuff for like...a day! I guess, as time goes by, he has moved on and "invented" new other strats, Timeless stuff. Why dont you just make your own bot, using just SuperTrend and have a target of 20 ticks and a stoploss of 40 ticks. Just add an additional criteria to the strategy. Only enter signal for long if price is above 50 or 200EMA and vice versa, only enter signal for short if price is below. You would hit your 20 ticks profit in no time. 🤗 Even when market is choppy. 20 ticks target is still quickly reached before SuperTrend decides to flip flop. It is fun to watch, especially when you delivered your own baby, your own bot.😷
-
Do you know the Auto Strategy Builder of tradedevils?
Ninja_On_The_Roof replied to chillon's topic in Ninja Trader 8
Maybe, this is where you might wanna start first. Just to get some basic ideas on how to play around with your strats. -

Do you know the Auto Strategy Builder of tradedevils?
kingmob6 replied to chillon's topic in Ninja Trader 8
so I loaded it, its in there, but I have no idea how to actually test my strategy with it. Any pointers? I am a bit lost. -
Thanks but this is an indicator, not the strategy.
-
can anyone crack this uneducated stand-alone version 8.5.2.2 pls
-
Please apply this notes: Hello, You may want to contact our support to see if we can assist. In a small number of cases we have seen where the program can hang with certain display settings. This has been seen only recently. While we are uncertain as to the source of the issue, it is possible that a recent Windows update has triggered this behavior. One thing you can try to see if this might help is: 1. Right-click on the MetaStock shortcut and click Properties 2. Click the "Compatibility" tab 3. Click the "Change High DPI Settings" button 4. Place a checkmark next to "Override high DPI scaling behavior." 5. Click on the drop-down box and change this to "System" 6. Click OK Try launching MetaStock and see if this helps. If not you may still want to contact our support https://www.metastock.com/company/contact.aspx to see what else can be done.
-
@Ninja_On_The_Roof Thank you so much.
-
Great tool to get Gamma Flip level, Peak Gamma (strike with highest absolute GEX), Top 5 call/put walls, net GEX, the unique way you have addressed Fills missing Schwab gammas with a clean Black–Scholes fallback and logs live vs BS fill percentage . Please include if you can volume‑based GEX (flow‑oriented), major positive/negative GEX by volume, zero‑gamma by volume. Ability to filter out far end strikes, ability to export to csv file, png chart output, support for CBOE API (free), buttons appear in the middle of the chart and can be pushed to the top. dashboard toggle. The truth engine keeps on running every 3mins. a configurable parameter needed. Disconnect/Connect can be expanded to shut down the truth engine as I see it runs whenever the chart is loaded. One more thing is Top GEX markers P #5 | 3.16B, include the price level also like P#5 | 3.16B | 24250 for example.