
⤴️-Paid Ad- Check advertising disclaimer here. Add your banner here.🔥
All Activity
- Past hour
-
 Dan joined the community
 - Today
-
 Dopamine joined the community
 -
Welcome to Indo-Investasi.com. Please feel free to browse around and get to know the others. If you have any questions please don't hesitate to ask.
-
 sagittatradingsystems joined the community
 -
up
-

HFMarkets (hfm.com): Market analysis services.
AllForexnews replied to AllForexnews's topic in Fundamental Analysis
Date: 9th July 2026. Markets Weekly: Oil, Fed Outlook and Middle East Tensions Keep Traders on Edge. Global financial markets continue to navigate a challenging environment where geopolitics, inflation, and central bank policy remain the dominant themes. Renewed military activity in the Middle East, fluctuating oil prices, and shifting expectations for US interest rates have created increased volatility across currencies, commodities, bonds, and equities. Although investors remain cautious, market reactions suggest participants still believe the current geopolitical tensions can be contained. However, with inflation risks returning to the spotlight, traders are closely monitoring every headline for signs of a broader shift in market sentiment. Middle East Conflict Remains the Key Market Catalyst The latest developments between the United States and Iran continue to dominate financial markets. After renewed military exchanges earlier this week, including US strikes on Iranian military targets and retaliatory attacks by Iran, President Donald Trump initially declared that the ceasefire agreement was ‘over.’ However, sentiment shifted once again after Trump later stated that Iran was seeking to resume negotiations. This back-and-forth rhetoric has become a familiar pattern throughout the conflict. While the White House appears eager to reduce tensions, investors remain sceptical that a lasting diplomatic solution is close. Negotiations surrounding Iran’s nuclear programme have made little meaningful progress despite previous commitments, suggesting further periods of uncertainty remain likely over the coming weeks. Strait of Hormuz Still in Focus Although military activity has increased, financial markets have largely avoided panic. The Strait of Hormuz remains one of the world’s most strategically important shipping routes, transporting approximately one-fifth of global oil supplies. Following recent attacks on commercial vessels, shipping activity slowed considerably before gradually resuming along alternative routes. While Brent crude briefly climbed above $80 per barrel earlier this week, prices have since eased back below $78 as investors continue to believe that a full-scale disruption to global energy supplies remains unlikely. For now, markets appear to view the latest escalation as another phase in the ongoing negotiations rather than the beginning of a prolonged energy crisis. Oil Prices Keep Inflation Concerns Alive Energy markets remain at the centre of investor attention. Although oil prices have retreated slightly, the recent rally has reignited concerns that inflation could remain elevated for longer than previously expected. Higher energy prices feed directly into transportation and production costs, potentially slowing the recent decline in global inflation. As a result, traders have begun reassessing expectations for central bank policy, particularly in the United States. Federal Reserve Adopts a More Cautious Tone The release of the Federal Reserve’s latest meeting minutes provided another reminder that policymakers remain divided over the future path of interest rates. During the June policy meeting, several members argued that another interest rate increase could still become necessary if inflation remains persistent. Others maintained that rates may gradually move lower later this year. Following the minutes, markets increased expectations that the Federal Reserve could deliver another rate hike before year-end. According to futures markets, the probability of another increase has risen significantly over the past week as higher oil prices threaten to keep inflation above target. For traders, the message remains clear: inflation continues to drive monetary policy. Currency Markets: Dollar Volatility Continues The US Dollar experienced another volatile week as geopolitical headlines and interest rate expectations continued to influence investor positioning. Safe-haven demand initially supported the Dollar following renewed military action in the Middle East. However, the currency later weakened after President Trump suggested that diplomatic discussions with Iran could resume. Markets interpreted the comments as another attempt to de-escalate tensions, although investors remain unconvinced that a lasting agreement is imminent. Major currency pairs reflected the changing sentiment: EURUSD climbed back towards 1.1440, approaching recent highs. GBPUSD rose above 1.3420, reaching its strongest level in nearly three weeks after breaking above key technical resistance. AUDUSD recovered alongside improving risk appetite. USDJPY edged lower as Treasury yields eased. The US Dollar continues to trade between competing forces: safe-haven demand during periods of geopolitical uncertainty and weakness resulting from softer Treasury yields and shifting expectations for Federal Reserve policy. Swiss Franc Attracts Defensive Buying The Swiss Franc remained one of the strongest performers among major currencies this week. USDCHF continued to move lower as investors sought traditional safe-haven assets amid rising geopolitical uncertainty. At the same time, the Swiss National Bank reiterated its willingness to intervene in currency markets if excessive strength in the franc threatens domestic price stability. Growing demand for both the Swiss Franc and gold reflects investors’ continued search for defensive assets while geopolitical risks remain elevated. Equity Markets Show Signs of Stability Despite heightened geopolitical tensions, global equity markets have remained remarkably resilient. European stock futures point towards a stronger opening, while US index futures also recovered after earlier losses. Asian markets delivered mixed performance, with gains in mainland China and Japan offsetting weakness in Hong Kong. The resilience of equity markets suggests investors continue to expect the current conflict to remain contained rather than escalate into a broader regional crisis. Gold Continues to Benefit from Uncertainty Gold maintained its upward momentum as investors balanced geopolitical risks against rising interest rate expectations. Normally, higher Treasury yields reduce the appeal of non-yielding assets such as gold. However, persistent geopolitical uncertainty has continued to support demand for precious metals. Silver also advanced alongside gold, reflecting broader defensive positioning across commodity markets. Corporate Developments Artificial intelligence remains one of the strongest long-term investment themes despite current macroeconomic uncertainty. Among the week’s major corporate developments: SK Hynix’s upcoming US listing has reportedly attracted exceptionally strong investor demand. Reports suggest China may ease restrictions on purchases of Nvidia’s advanced AI chips, potentially supporting semiconductor stocks. Meta Platforms announced plans to invest approximately $10 billion in its first Canadian data centre as the company continues expanding its AI infrastructure. Economic Calendar European Session The European Central Bank will release its latest meeting accounts. While the report provides useful insight into policymakers’ discussions, it rarely generates significant market volatility because the information is already considered outdated. US Session Attention turns to the latest US labour market data. Economists expect: Initial Jobless Claims: 217,000 Continuing Claims: 1.814 million Unless the figures differ significantly from expectations, the release is unlikely to become a major market catalyst. Investors will also monitor speeches from several central bank officials, including representatives from the Federal Reserve, the Swiss National Bank, and the Bank of England. What Traders Should Watch Next Financial markets remain highly sensitive to both economic data and geopolitical headlines. The key themes likely to drive markets over the coming days include: Further developments between the United States and Iran. Security of shipping through the Strait of Hormuz. Oil prices and their impact on global inflation. Federal Reserve interest rate expectations. US Dollar performance across the major currency pairs. Next week’s US inflation data, which could significantly influence expectations for future Fed policy. For now, investors continue to favour the view that geopolitical tensions will remain contained. However, any disruption to global energy supplies or another sharp rise in oil prices could quickly reverse sentiment across global financial markets. As inflation remains the defining issue for central banks, traders should expect elevated volatility to continue throughout the coming weeks. Always trade with strict risk management. Your capital is the single most important aspect of your trading business. Please note that times displayed based on local time zone and are from time of writing this report. Click HERE to access the full HFM Economic calendar. Want to learn to trade and analyse the markets? Join our webinars and get analysis and trading ideas combined with better understanding of how markets work. Click HERE to register for FREE! Click HERE to READ more Market news. Andria Pichidi HFMarkets Disclaimer: This material is provided as a general marketing communication for information purposes only and does not constitute an independent investment research. Nothing in this communication contains, or should be considered as containing, an investment advice or an investment recommendation or a solicitation for the purpose of buying or selling of any financial instrument. All information provided is gathered from reputable sources and any information containing an indication of past performance is not a guarantee or reliable indicator of future performance. Users acknowledge that any investment in Leveraged Products is characterized by a certain degree of uncertainty and that any investment of this nature involves a high level of risk for which the users are solely responsible and liable. We assume no liability for any loss arising from any investment made based on the information provided in this communication. This communication must not be reproduced or further distributed without our prior written permission. -

roboforex Market Fundamental Analysis by RoboForex
RBFX Support replied to RBFX Support's topic in Fundamental Analysis
Solana shows strong fundamentals, but bears remain in control SOLUSD remains under selling pressure despite a strong fundamental backdrop and growing institutional investor interest in the Solana ecosystem. The price currently stands at 78.03. SOLUSD forecast: key takeaways The volume of tokenised real-world assets in the Solana network increased by 540 million USD over the week, reaching a new all-time high The introduction of European regulation accelerated the redistribution of capital from high-risk altcoins into more stable blockchain platforms SOLUSD forecast for 9 July 2026: 64.80 Fundamental analysis The SOLUSD price is correcting upwards after declining for two consecutive trading sessions. Near the 75.85 USD mark, sellers encountered strong support, allowing buyers to seize the initiative temporarily. The fundamental backdrop remains favourable for Solana. The volume of tokenised real-world assets in the network increased by 540 million USD over the last week. RoboForex Market Analysis & Forex Forecasts Attention! Forecasts presented in this section only reflect the author’s private opinion and should not be considered as guidance for trading. RoboForex bears no responsibility for trading results based on trading recommendations described in these analytical reviews. Sincerely, The RoboForex Team -
Market Technical Analysis by RoboForex
RBFX Support replied to RBFX Support's topic in Technical Analysis
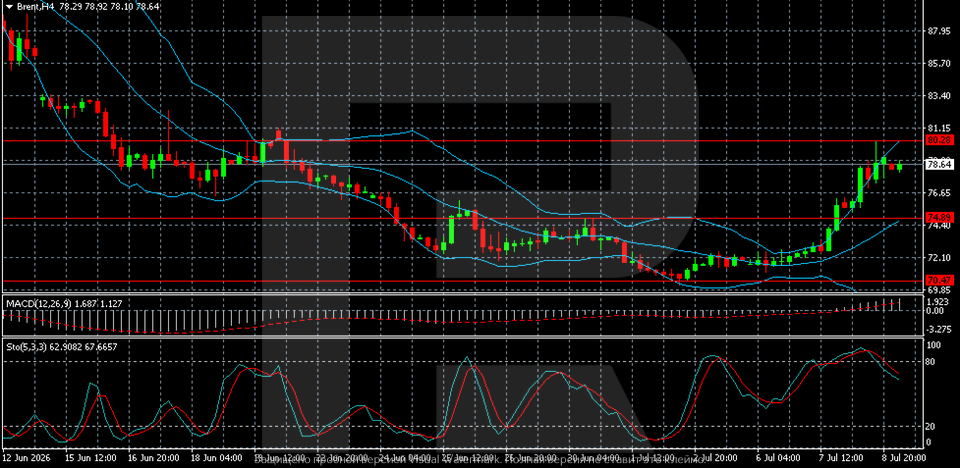
Brent soars as risks boost demand Brent climbed to 79 USD, with all eyes on the Strait of Hormuz and the new escalation of the conflict. Technical outlook On the H4 chart, Brent crude maintains strong upward momentum after confidently breaking out of the 70.50–74.90 range. Quotes quickly broke through several resistance levels and rose to the 78.50–79.00 area, where growth temporarily slowed. Brent prices are rising due to a new round of conflict in the Middle East. Read more - Brent Forecast Attention! Forecasts presented in this section only reflect the author’s private opinion and should not be considered as guidance for trading. RoboForex bears no responsibility for trading results based on trading recommendations described in these analytical reviews. Sincerely, The RoboForex Team
-
 sa.sa.sa joined the community
 - Yesterday
-

difficult to trade in here without a strategy
hhduy replied to Jesus D. Mallory's topic in General Forex Discussions
Trading without a strategy is just like gambling in a casino. You might win some money today by luck but you will lose it all tomorrow. Professional traders always follow strict rules for buying and selling. It is the only way to survive in this market. -
Pivot Points are great because many big bank traders look at them too. When the price touches the R1 or S1 level, it often bounces back. You should combine it with candlestick patterns for better results.
-

Introduction To Online Forex Trading
bluemac replied to StefGrig's topic in General Forex Discussions
Demo accounts are kinda brochure while the micro live are like a test drive. Regulations on other hand is the warranty so better buy car only after all 3 🎯 -
No journal only means gambling while having no risk control is donating. No edge in entries alone 🎯
-
Forex Basics 4 Advanced&Beginner Traders
bluemac replied to StefGrig's topic in General Forex Discussions
EMA is the trigger, not the reason 🧠 No HTF, no trade. Simple 💀 -
 jack joined the community
 -
working good . and the second 32v also working , the first 32x is opening the 64x .
-
roboforex Market Fundamental Analysis by RoboForex
RBFX Support replied to RBFX Support's topic in Fundamental Analysis
US 30 index forecast: the index continues to reach new all-time highs The US 30 index has confidently surpassed its all-time high, with a correction highly likely. The US 30 forecast for today is positive. US 30 forecast: key takeaways Recent data: US Nonfarm Payrolls came in at 57 thousand in June 2026 Market impact: the data has a positive impact on the stock market Fundamental analysis US Nonfarm Payrolls data appears weak for the market, with actual job growth at 57 thousand, below the forecast of 114 thousand and the previous reading of 129 thousand. This indicates a notable cooling in the labour market and may fuel concerns that the US economy is losing growth momentum. This may support stocks, as lower rates increase the appeal of the stock market and reduce borrowing costs for businesses. RoboForex Market Analysis & Forex Forecasts Attention! Forecasts presented in this section only reflect the author’s private opinion and should not be considered as guidance for trading. RoboForex bears no responsibility for trading results based on trading recommendations described in these analytical reviews. Sincerely, The RoboForex Team -
Market Technical Analysis by RoboForex
RBFX Support replied to RBFX Support's topic in Technical Analysis
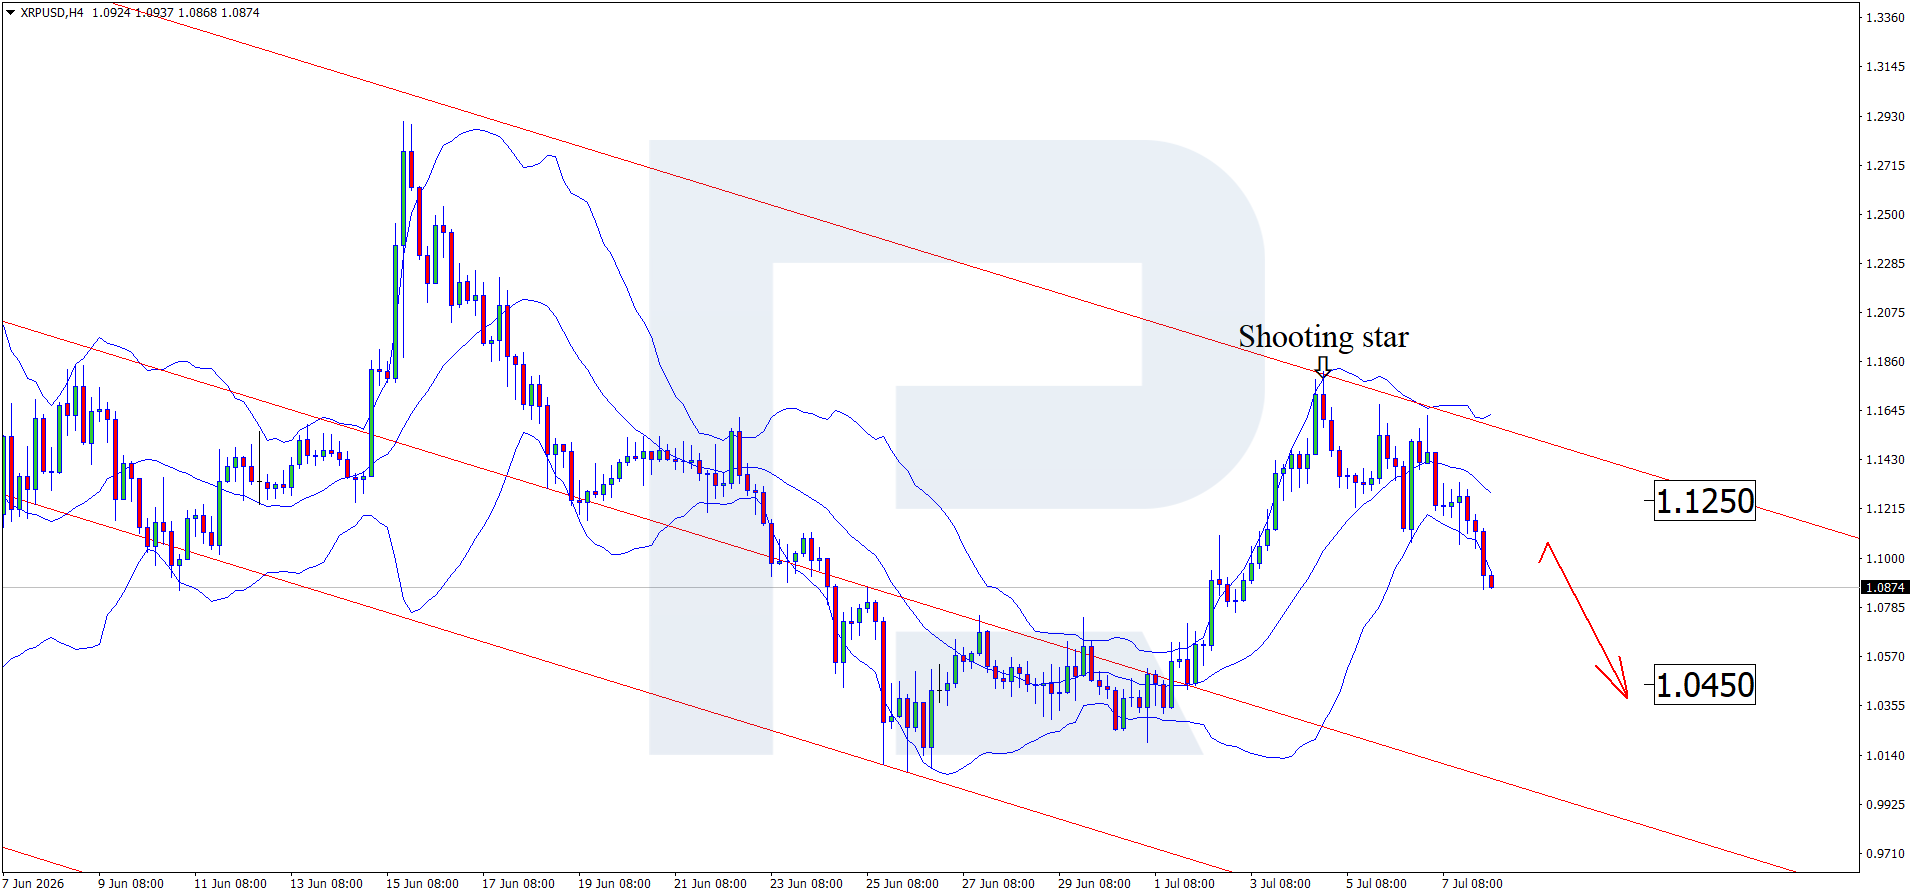
XRP on the verge of collapse, CASP licence not enough to save it The XRPUSD price continues to decline today despite positive news regarding the CASP licence. The current quote is 1.0847 USD. Technical outlook On the H4 chart, XRPUSD formed a Shooting Star reversal pattern near the upper Bollinger Band. At this stage, quotes may continue their corrective wave following the signal, with the downside target at the 1.0450 support level. After testing the 1.1817 level, the XRP price continues to fall despite positive news regarding licensing in the EU. Read more - XRPUSD Forecast Attention! Forecasts presented in this section only reflect the author’s private opinion and should not be considered as guidance for trading. RoboForex bears no responsibility for trading results based on trading recommendations described in these analytical reviews. Sincerely, The RoboForex Team
-
 acacaca joined the community
 -
Welcome to Indo-Investasi.com. Please feel free to browse around and get to know the others. If you have any questions please don't hesitate to ask.
-
 saiarun2005 joined the community
 -
A million thanks to both of you.🙏
- Last week
-
 Misti007 joined the community
 -
 snoop joined the community
 -
-
HFMarkets (hfm.com): Market analysis services.
AllForexnews replied to AllForexnews's topic in Fundamental Analysis
Date: 7th July 2026. Gold Slides Toward $4,000 as Tech Selloff Weighs on Global Markets. Gold continues to decline downwards towards the $4,000 psychological price. The price of Gold is declining despite the global selloff in technology stocks and Dollar weakness. Investors continue to obtain indications of possible Gold weakness for the remaining months of 2026. The key reason for the lack of demand continues to be expectations of interest rate hikes and fears of the asset trading above its intrinsic value. All metals trade lower during Tuesday’s Asian session, with Silver and Gold witnessing the largest declines. The US Dollar is the best performing currency of the day but has seen both up and down swings this way. Gold - Weaker Gold-USD Correlation Indicates Lack of Demand and Momentum Gold forms two lower highs and breaks below the most recent low, indicating a potential correction back to $4,000. Furthermore, investors have also seen a weaker correlation between Gold and the US Dollar. The US Dollar Index in 2026 has an average volatility level of 0.45%, and yesterday’s downward swing measured 0.35%. This is 78% of the average volatility. During the same period, Gold rose 0.98%, which is only 54% of the average volatility level. The weakness in the Gold-USD correlation and lack of upward momentum provide a key indication for investors. If the price of the US Dollar Index rises above 100.84, the price of Gold is likely to witness strong short-term pressure. Many analysts advise that the asset’s upward momentum appears unsustainable. Markets expect the US-Iran conflict to be resolved soon as diplomatic talks continue. The reopening of the Strait of Hormuz and rising shipping volumes point to normalisation in the Persian Gulf, reducing demand for safe-haven assets like precious metals. HFM - Gold 1-Hour Chart JPMorgan Chase continues to expect Gold to average around $4,300 in Q3 and reach $4,500 in Q4. However, many economists are revising their target price lower. These target levels largely depend on the Federal Reserve’s interest rate decisions. Currently, 23% of the market continues to expect the Fed to not hike in 2026. If the possibility of a pause rises, the price of Gold can also rise and reach these levels. If the figure falls and rate hikes become more likely, Gold is likely to fall back to previous support levels. These levels include $4,026 and $3,940. NASDAQ - Samsung and Tech-Stocks Drive Global Indices Lower All global indices are declining, with the NASDAQ and Asian indices particularly coming under pressure from sell orders. Certain stock exchanges in Asia this morning temporarily halted trading in order to continue the current selloff. The key reasons behind the weakness in demand are fear that the Technology Sector has become too expensive and Samsung’s earnings report. Samsung reported a stronger-than-expected preliminary Q2 2026 earnings update this morning’s Asian session. The earnings report beat expectations by 6%, mainly driven by continued AI-related memory chip demand. Economists noted that despite the earnings beat and stronger-than-expected data, the results were not strong enough to impress shareholders, given the scale of previous AI-related investments. Furthermore, despite the record numbers, investors focused on concerns about how long the AI boom can last, sending the stock sharply lower. Lastly, today before the US market opens, SpaceX will be added to the NASDAQ. Since SpaceX’s IPO on June 12th, the stock has seen both up and down impulse waves. The price is currently at $160.00, as per the IPO. Funds and ETFs that track the index need to buy the newly added stock, which can push its price higher in the short term. HFM - NASDAQ 1-Hour Chart If the NASDAQ continues to decline, traders will be keen to see the reaction of the index when the price reaches support levels. The key support levels can be seen at $29,108 and $28,944. Key Takeaways: Gold remains under pressure, moving closer to the key $4,000 level despite Dollar weakness. Gold demand looks weak, with weaker Gold-USD correlation and limited upward momentum. Rate hike expectations remain the main risk for Gold, with key support levels at $4,026 and $3,940. Global tech stocks are selling off, led by pressure on Asian markets and Samsung’s sharp decline despite stronger earnings. NASDAQ remains vulnerable, with traders watching support at $29,108 and $28,944, while SpaceX’s index inclusion may create short-term buying demand. Always trade with strict risk management. Your capital is the single most important aspect of your trading business. Please note that times displayed based on local time zone and are from time of writing this report. Click HERE to access the full HFM Economic calendar. Want to learn to trade and analyse the markets? Join our webinars and get analysis and trading ideas combined with better understanding of how markets work. Click HERE to register for FREE! Click HERE to READ more Market news. Michalis Efthymiou HFMarkets Disclaimer: This material is provided as a general marketing communication for information purposes only and does not constitute an independent investment research. Nothing in this communication contains, or should be considered as containing, an investment advice or an investment recommendation or a solicitation for the purpose of buying or selling of any financial instrument. All information provided is gathered from reputable sources and any information containing an indication of past performance is not a guarantee or reliable indicator of future performance. Users acknowledge that any investment in Leveraged Products is characterized by a certain degree of uncertainty and that any investment of this nature involves a high level of risk for which the users are solely responsible and liable. We assume no liability for any loss arising from any investment made based on the information provided in this communication. This communication must not be reproduced or further distributed without our prior written permission. -
roboforex Market Fundamental Analysis by RoboForex
RBFX Support replied to RBFX Support's topic in Fundamental Analysis
Ethereum gets a second chance: the market is gearing up for a strong move The ETHUSD forecast for 7 July 2026 is positive for Ethereum; after the pullback, the price may continue to rise, currently standing at 1,178.00 USD. ETHUSD forecast: key takeaways Ethereum rose by more than 12% last week The price increased in response to the weak US Nonfarm Payrolls report ETHUSD forecast for 7 July 2026: 1,840.00 or 1,740.00 Fundamental analysis Today’s Ethereum price forecast takes into account that Ethereum is correcting today in the 1,770.00–1,780.00 USD area, pulling back from local highs after rising by more than 12% last week. The price increase was a reaction to the weak US Nonfarm Payrolls report, which weakened the dollar and forced the market to price in Federal Reserve policy easing. RoboForex Market Analysis & Forex Forecasts Attention! Forecasts presented in this section only reflect the author’s private opinion and should not be considered as guidance for trading. RoboForex bears no responsibility for trading results based on trading recommendations described in these analytical reviews. Sincerely, The RoboForex Team -
Market Technical Analysis by RoboForex
RBFX Support replied to RBFX Support's topic in Technical Analysis
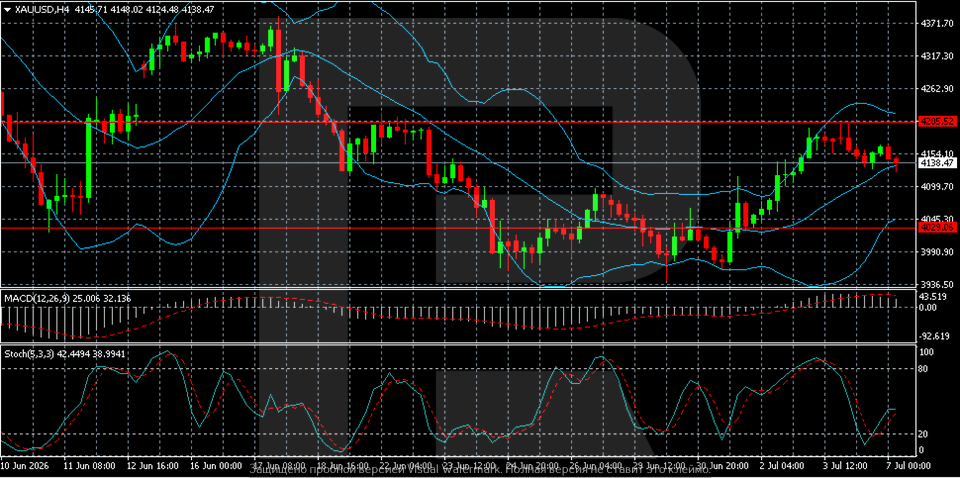
Gold (XAUUSD) has stabilised: the market is awaiting signals from the Fed Gold (XAUUSD) is trading at 4,138 USD, with the market keen to see the details from the Federal Reserve minutes. Technical outlook On the XAUUSD H4 chart, after a strong recovery from the low near 4,029, growth slowed near the 4,205 resistance level. Quotes failed to consolidate above this mark and entered a sideways consolidation phase, hovering around 4,140. Gold prices paused ahead of the release of the US Federal Reserve meeting minutes. Read more - Gold Forecast Attention! Forecasts presented in this section only reflect the author’s private opinion and should not be considered as guidance for trading. RoboForex bears no responsibility for trading results based on trading recommendations described in these analytical reviews. Sincerely, The RoboForex Team