⤴️-Paid Ad- Check advertising disclaimer here. Add your banner here.🔥
All Activity
- Past hour
-
Most of the brokers usually pay in trading credit which can be fine since it pushes for trading more in order to get profits for withdrawals.
- Today
-

Should we join forces with TGF Community? [Answer please]
⭐ kratos194 replied to MrAdmin's topic in Announcements
If TopGold.forum is based in Europe or America, it will no longer be possible to share copyrighted books, courses, or resources, so indo-investment will disappear. To increase forum revenue, you can increase advertisements and sponsors, as all forums in the world do (some examples): https://www.elitetrader.com/et/ https://www.trade2win.com/ https://nexusfi.com/index.php?s=ff7144f4fae703f2adf3394944821933 -

HFMarkets (hfm.com): Market analysis services.
AllForexnews replied to AllForexnews's topic in Fundamental Analysis
Oil Prices Climb as Russia-Ukraine Talks Stall, But Bearish Momentum Returns Crude oil prices rise for four consecutive days, and no further progress is made between Russia, the US and Ukraine. As time progresses without a ceasefire or peace deal, the likelihood of one diminishes, triggering a spike in Oil prices. Oil prices on Monday rose to $65.78, the highest in 20 days, but the price retraced lower during this morning’s session. Why Are Oil Prices Rising? Oil prices extended their gains as investors grew discouraged by the lack of progress in resolving the Russia-Ukraine conflict. Russia is the third-largest oil exporter in the world behind Saudi Arabia and the US. Over a week has passed since the meeting between US President Donald Trump and Russian President Vladimir Putin, yet no details of an agreement have surfaced. Adding to supply concerns, the White House reiterated over the weekend that new sanctions on Russia’s energy sector will be imposed within two weeks if no diplomatic settlement is reached. Such measures could tighten crude supply and further support prices. President Trump told journalists that he believes Putin's dislike of Zelensky is delaying a meeting between the two. Such a move would also significantly escalate geopolitical tensions, as Russia currently relies on oil exports to fund a large part of the economy’s budget. However, the Vice President told journalists that during the Trump-Putin talks, the Russian President was willing to make concessions. Therefore, if momentum again gains speed, the price of Crude Oil can again come under pressure. US Economic Data The upcoming economic data is also likely to influence the pricing of the energy market. Today, investors will evaluate the release of the US Durable Goods Orders, CB Consumer Confidence and Richmond Manufacturing Index. However, the main releases of the week will be Thursday’s Gross Domestic Product and Friday’s Core PCE Price Index. The price of Crude oil is likely to come under pressure if the economic data is weaker than the current projections, while the Core PCE Price Index reads higher. This would indicate a weakening economy while pressuring the Fed not to cut interest rates. On the other hand, if the Core PCE Price Index falls and the Gross Domestic Product rises, Crude Oil products are likely to rise further. Currently, all energy products are trading lower on Tuesday. Heating Oil is 0.42% lower, Brent Oil -0.42%, and Gasoline is 0.44% lower. All global indices are also declining, indicating a ‘risk-off’ sentiment within the market. Crude Oil - Technical Analysis The price of Crude Oil is trading below the day’s VWAP, indicating that sellers are currently controlling the price movement. However, on a 2-hour chart, the price remains above most Moving Averages, meaning that most traders will focus on a retracement at first. When the price falls below the 75-bar EMA on the 2-hour chart, traders will switch their view to a potential full correction. Crude Oil 10-Minute Chart A retracement could see the price fall back down to $64.1,9, which would be a further 1.20% decline. The $64.19 would be key as it is in line with the 75-bar EMA and is the level where the resistance level potentially may flip to support. However, the price movement would depend on the progress between Russia and Ukraine as well as the upcoming US economic data. If the price remains below the $65.00 level, sell signals are likely to remain intact for the short-term. If the price rises above $65.25, sell signals will start to fade until bearish momentum is regained. Key Takeaways: Crude oil hit a 20-day high at $65.78 amid stalled US-Russia-Ukraine peace talks and sanction risks. Lack of progress and potential US sanctions on Russia’s energy sector could tighten supply and support prices. US economic data this week (GDP, Core PCE) will heavily influence oil demand outlook and Fed policy expectations. Technically, oil trades below VWAP with key support at $64.19; staying under $65 keeps short-term bearish pressure. [b]Always trade with strict risk management. Your capital is the single most important aspect of your trading business.[/b] [b]Please note that times displayed based on local time zone and are from time of writing this report.[/b] Click [url=https://www.hfm.com/hf/en/trading-tools/economic-calendar.html][b]HERE[/b][/url] to access the full HFM Economic calendar. Want to learn to trade and analyse the markets? Join our webinars and get analysis and trading ideas combined with better understanding of how markets work. Click [url=https://www.hfm.com/en/trading-tools/trading-webinars.html][b]HERE[/b][/url] to register for FREE! [url=https://analysis.hfm.com/][b]Click HERE to READ more Market news.[/b][/url] [b]Michalis Efthymiou HFMarkets[/b] [b]Disclaimer:[/b] This material is provided as a general marketing communication for information purposes only and does not constitute an independent investment research. Nothing in this communication contains, or should be considered as containing, an investment advice or an investment recommendation or a solicitation for the purpose of buying or selling of any financial instrument. All information provided is gathered from reputable sources and any information containing an indication of past performance is not a guarantee or reliable indicator of future performance. Users acknowledge that any investment in Leveraged Products is characterized by a certain degree of uncertainty and that any investment of this nature involves a high level of risk for which the users are solely responsible and liable. We assume no liability for any loss arising from any investment made based on the information provided in this communication. This communication must not be reproduced or further distributed without our prior written permission. -
In the HFM contests I’ve joined, I treat them as execution drills rather than edge validation—spreads/fills differ from live. So does HFM pay cash or credit with turnover rules?
-
 Hello, has anyone received the course yet?
 -

8.1.5.2 64-bit unable to change timezone it is grayed out
roddizon1978 replied to ⭐ rcarlos1947's topic in Ninja Trader 8
Check your trading hours at Tools , maybe you could change it there -

REQ : david weis catching trend reversal dvd
owh5v replied to owh5v's topic in Forex Clips & Movie Request
@RichardGerei saw one post about weis wave indicator in nt8 you should check it out. maybe someone uploaded there -
REQ : david weis catching trend reversal dvd
owh5v replied to owh5v's topic in Forex Clips & Movie Request
yes i can access it thank you !! you are such a big help~ oh sorry i just tried it it only works on nt7 sorry... but i found one trick to run similar in tv. appreciate man -
 owh5v reacted to a post in a topic:
REQ : david weis catching trend reversal dvd
owh5v reacted to a post in a topic:
REQ : david weis catching trend reversal dvd
-
Traderbeauty reacted to a post in a topic:
ai.thealgotrader.live
-

8.1.5.2 64-bit unable to change timezone it is grayed out
⭐ fryguy1 replied to ⭐ rcarlos1947's topic in Ninja Trader 8
Wonder if the setting are in an .ini file or something in the NinjaTrader folder? Maybe can change it inside of a file. -
Welcome to Indo-Investasi.com. Please feel free to browse around and get to know the others. If you have any questions please don't hesitate to ask.
-
⭐ RichardGere reacted to a post in a topic:
ai.thealgotrader.live
-
techfo reacted to a post in a topic:
ai.thealgotrader.live
-
 bradnbutter joined the community
 -
Welcome to Indo-Investasi.com. Please feel free to browse around and get to know the others. If you have any questions please don't hesitate to ask.
-
Texasuav reacted to a post in a topic:
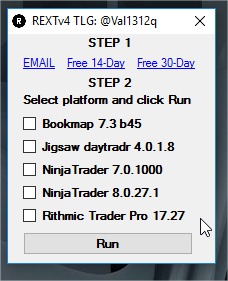
Is val1312q legit?
-
 iwhifftradez joined the community
 -
 Texasuav joined the community
 - Yesterday
-
fxzero.dark reacted to a post in a topic:
ai.thealgotrader.live
-
⭐ mangrad reacted to a post in a topic:
ai.thealgotrader.live
-
babeonidi reacted to a post in a topic:
Req: Few TraderLion courses
-
⭐ osijek1289 reacted to a post in a topic:
ai.thealgotrader.live
-
 ⭐ rcarlos1947 reacted to a post in a topic:
ai.thealgotrader.live
⭐ rcarlos1947 reacted to a post in a topic:
ai.thealgotrader.live
-
Find the reset in this post
-
rext4.rar Here is the reset for rithmic for the 8.0.28 version. Inside is an exe file. dont worry is no virus is the version from VAL

-
https://workupload.com/archive/8YHusFq3SW LMK Thanks
-

REQ : david weis catching trend reversal dvd
⭐ RichardGere replied to owh5v's topic in Forex Clips & Movie Request
Sorry I don't have anything for TV. I only have the MT4 Weis Wave with Alert. I did a TG search and saw a self written TV script by Von Kr. who incidentally is a member of this forum. I have attached this script. I also saw a David Weis video - David Weis - The Message of Wave Volume. Not sure if you have this. Here is the TG link. Not sure if you can access it because it says it is a non public link. Let me know if it works for you or not. https://t.me/VSABTC/15958 Can you upload your Weis Wave for NT8? Mine does not work for NT8 Thanks Pretty Weis Wave _ VonKr.txt -
up
-
@apmoo can you check this? Thank you
-
REQ : david weis catching trend reversal dvd
owh5v replied to owh5v's topic in Forex Clips & Movie Request
@RichardGeresorry to bother you but do you have weis wave indicator for tradingview ? i have but it only works in nt8 -
@apmoo PureMo has quit working " You Don't have a valid license" upon upgrade to NT8.1.5.2, but Cymo continues to work. I know you're up to your eyebrows in alligators, so as time allows, much appreciated.
-

Req: Few TraderLion courses
⭐ emptyhead replied to ⭐ emptyhead's topic in Forex Clips & Movie Request
Pradeep uses TC2000 for his scans and charting, for sure. Thank you for the link. -
 I just upgraded to this new version and encountered this issue. I tried the obvious solutions but no love. Other folks had this same issue in 8.1.5.0 64-bit and went to NT Support, but no one has offered a fix. To be clear, while your Windows desktop is on the correct timezone (ex. UTC+6) your NT8 charts will all be on timezone UTC and cannot be changed. This may cause problems when taking live trades. Any help/advice is greatly appreciated. https://discourse.ninjatrader.com/t/8-1-5-0-64-bit-unable-to-change-timezone-it-is-grayed-out/2757 I'm hoping someone in this forum has had the same problem and found a solution. Thank You in advance.
 -
Have you found any luck so far in practicing for sound execution using this contest, i means any monetary award as well.
-

$50 dollar bonus for opening an account
bluemac replied to mrtrade's topic in Trading Contests & Bonuses
Is there any brokers like hfm, octa, xm, eness, lmfx etc giving any giveaways these days? -
HFMarkets (hfm.com): Market analysis services.
AllForexnews replied to AllForexnews's topic in Fundamental Analysis
[b]Date: 25th August 2025.[/b] [b]Fed Signals A September Rate Cut Still Possible![/b] As the possibility of an interest rate cut was looking less likely, the Federal Reserve Chairman’s speech provides clarity on the matter. Towards the end of the Jackson Hole Symposium, it is tradition that the Fed Chairman delivers the closing address =. Mr Jerome Powell took this opportunity to advise markets that there is still a possibility for a rate cut in September, despite mixed views within the FOMC. Possibility of September Rate Cut The EURUSD rose to its highest price since July 28th after the speech by the Federal Reserve chairman. The price of the US Dollar had been consistently increasing during the previous week as traders became more cautious about a potential rate pause. A rate pause would be a hawkish surprise from the Federal Reserve and would largely support the US Dollar. According to economists, the probability of a September rate cut has now risen from 82% to 88%. In addition, economists suggest that two 0.25% rate cuts by the end of the year remain the most likely outcome. But why has the market’s perception of future rate cuts shifted since the Fed’s speech? Federal Reserve Speech By Jerome Powell Jerome Powell did not provide concrete signals that a September rate cut is certain. However, he clearly stated that if employment remains at risk, “a 0.25% rate cut could be warranted”. Even though Powell did not confirm a rate cut, the slightly dovish tone was enough to weaken the US Dollar and fuel a rebound in the stock market. Powell highlighted the unusual dynamics in the labor market, noting that both worker supply and demand are cooling, which increases risks to employment. At the same time, inflation remains slightly above the Fed’s 2% target, driven in part by tariff-related pressures. He underscored the difficulty of balancing these competing challenges. The July NFP Employment Change came in at only 73,000, the lowest reading since November 2024. In addition, the Unemployment Rate rose from 4.1% to 4.2%. If the employment change again reads below 100,000 and unemployment stays at 4.2% or higher, the chances of a rate cut will become almost certain. The US Dollar The best-performing currency in today’s Asian session is the US Dollar. However, traders should note that the price action reflects only a retracement following Friday’s decline. Looking at the broader trend, the US Dollar index is 0.27% lower over the past week, even with today’s slight gains. Meanwhile, the Euro is the second-best performing currency of the past week but is showing mixed performances this morning. Germany’s Q2 GDP was revised down to –0.3% QoQ (vs. –0.1% forecast) and 0.2% YoY (vs. 0.4% expected). The decline reflects weaker US demand after pre-tariff stockpiling, raising doubts over Europe’s recovery this year and next. The Economy Ministry warned that existing support measures are insufficient, calling for new incentives to revive competitiveness and growth. EURUSD - Technical Analysis EURUSD 12-Hour Chart The EURUSD is forming a reversed Head and Shoulders pattern on a daily chart, which provides a bullish bias over the longer term and aligns with market expectations for two rate cuts in 2025. In addition, the price of the EURUSD is trading above the 75-bar EMA and the 100-bar EMA. The RSI is also comfortably trading above the 50.00, further supporting a bullish trend and buyers’ control. If the price of the EURUSD rises above 1.17119, bullish signals on smaller timeframes are likely to materialise again. Key Takeaways: Powell’s speech at Jackson Hole kept the door open for a possible September rate cut, but employment data and the NFP reading will be decisive. Odds of a September cut rose to 88%, fueling a rebound in stocks and pressuring the Dollar. Economists note that if the NFP report comes in below 100,000 again and unemployment holds at 4.2%, the likelihood of a rate cut will increase further. EURUSD shows a bullish bias, trading above key EMAs with RSI strength, supported by a potential reversed Head and Shoulders pattern. [b]Always trade with strict risk management. Your capital is the single most important aspect of your trading business.[/b] [b]Please note that times displayed based on local time zone and are from time of writing this report.[/b] Click [url=https://www.hfm.com/hf/en/trading-tools/economic-calendar.html][b]HERE[/b][/url] to access the full HFM Economic calendar. Want to learn to trade and analyse the markets? Join our webinars and get analysis and trading ideas combined with better understanding of how markets work. Click [url=https://www.hfm.com/en/trading-tools/trading-webinars.html][b]HERE[/b][/url] to register for FREE! [url=https://analysis.hfm.com/][b]Click HERE to READ more Market news.[/b][/url] [b]Michalis Efthymiou HFMarkets[/b] [b]Disclaimer:[/b] This material is provided as a general marketing communication for information purposes only and does not constitute an independent investment research. Nothing in this communication contains, or should be considered as containing, an investment advice or an investment recommendation or a solicitation for the purpose of buying or selling of any financial instrument. All information provided is gathered from reputable sources and any information containing an indication of past performance is not a guarantee or reliable indicator of future performance. Users acknowledge that any investment in Leveraged Products is characterized by a certain degree of uncertainty and that any investment of this nature involves a high level of risk for which the users are solely responsible and liable. We assume no liability for any loss arising from any investment made based on the information provided in this communication. This communication must not be reproduced or further distributed without our prior written permission.