⤴️-Paid Ad- Check advertising disclaimer here. Add your banner here.🔥
All Activity
- Today
-
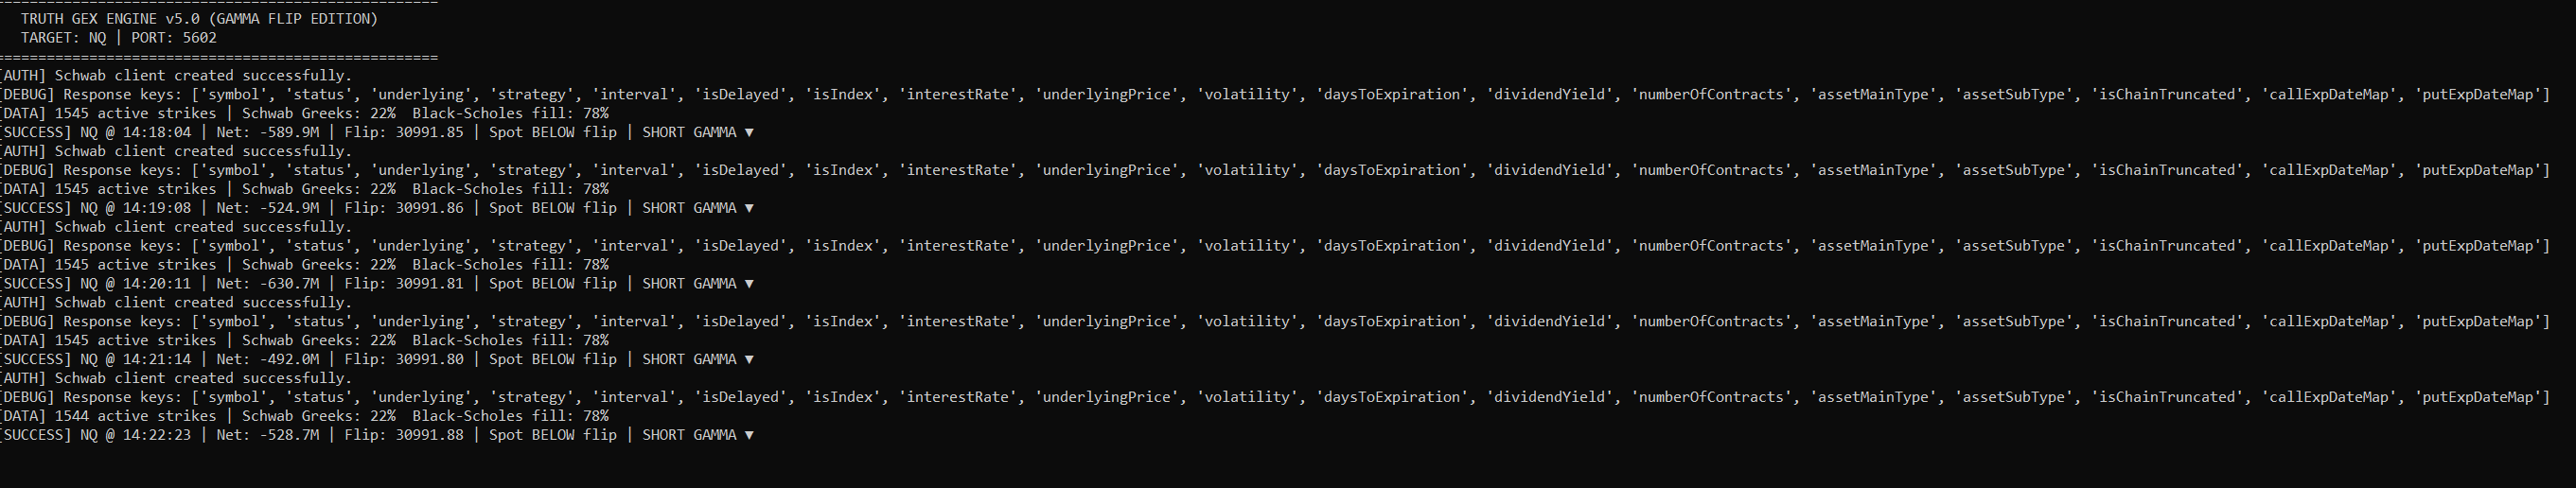
the truth engine runs every 3 mins. Can you provide a parameter in the cs file to control this ? say default 30min and overide 3min or user sets the time in minutes. ? What is the offset price check mark (converted levels ?). Another parameter in the NT script would be % of Option expiration that should be used in the GEX calculation. Currently I am not sure if the engine is using all the 1400s option chain expiry
-
 axsx reacted to a post in a topic:
KimSam NT8 GEX Calc
axsx reacted to a post in a topic:
KimSam NT8 GEX Calc
-
axsx reacted to a post in a topic:
KimSam NT8 GEX Calc
-
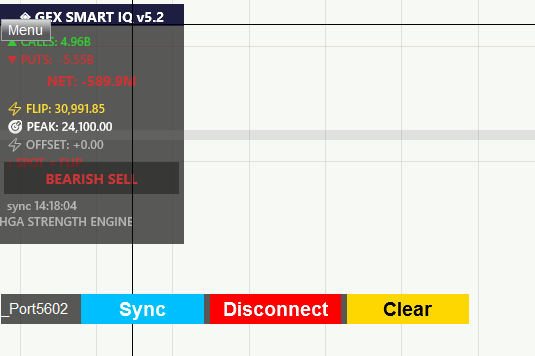
Make sure the Offset price ✔️ checked
-
As u know u can use it on GC NQ ES ... and other .. just change the port .. from the indicator settings ..
-
Good job.. enjoy it🙂
-
 bryandarktuni reacted to a post in a topic:
KimSam NT8 GEX Calc
bryandarktuni reacted to a post in a topic:
KimSam NT8 GEX Calc
-
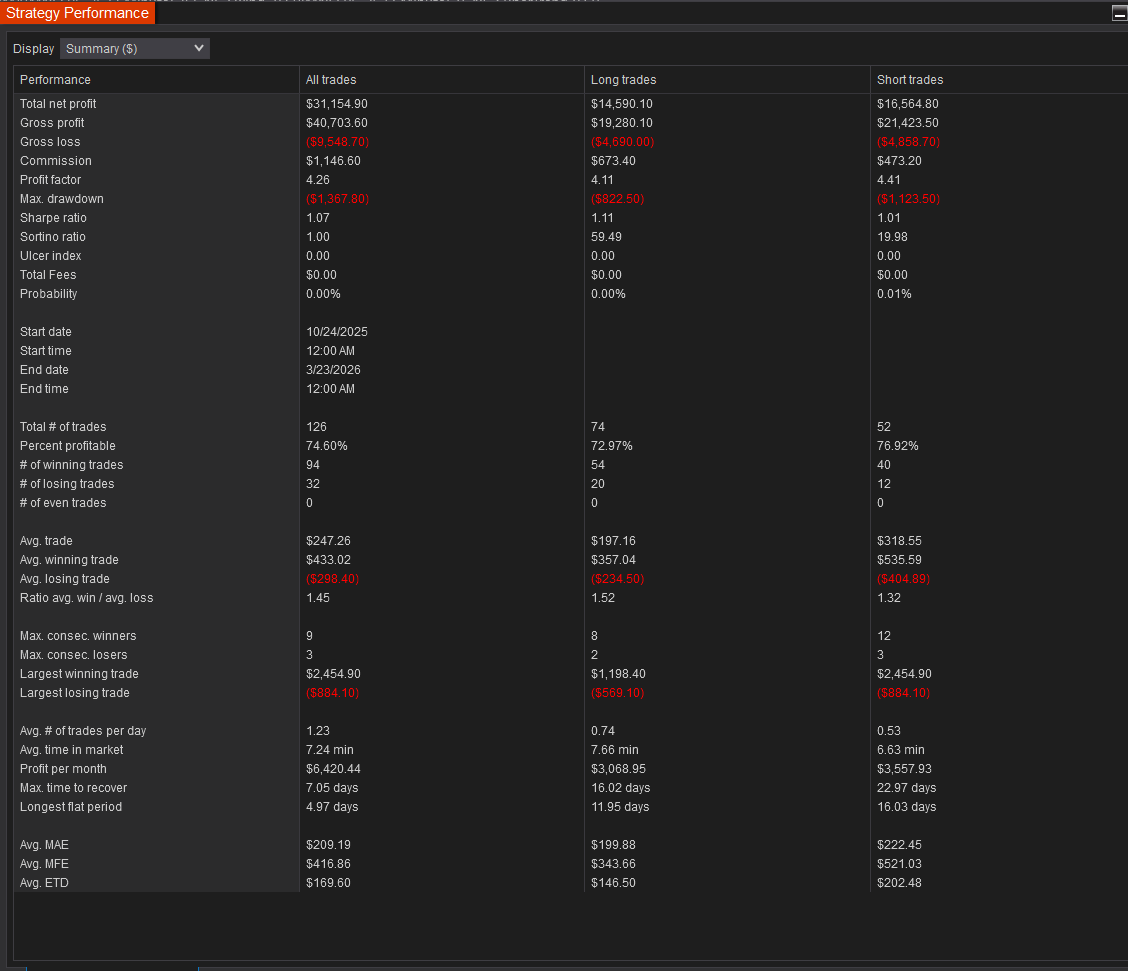
Does anyone have the TEAM template 150 days, as mentioned on Discord?here is a picture of the results but no settings! Thanks

-
-
ignore, working now
-
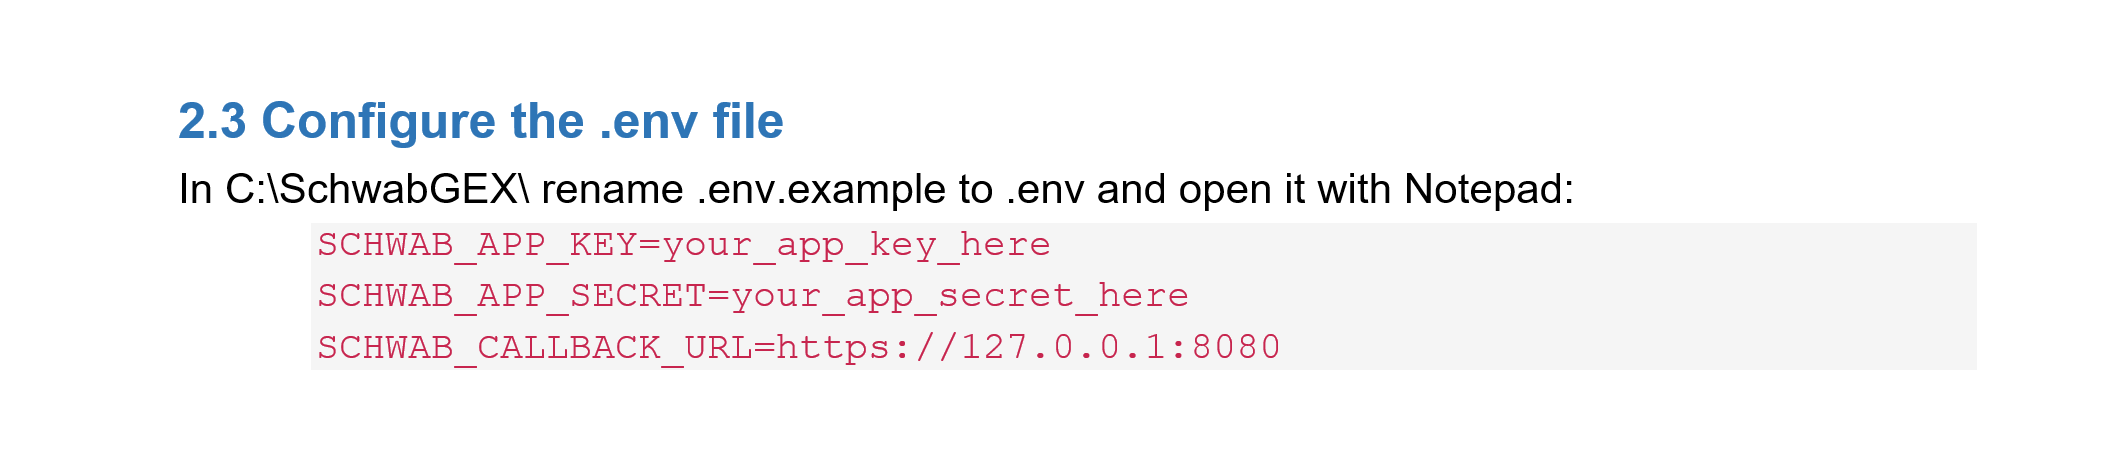
Hi Kimsam, Thank you for the script I had been looking for this for a long time. You managed to write this out in a day. Kudos. Reg setup I have one question, Py files were stored in a C:\ GEX enhancement\ directory. Python requirements were installed using pip sucessfully The .env.example file was renamed to .env and api secret and callback url was added/changed. I am assuming the callback url is what I have setup in the schawb portal and is not always 127.0.0.1.8080. Next the cs file was compiled and added to the nq chart with realtime data. The parameter python script Path now has the path set to C:\ GEX enhancement\Schwab_GEX_Publisher.py Ran the schwab reauth py script and generated the token The popup now shows the correct data and chart lines are also drawn see attachments. Is it possible to send the Truth GEX engine output to a csv file ? I have attached NQ_GEX_Summary_Latest.csv and a sample ndx.png file. If you can enhance this py script to output this would be fantastic. A valuable enhancement. pl check the files attached. NQ_GEX_Summary_Latest.csv Finally got it working. Amazing early christmas gift !!!!!
-
omni69 reacted to a post in a topic:
Fixed ... QPilotPro_1_0_1_0
-
axsx reacted to a post in a topic:
KimSam NT8 GEX Calc
-
ampf reacted to a post in a topic:
Pack 205 NinZa Indicators
-
very interesting….plots some horizontal lines at round numbers!I created a simple round numbers indicator,does the same thing as gex,without going to harward to learn phyton and how to get api’s from brokers 😁 RoundNumbers.zip
-
Thank you for sharing the file. But it's asking username and password. Do you have cracked files for this sir
-
jquiroz75 reacted to a post in a topic:
KimSam NT8 GEX Calc
-
The .exe installs all files templates, work space, and indicators. I think it does some sound files also.
-
Traderbeauty reacted to a post in a topic:
KimSam NT8 GEX Calc
-
⭐ htn4653 reacted to a post in a topic:
Trade Grade / Collapsible Panel Update
-
sunsay reacted to a post in a topic:
KimSam NT8 GEX Calc
-
kimsam
-
pwd mate? thank you for your efforts
-
In ninjatrader: new---> ninjascript editor and press the compile button
-
THE GOAT
-
im sharing my own script please .. you need some basic Payton edit logic .. dont ask stupid questions .. ask gpt for help .. https://workupload.com/file/CJ7ZDjxyxt2 i will add more info soon ...
- 10 replies
-
- 11
-
-
-
@Bene what do you mean compile?
-
is this the standalone version? I am fine with the NT add-on posted above. I have the indicators and bots installed. Just want to know their correct settings. I did watch some of their YT videos
-
Here you go. https://workupload.com/file/3tNHegzeXbD
-
If you have Windows Pro version and install it using Sandbox. You get all the files and everything. Kill the sandbox and everything is gone. https://workupload.com/file/4N64akHRFrn Windows Pro is worth having and very cheap to buy. https://www.productkeys.com/product/windows-10-professional-retail/
-
can you share the uneducated stand-alone version 8.5.2.2 pls
-

roboforex Market Fundamental Analysis by RoboForex
RBFX Support replied to RBFX Support's topic in Fundamental Analysis
What lies ahead for USDCAD: oil and the Bank of Canada versus the US Fed The USDCAD pair continues its correction while waiting for fresh drivers. Quotes are hovering around 1.3725. Discover more in our analysis for 23 March 2026. USDCAD forecast: key takeaways Rising oil prices increase export revenues and capital inflows into Canada On 18 March 2026, the Bank of Canada kept the key rate at 2.0% The US Federal Reserve left the rate unchanged at 3.75% Fundamental analysis Today’s USDCAD outlook favours the Canadian dollar: after the correction, the pair may form a new downward wave, with quotes currently hovering around 1.3725. The main driver today is the escalation around the Strait of Hormuz. US President Donald Trump is considering a ground operation to seize Iran’s Kharg Island, a key oil hub. This statement pushed oil prices above 100.00 USD per barrel. RoboForex Market Analysis & Forex Forecasts Attention! Forecasts presented in this section only reflect the author’s private opinion and should not be considered as guidance for trading. RoboForex bears no responsibility for trading results based on trading recommendations described in these analytical reviews. Sincerely, The RoboForex Team -
Market Technical Analysis by RoboForex
RBFX Support replied to RBFX Support's topic in Technical Analysis
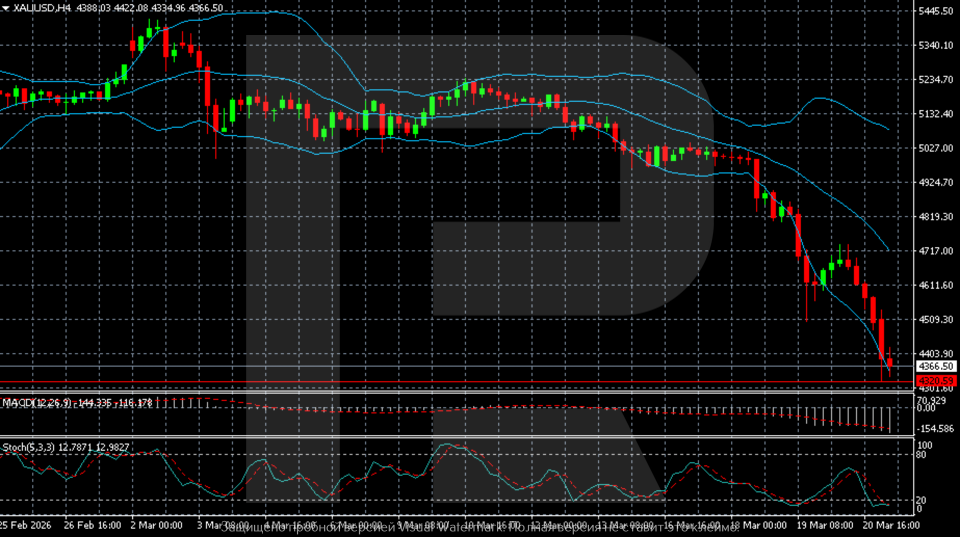
Gold (XAUUSD) plunges: the Middle East has changed everything Gold (XAUUSD) prices fell to 4,366 USD as markets fear accelerating inflation and a prolonged pause in central bank policy. Discover more in our analysis for 23 March 2026. Technical outlook The gold (XAUUSD) H4 chart shows that after forming a local peak near 5,400, the market shifted into a sustained decline. Since early March, the structure has turned bearish, with lower highs and lower lows forming, indicating stronger selling pressure. Gold prices are falling, and the downtrend is still accelerating. Read more - Gold Forecast Attention! Forecasts presented in this section only reflect the author’s private opinion and should not be considered as guidance for trading. RoboForex bears no responsibility for trading results based on trading recommendations described in these analytical reviews. Sincerely, The RoboForex Team
-

HFMarkets (hfm.com): Market analysis services.
AllForexnews replied to AllForexnews's topic in Fundamental Analysis
Date: 23rd March 2026. How Did the Fed Prompt Weaker Stocks and a Stronger US Dollar? The US is attempting to reopen the Strait of Hormuz by escalating the conflict with a 48-hour ultimatum to Iran. President Trump himself made the announcement that Iran has two-days to open the Strait of Hormuz, but the exact expiry is not known. According to the report, the ultimatum will expire at some point today. If they did not comply, the US would attack Iran’s energy infrastructure, starting with power plants. Analysts see this as a major escalation in the conflict which is likely to trigger a stronger retaliation from Iran. Security and defence analysts, such as Michael Clarke, advise investors that if the US does escalate, Iran will likely increase its attacks on oil infrastructure across Qatar, Saudi Arabia, and the UAE. How are markets reacting? Crude Oil - Trump’s Ultimatum Pushes Oil Prices Higher HFM - Crude Oil Daily Chart Towards the end of last week, oil prices were attempting to rise as investors grew concerned about significant damage to energy infrastructure in the Persian Gulf region. These concerns stemmed from the escalation of the US-Iran conflict. Even though the asset did not rise to new highs, the price saw limited downward price movement and generally remained elevated. However, Crude oil prices are finding momentum this morning due to the new US ultimatum to Iran. Further supporting the bullish momentum, Qatari officials told journalists that the country had lost 17% of its liquefied natural gas (LNG) production capacity. They added that restoring this capacity could take up to five years. In addition, Israeli Prime Minister Benjamin Netanyahu announced the need for a ground operation. This could further escalate geopolitical tensions. The US has tried various moves attempting to bring oil prices down, such as escorting tankers out of the Strait of Hormuz. The latest attempt was the White House’s willingness to partially lift sanctions on oil produced in the Islamic Republic. US Treasury Secretary Scott Bessent noted that this decision could be made within the next three to four days. For this reason, volatility continues, with many analysts advising the price of Crude Oil could remain high for some years. In terms of technical analysis, the price is forming an ascending triangle, which points toward higher prices. In addition to this, on smaller timeframes, the price continues to form higher highs and trade above major moving averages. XAUUSD (GOLD) - Middle East Countries Sell Some Gold Reserves Gold had its worst week in almost 40 years with the asset declining for four consecutive days, totalling more than 17%. Gold prices are declining for three main reasons. The first reason is that investors believe global central banks will increase interest rates over the next 12-months, which would make the commodity less attractive. Another factor weighing on Gold prices is that several Middle Eastern countries are selling part of their Gold reserves to offset lost income from oil sales. By selling Gold reserves, these countries are supporting their fiscal needs. The third reason for the downward pressure is related to Gold’s high price. According to analysts such as Jefferies, markets are unwilling to buy Gold at such high prices in these weak market conditions. Although Gold is a safe-haven asset and a well-known hedge against inflation, its high price makes it less attractive. HFM - Gold Daily Chart Gold prices trade at their lowest level since mid-November 2025. Support levels can be seen for the commodity at $3,885, however, the main psychological price for investors remains $4,000. If the US Dollar Index does not rise above 100.00, the possibility of Gold rebounding increases. Key Takeaway: Trump gave Iran a 48-hour deadline to reopen the Strait of Hormuz. Oil prices are rising as traders price in higher supply disruption risks. Qatar’s LNG capacity loss adds to fears of prolonged energy shortages. Gold remains under pressure from rate expectations, reserve sales, and high prices. Always trade with strict risk management. Your capital is the single most important aspect of your trading business. Please note that times displayed based on local time zone and are from time of writing this report. Click HERE to access the full HFM Economic calendar. Want to learn to trade and analyse the markets? Join our webinars and get analysis and trading ideas combined with better understanding of how markets work. Click HERE to register for FREE! Click HERE to READ more Market news. Michalis Efthymiou HFMarkets Disclaimer: This material is provided as a general marketing communication for information purposes only and does not constitute an independent investment research. Nothing in this communication contains, or should be considered as containing, an investment advice or an investment recommendation or a solicitation for the purpose of buying or selling of any financial instrument. All information provided is gathered from reputable sources and any information containing an indication of past performance is not a guarantee or reliable indicator of future performance. Users acknowledge that any investment in Leveraged Products is characterized by a certain degree of uncertainty and that any investment of this nature involves a high level of risk for which the users are solely responsible and liable. We assume no liability for any loss arising from any investment made based on the information provided in this communication. This communication must not be reproduced or further distributed without our prior written permission. -
How are you guys finding this? Are they planning on making this an NT8 strategy too, does anyone know? Would like to dial this in somewhat using the NT8 strategy analyzer.