⤴️-Paid Ad- Check advertising disclaimer here. Add your banner here.🔥
All Activity
- Past hour
-
 ⭐ SignalTime reacted to a post in a topic:
SMM_Dots
⭐ SignalTime reacted to a post in a topic:
SMM_Dots
-
⭐ SignalTime reacted to a post in a topic:
quantvue.io
-
⭐ SignalTime reacted to a post in a topic:
quantvue.io
-
⭐ SignalTime reacted to a post in a topic:
Market Replay Downloader
-
⭐ SignalTime reacted to a post in a topic:
NINZA INDIES - FREE OF CONSUSION - FRUSTRATION - HEADACHES - TIME
-
⭐ SignalTime reacted to a post in a topic:
NINZA INDIES - FREE OF CONSUSION - FRUSTRATION - HEADACHES - TIME
-
⭐ SignalTime reacted to a post in a topic:
Affordable Indicators - Accounts Dashboard Suite
-
⭐ ajeet reacted to a post in a topic:
Market Replay Downloader
-
 pygmalion5000 reacted to a post in a topic:
https://thetradeengine.com/ needs to educate
pygmalion5000 reacted to a post in a topic:
https://thetradeengine.com/ needs to educate
-

Affordable Indicators - Accounts Dashboard Suite
iamhktr replied to ScoobyDoo's topic in Ninja Trader 8
bump x2 -
pygmalion5000 reacted to a post in a topic:
www.whaletrailtrading.com
- Today
-
 It's possible to automate this kind of indicator with dll protected ?
 -

lastest version predator traesaber version 3.6.0.0.0 need to edu
vonita replied to TRADER's topic in Ninja Trader 8
Hi. Can someone help me... Can't make neither version to work... PredatorXOrderEntry_LT_V3.1.1.1 or PredatorXOrderEntry_LT_V3.6.0.0 they ask for registration thanx -
Turn your monitor upside down and the right side will be good then.
-
Funny how much of these look great in the video then when you try them out you never get the same results. After a while of trying each one of these they all almost look the same also.
-
 One thing to note if you don't get the error at the bottom right of the screen that it is unlicensed then look at the logs in ninja and see if something failed to load at bar #. you might have to reload the history, reload the indicator 1 or 2 times, turn on tick replay, have level 2, etc. Maybe you have to add more bars to look back. Each one of these indicators requires some different things. If you are not seeing bad license then it probably another problem. By looking at the logs in ninja trader you should be able to what the issue is. Example I know a couple that require Level2 and tick replay on to show any signals on the chart.
 -
thx a lot , i can copy past this folder inside the custom file
-
I will be resuming the development of this footprint shortly.. I already have a clear idea of what to implement, but before moving forward, I’d like to get some additional input. So, please share your proposals—don't be vague. Explain your ideas thoroughly, including attached images if possible

-
To help others see at a glance the content of all subfolders of a numerous files share before they download it so they know what to expect file explorer > open top most folder > type cmd in address bar and hit enter > in cmd window type this and hit enter: dir /b/s/o > list.txt Then open the newly generated list,txt file and share the folders/files list text log Export list of files, folders including subfolders to a txt file from command line.mkv
-
 @Ninja_On_The_Roof You Have Flex TPO By ninza
 -
 Definitely a challenge though, to find 1 size that fits all. Especially now that Ninza knows their products are flying off the shelves...unpaid. Quite certain they would revamp their codes and resources to combat the leakage.
 -
 You definitely didn’t fail us. We truly appreciate your work and the time you’ve taken to help us. We’re genuinely grateful that you’ve been supporting us and looking into this. It really means a lot. Thank you for being patient with us and for guiding us through it 🙏
 -
Hmm...strange because I actually checked one by one right after I imported them.
-

Market Technical Analysis by RoboForex
RBFX Support replied to RBFX Support's topic in Technical Analysis
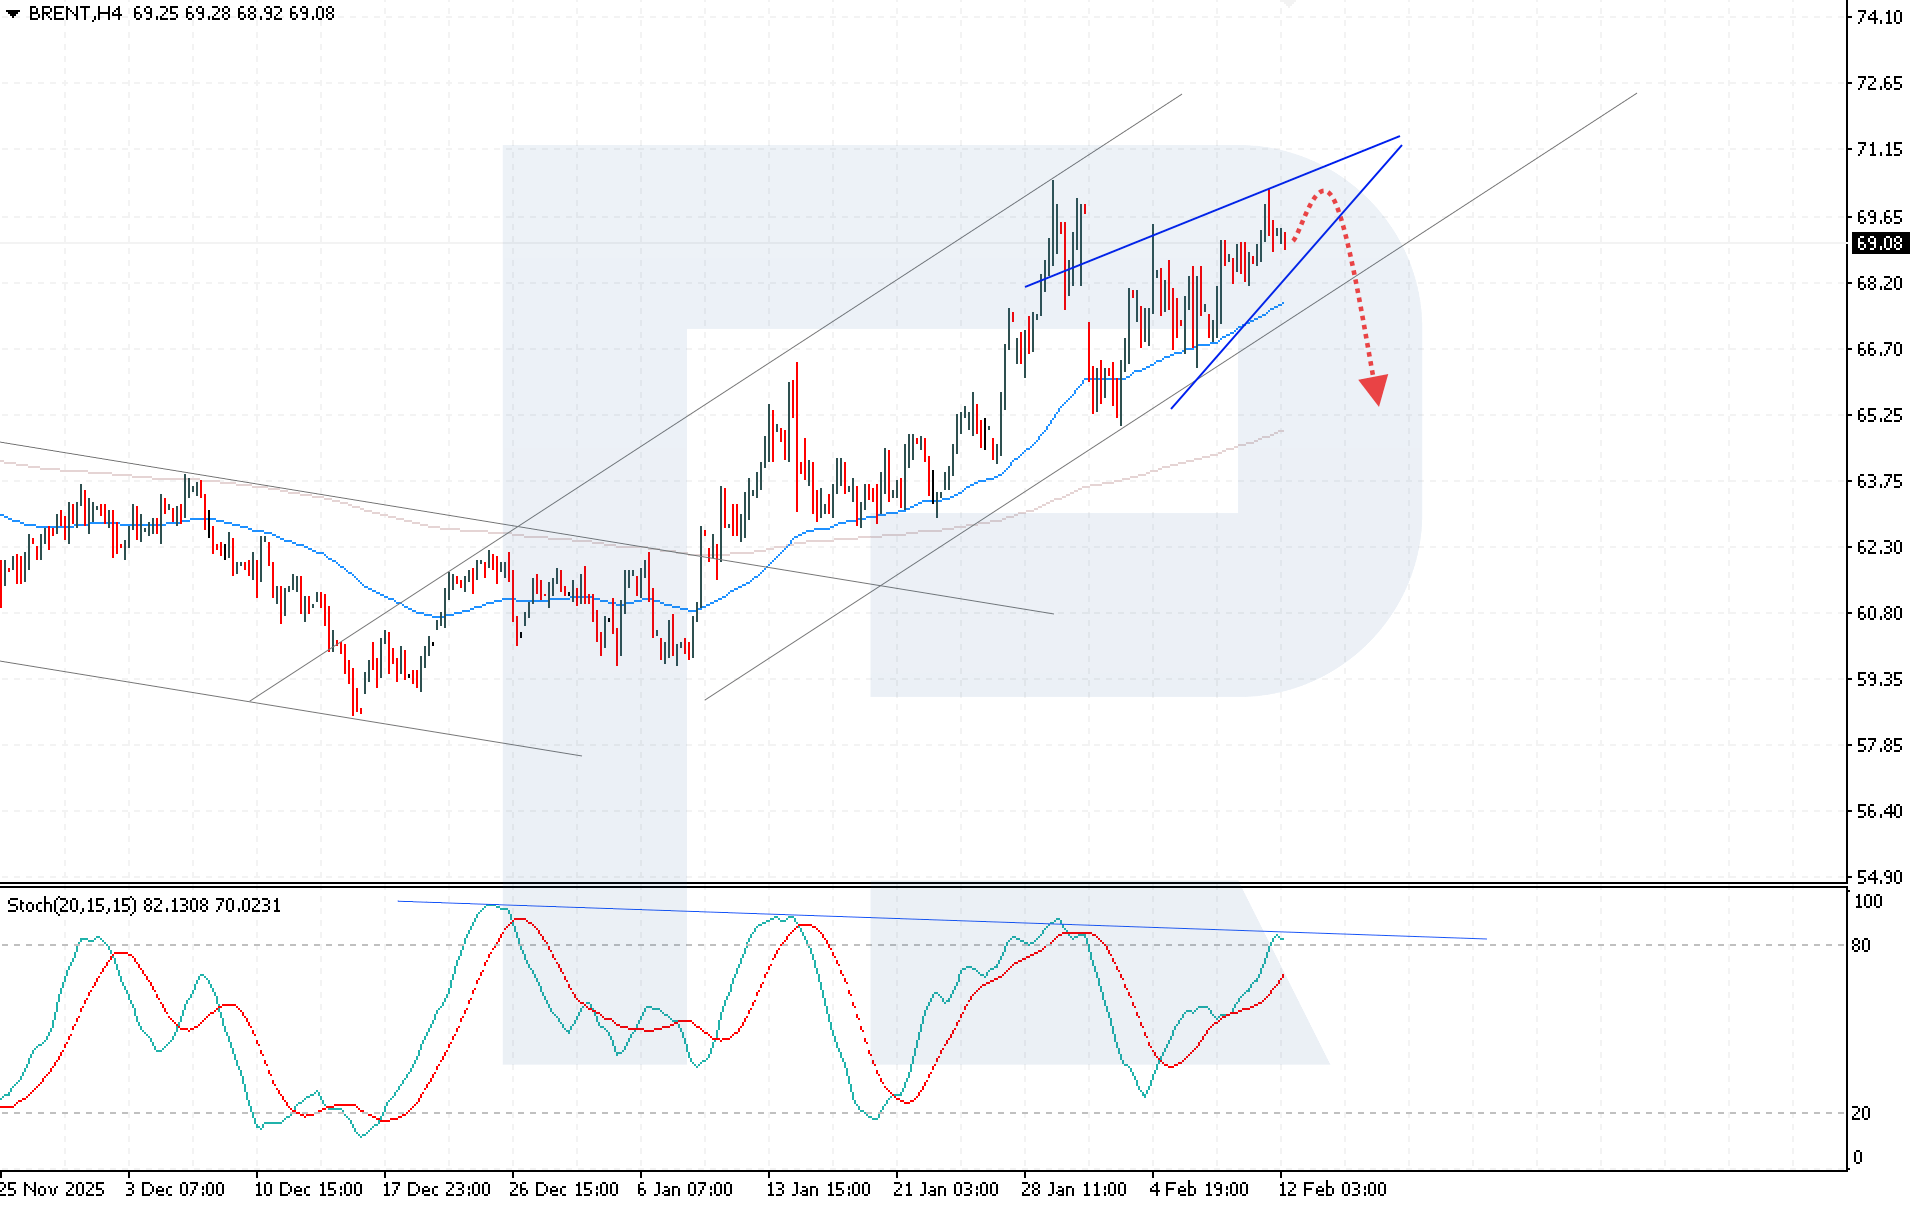
Brent forms a reversal at key resistance Brent quotes are showing signs of a reversal amid technical signals and negative US oil inventory data, currently trading at 69.08 USD. Find more details in our analysis for 12 February 2026. Brent technical analysis Brent quotes are correcting within a developing Wedge reversal pattern. Although prices remain above the EMA-65, the risks of further downside movement remain high. The technical and fundamental outlook for Brent highlights reversal risks amid a Double Top pattern. Read more - Brent Forecast Attention! Forecasts presented in this section only reflect the author’s private opinion and should not be considered as guidance for trading. RoboForex bears no responsibility for trading results based on trading recommendations described in these analytical reviews. Sincerely, The RoboForex Team
-
roboforex Market Fundamental Analysis by RoboForex
RBFX Support replied to RBFX Support's topic in Fundamental Analysis
XAUUSD continues to rise: why the Fed will not be able to weaken gold in March Employment growth and positive US economic data failed to provide sufficient support to the USD, while XAUUSD quotes continue to rise and are testing the 5,070 USD level. Discover more in our analysis for 12 February 2026. XAUUSD forecast: key takeaways US initial jobless claims: previously at 231 thousand, projected at 222 thousand Change in US Nonfarm Payrolls: previously at 48 thousand, currently at 130 thousand XAUUSD forecast for 12 February 2026: 5,280 Fundamental analysis Today’s XAUUSD forecast indicates that gold prices continue their upward trajectory, trading near 5,070 USD per ounce. US initial jobless claims reflect the number of people who filed for unemployment benefits for the first time during the previous week. This indicator measures the labour market climate, with an increase in initial jobless claims indicating rising unemployment. RoboForex Market Analysis & Forex Forecasts Attention! Forecasts presented in this section only reflect the author’s private opinion and should not be considered as guidance for trading. RoboForex bears no responsibility for trading results based on trading recommendations described in these analytical reviews. Sincerely, The RoboForex Team -

HFMarkets (hfm.com): Market analysis services.
AllForexnews replied to AllForexnews's topic in Fundamental Analysis
Date: 12th February 2026. Strong NFP Data Surprises Markets, Lifts The US Dollar. The latest US employment data came as a shock to market participants. Price action during and after the announcement shows that investors are unsure how to price in the new figures. This is why most assets saw a strong impulse wave, succeeded by a full correction. The only asset which saw a clear direction was the US Dollar. Strong Economic Data Boosts US Sentiment Analysts were previously expecting January’s employment data to be similar to the previous months. Over the past six months, the US economy, on average, has added 40,000 employed individuals on a monthly basis. Conversely, the employment data read significantly stronger than in previous months and the current projections. The Non-Farm Payroll Change read +130,000, double previous expectations. The NFP Change is the highest reading since July 2025. The Average Hourly Earnings also rose 0.4%, higher than the previous month, where earnings only rose 0.1%. Lastly, the US Employment Rate fell from 4.4% to 4.3%. As a result, the US employment sector remains resilient and even shows some signs of expansion. This, in turn, supports the view of the majority of market participants that the US Federal Reserve will continue the pause in the “dovish” cycle and adjust the cost of borrowing by -25 basis points only once in 2026. Thus, the probability of the indicator remaining in the 3.50% to 3.75% range at the March 18th meeting is now 94%, according to the Chicago Mercantile Exchange (CME) FedWatch Tool. Previously, the possibility of a pause was 79%. According to the former senior adviser at the Federal Reserve Bank of San Francisco, Tim Mahedy told journalists, “It absolutely complicates the argument for lower rates”. “The January data were really strong”. The US Dollar The US Dollar was one of the only assets which saw momentum remain in favour of the original impulse wave. During the Asian session and the first half of the European session, the US Dollar Index was weakening. After the positive NFP results, the currency rose 0.55%. After the original spike, the currency had seen retracements and volatility. However, the index 0.12% higher than the open price and 0.45% higher than the day’s low. On Thursday, the price of the index continues to trade higher. The US Dollar is the best-performing currency of the day alongside the New Zealand Dollar. The currency is likely to continue obtaining potential support from the employment data. However, this afternoon’s Weekly Unemployment Claims will renew volatility levels. If the weekly claims are lower than expectations, the Dollar potentially may rise again. HFM - USDX 15-Minute Chart S&P 500 The stock market at first saw a surge in buyers after the announcement of stronger employment data. This spike is most likely due to the sentiment increasing towards the US economy and its continuing economic expansion despite tariffs and new policies. However, the price was quick to correct downward and ended the day lower by 0.06%. The stock market continues to struggle to break through the resistance level which has formed over the past week. For example, at $6,988 for the S&P 500 and $25,367 for the NASDAQ. A key factor which traders may be waiting for in order to obtain confirmation before trading is tomorrow’s CPI release. Analysts are expecting the US inflation rate to decline from 2.7% to 2.5%. If inflation does not decline, sentiment towards the stock market may fall as the Fed will likely take a hawkish stance past March. However, as the price of the S&P 500 moves sideways, the price continues to remain above most moving averages on the 2-hour chart. Though the price is close to obtaining a bearish signal from the MACD index. The next trend will primarily depend on tomorrow’s Consumer Price Index. HFM - USA500 15-Minute Chart Key Takeaways: US jobs data strongly beat expectations, with NFP at +130K, higher wages, and lower unemployment, signalling a resilient labour market. Fed rate cut expectations declined, with markets now pricing a 94% probability of a pause in March and only one 25bps cut in 2026. The US Dollar strengthened clearly, gaining momentum after the data and outperforming most major currencies. Stocks struggled despite strong data, with the S&P 500 facing resistance as investors await tomorrow’s CPI release for direction. Always trade with strict risk management. Your capital is the single most important aspect of your trading business. Please note that times displayed based on local time zone and are from time of writing this report. Click HERE to access the full HFM Economic calendar. Want to learn to trade and analyse the markets? Join our webinars and get analysis and trading ideas combined with better understanding of how markets work. Click HERE to register for FREE! Click HERE to READ more Market news. Michalis Efthymiou HFMarkets Disclaimer: This material is provided as a general marketing communication for information purposes only and does not constitute an independent investment research. Nothing in this communication contains, or should be considered as containing, an investment advice or an investment recommendation or a solicitation for the purpose of buying or selling of any financial instrument. All information provided is gathered from reputable sources and any information containing an indication of past performance is not a guarantee or reliable indicator of future performance. Users acknowledge that any investment in Leveraged Products is characterized by a certain degree of uncertainty and that any investment of this nature involves a high level of risk for which the users are solely responsible and liable. We assume no liability for any loss arising from any investment made based on the information provided in this communication. This communication must not be reproduced or further distributed without our prior written permission. -
I recall it posted the v29 last year but folks couldn't get it working on their PCs. One note, I have always been using the official version of NT8. Not a edu or fixed one. This factor alone, might also be one of the reasons people get difficulties and different results.
-
Looks like they already have new version.
-
Yes, deleted everytime for me.
-
Their video showed awesome trades, one right after another. Yet, reality aint so though, is it. Wouldn't you guys agree?🤗
-
Ohh darn, then I have failed you guys. But just a stupid question though, when you say you reinstall your NT8, do you go into the document folder and delete the NT8, prior to reinstalling a fresh one?
-
i reinstall many time, i tested only ZoneGPT & Pana. and pana didn't show in the chart.
-
Forex pairs indicate the value of one currency compared to another, expressing how much of the quote currency is required to purchase the base currency. They are categorized as major, minor, or exotic pairs. Common examples include EUR/USD, USD/JPY, and GBP/USD, traded based on economic indicators and market trends.
-

Is trading analysis or just pure speculation?
CRYPTOHUSTLER replied to Bambang Sugiarto's topic in General Forex Discussions
Trading is a mix of structured analysis and speculation. Traders often rely on charts, financial reports, and market trends to support their decisions. Still, markets are influenced by emotions, news, and unexpected events. Even well-researched strategies carry uncertainty, meaning speculation and risk remain inherent aspects of trading activities. -
Bitcoin could approach 10,000 by autumn if market conditions, investor confidence, and broader economic factors align favorably. However, cryptocurrency markets remain highly volatile, so certainty is impossible. Smart investors consider diversification. Innovative projects such as LMGX Token are attracting interest through real-world utility and community-driven development within the evolving digital asset landscape.