⤴️-Paid Ad- Check advertising disclaimer here. Add your banner here.🔥
All Activity
- Past hour
-
 axsx reacted to a post in a topic:
KimSam Ai trading system on ninjatrader
axsx reacted to a post in a topic:
KimSam Ai trading system on ninjatrader
-
https://discord.gg/tC8ZqPjX /
-
Kermit 1981 reacted to a post in a topic:
KISS strategy
-
TRADER reacted to a post in a topic:
Pivot_Point_STRAT proptradingindicatorscom
-
It was not opening sir
- Today
-
You would have to ask the owner Chidi.
-
I wouldn't mind giving this a try. I do some coding experience and might be able to help. I normally trade ES if you wouldn't mind sharing I will be more then happy to take a look.
-
The calculation of levels looks like is wrong I compared with others. Kimsam can you confirm that?
-
@Minigems @kimsam Thanks 🙏
-
Ninja_On_The_Roof reacted to a post in a topic:
Pivot_Point_STRAT proptradingindicatorscom
-
Ninja_On_The_Roof reacted to a post in a topic:
Pivot_Point_STRAT proptradingindicatorscom
-

Pivot_Point_STRAT proptradingindicatorscom
Ninja_On_The_Roof replied to TRADER's topic in Ninja Trader 8
In my personal view, if you use Renko 70/10 setting, you might wanna play with A+ Jiggle and Delta indicators. You just need to hit a couple times per day with the Jiggle's signals and be gone. 🤗 But then I guess, you just wanna trade with automated stuff so that might not be of your interest though. -
MedIce reacted to a status update:
Welcome to Indo-Investasi.com. Please feel free to browse around and get to know the
-
Hi all! Im wondering if anyone with a bit of spare time and coding experience would be able to help me out. I would like to add plots to this indicator so I can grab the plots/outputs and build a strategy . I've tried other similar indicators but I find this one works very well being fractal. Many thanks, -Dragon market-structure-choch-bos-fractal.zip
-
-
There's a bit of a delay… because at first I integrated it with my custom strategy, and now I'm trying to make it general.
-
I guess i will just use default settings for now: https://ibb.co/93Y1PyRq
-
Can you upload the link of their discord
-
 Ninja_On_The_Roof reacted to a post in a topic:
House Of Live Trades
Ninja_On_The_Roof reacted to a post in a topic:
House Of Live Trades
-
kkreig reacted to a post in a topic:
House Of Live Trades
-
Appreciation for your honesty
-
Ninja_On_The_Roof reacted to a post in a topic:
KISS strategy
-
I know most "traders" out there, or all the so called trading gurus, all the third party vendors, or those trading Discord and Youtube services, usually post only their green numbers, big and massive winners but very seldom, post their red numbers, big and massive losses. It is how it is! Nobody wanna see losses. It is very sad and depressing. But it is the true nature of the game that we all are playing. Trading. Just look at Youtube for all the NinzaCo or NinjaCator's indicators. They all make it look like trading is so easy, so effortlessly and no sweats or tears. Winners after winners. But here I am, I have really nothing to hide from you. I don't sugar coat craps when it comes to the real trading. Even the best traders have losses, or even losing streaks. But I wont and never will say, that I am one of the "best" traders nor I am a guru! It was just one of those days, when everything just went nuts and all wrong. Even when all the stars were aligned, all the indicators agreed, hugged and kissed with one another. Everything just looked so perfect on the charts. Yet, sh*t still went opposite for you, every single trade that you entered and made. Just pure insanity, right? All 5 of my prop firm accounts. Ouch!🤣 Now, I got some serious work to do when Monday comes. But, definitely not revenging. Not FOMO'ing. Not forcing trades. Just and just recouping my losses! One good thing was that, my trades for Options were green, so it was kinda a break even thingie! Yes, I also trade options, calls and puts with TOS.
-
Can I share this system?
-
P.S: If you want to actually learn execution, there is one place that can teach you that and it's the TradeLikeAZombie Discord - and guess what, it doesn't cost a thing. Just risk management, time and practice.
-
Didn't even notice that Lux folks have been very busy. Very "impressive" that they have their products and indicators for all major platforms out there such as Tradingview, NT8, TOS and MT4.🤔 And if, they also have it for Sierra chart or TradeStation, I would go nuts and end up in a mental institution.🤪
-
Not so sure about the issue of repainting for the IFVG indicator since I do not use it. However, the Orderblock one is actually decent. All I do is to be patient, to be disciplined. Sit there and wait until price reaches either the Premium or the Discount zones, or at least close to them, then I move my fingers. Enter long when price is at the Discount zone and enter short when price is at the Premium zone. I do nothing when price is around the Equilibrium zone. At times, since these 2 zones are critical areas, after you entering, price might just be playing with you. Making you think or feel like, it isnt going your way as intended. Manipulation at hand, messing with your brain, your emotions, trying to get you to panick and exit your trade, then only to reverse it back into the original direction as it should be. Long at Discount and Short at Premium. But have faith and trust it, your Orderblock indicator, it shall work out. Obviously, do have your stoploss and target profit in place. Don't be greedy!
-
My 5 cents are always Bookmap's Community / TomB's TraderLab, if you want to understand the money flow. It won't neccessary teach you execution, but more how to align with the markets. Hope it's useful. In terms of software, plenty of OrderFlow software packages - at the moment can't even say one has an edge above another. Depends what you want to see. For me is follow the L2 liquidity, see those orders come in (like actually execute) at the price points, watch how the price reacts.
-
All I can say is...Wow!🤪 Speechless! If only and only, we could actually "predict" the moves, we would all be filthy rich! Right? And, just like in other post, if you had this in your possession, would you sell it?🤔 Regardless...Pretty amazing though. "A.I" stuff! I am sure you have already tried it. How was it? Was it any good at all? Did it predict well, in your opinion or experience with it?
-
For someone who is starting or has no profit I always recommend Nikos Trading Academy - I have seen their advanced course for free somewhere on telegram (and I have nothing to do with them ) - you can also check channel on YT .(watch only Nikos videos and webinars ) Using their concept (mostly top down approach on renko+HA) I change 3k into nearly 100 k om MT4 . in less than 1 year . When you add to that order flow +market&volume profile you will be more precise . To tell you the truth I'm still using MT4 because can't find something similar to renko from OVO(MT4) for NT8 -also quick change between timeframes (renko) is on MT4 very comfortable .
-
Dont give up! Keep fighting! Just need a different kind of mentality in regards to trading and a much better perspective when it comes to taking profits. In reality, we are just little fish in the pond, little retailers. We aint move the market. Big and giant whales do. We just need to piggyback with them and, take a little small chunk out of their moves, one at a time. It shall add up over time. No need really, to aim for a big homerun or to catch the whole move. If it happens so, then great. Consider it a big bonus for the day. The more you expose yourself out there in the market trading, the more risk you shall add on and sooner or later, you will probably give everything cent back, and more in the end. I know this well and I am quite sure, many others too. Stop when you really need to stop and turn off your PC. Walk away. Enjoy other important parts of your life. This will prevent you from overtrading, forcing trades and that crazy FOMO thingie. Trading can be addictive. You just cant stop. Friday comes and you already are itchy for Sunday to show up so you can restart trading. Cant even wait for Monday. Sincerely good luck to you and your trading journey. It aint easy. We all know that very well. And, you are right. If I ever invented a bot or an indicator that brings me a boat load of money each day, I will not, ever and ever, sell it or even advertising it anywhere. I will certainly keep it a secret from all the Wallstreet boys and bring it with me to my grave! Just an honest truth!
-

roboforex Market Fundamental Analysis by RoboForex
RBFX Support replied to RBFX Support's topic in Fundamental Analysis
Gold (XAUUSD) in positive territory, but the pause looks fragile Gold (XAUUSD) prices rose to 4,800 USD. A catastrophe in the Middle East has not happened so far. Find more details in our analysis for 8 April 2026. XAUUSD forecast: key takeaways Gold (XAUUSD) is in positive territory, but there are still too many geopolitical risks Since the start of the Middle East conflict, gold has fallen by 25% from its peak values XAUUSD forecast for 8 April 2026: 4,700 or 4,850 Fundamental analysis Gold (XAUUSD) rose by more than 2% on Wednesday, moving above the 4,800 USD per ounce mark and continuing its recovery. The market received support from Donald Trump’s statements about postponing strikes on Iran’s civilian infrastructure for two weeks to complete negotiations. Less than two hours before the set deadline, Trump announced a bilateral ceasefire on condition that the Strait of Hormuz is reopened. He also reported receiving a 10-point proposal from Iran, which he described as a working basis for further negotiations. RoboForex Market Analysis & Forex Forecasts Attention! Forecasts presented in this section only reflect the author’s private opinion and should not be considered as guidance for trading. RoboForex bears no responsibility for trading results based on trading recommendations described in these analytical reviews. Sincerely, The RoboForex Team -
Market Technical Analysis by RoboForex
RBFX Support replied to RBFX Support's topic in Technical Analysis
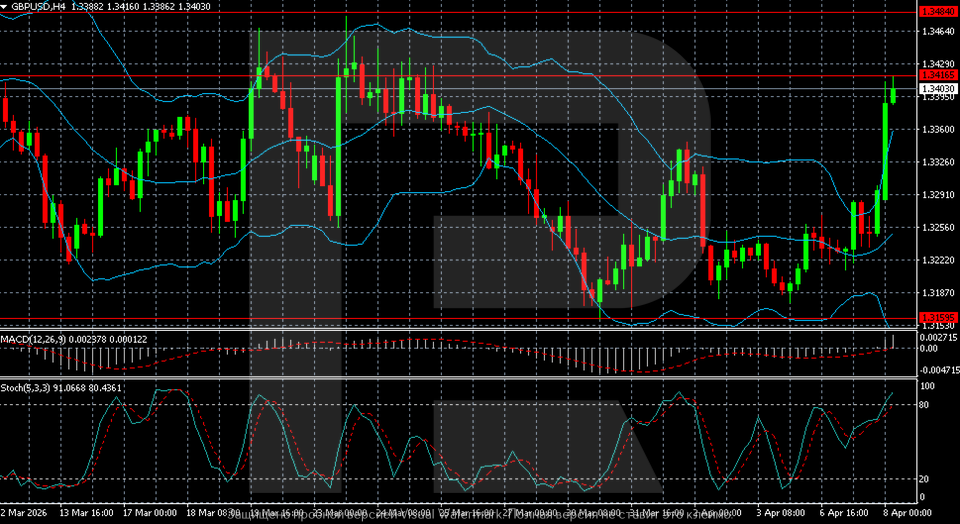
GBPUSD may edge higher: the situation around Hormuz has become slightly calmer The GBPUSD pair strengthened to 1.3403. Energy price risks remain high. Discover more in our analysis for 8 April 2026. Technical outlook On the GBPUSD H4 chart, after declining in late March, the pair formed a local bottom around 1.3150 and began to recover. The latest upward momentum appears fairly strong, with the price quickly returning to the 1.34 area and approaching the key resistance zone of 1.3415–1.3480. The GBPUSD pair is rising within a correction after touching four-week lows earlier. Read more - GBPUSD Forecast Attention! Forecasts presented in this section only reflect the author’s private opinion and should not be considered as guidance for trading. RoboForex bears no responsibility for trading results based on trading recommendations described in these analytical reviews. Sincerely, The RoboForex Team
-

HFMarkets (hfm.com): Market analysis services.
AllForexnews replied to AllForexnews's topic in Fundamental Analysis
Date: 8th April 2026. Two-Week Ceasefire Transforms Market Sentiment. Markets on Wednesday looked markedly different from the conditions seen over the past month, with oil recording its sharpest decline in almost six years. At the same time, equities and gold posted strong gains, while bond yields finally moved lower. The first wave of volatility was due to the comments from the Israeli and US administration on Tuesday afternoon. The comments indicated that the conflict would significantly escalate and enter a completely new phase. The US had started striking Kharg Island, while Israel hit infrastructure, while Trump also advised that they would hit power plants after midnight. However, the price movement quickly changed later in the evening as Iran and the US came to a temporary agreement. The main reaction to this was Crude Oil falling 21% and the stock market rising on average by 4%. US-Iran Agreement The US and Iran have come to a temporary two-week ceasefire agreement, marking a significant de-escalation after weeks of military conflict. The agreement is the first made after five weeks, with both the US and Israel adding significant pressure as the deadline was approaching. A key part of the deal is the reopening of the Strait of Hormuz, a critical global oil route amounting to 20% of global exports. Iran will allow safe passage for energy shipments through the Strait with no restrictions. In the previous week, some ships were allowed to pass but only for certain countries. The agreement was reached just hours before a US military deadline, helping to stabilise markets and reduce immediate geopolitical risk. However, the agreement remains a short-term solution, with both sides using the ceasefire period to negotiate a lasting deal. Key disagreements remain, including sanctions and Iran’s nuclear programme, leaving the longer-term outlook uncertain. Nonetheless, the agreement is a de-escalation and market participants are focusing on this for now. NASDAQ - Market Sentiment Returns Technical analysis is for the first time on larger charts now indicating some strength within the stock market. The price movement is largely due to market sentiment improving due to the recent agreement, potential rate-cuts and lower bond yields. HFM NASDAQ 4-Hour Chart According to the Fed Watch Tool, the possibility of a rate hike in April is now low and the possibility of a rate cut in the summer has returned. This is having a strong impact on the stock market in general, with all global indices rising. However, most economists advise that inflation will not allow the Federal Reserve to cut rates. Later in the week, the US will announce the latest inflation rate, where analysts expect inflation to rise to 3.5%. The higher inflation rises, the more pressure will be applied on the NASDAQ and stocks in general. Notably, in a joint interview for The Indicator from Planet Money, two US Federal Reserve officials, Cleveland Fed President Beth Hammack and Chicago Fed President Austan Goolsbee, stressed that inflation remains a greater concern than labour market conditions, reinforcing expectations of further US monetary tightening. Goolsbee specifically warned that tariff-driven price pressures, combined with rising energy costs amid escalating Middle East tensions, could trigger a ‘stagflationary shock’. Currently, over 95% of the components within the NASDAQ are trading higher on Wednesday. In addition to this, the Put-Call ratio is falling along with the VIX (-12%). These factors indicate bullish price movement for the NASDAQ, but may not indicate a new all-time high. However, a full correction to the previous average price would see the target close to $25,191. Gold Rebounds As Bond Yields Fall The price of Gold is now trading at its highest price since March 19. A key factor for the price of Gold is the decline in the US Dollar as well as lower bond yields. Bond yields are trading at 4.2380, the lowest since March 17. If bond yields continue to fall, particularly if below 4.2000, the price of Gold can find significant support. In addition to this, the US Dollar has also fallen 1.25%, also supporting the price of the commodity. The global gold market is currently worth about $31.0 trillion. By the end of 2025, humanity had mined nearly 220 thousand tons of gold, according to the World Gold Council. Jewellery holds the largest share at 44.0%. Bullion and coins account for 21.0%, while central bank reserves make up 18.0%. Industrial use represents 10.0%, over-the-counter investments 5.0%, and ETFs 2.0%. HFM Gold 1-Hour Chart Key Takeaways: Markets reversed sharply after a US–Iran ceasefire, with oil dropping 21% while equities and gold surged. The reopening of the Strait of Hormuz eased supply fears, but the agreement remains short-term and uncertain. Stock market sentiment improved on lower yields and rate cut expectations, though inflation remains a key risk. Gold strengthened as bond yields and the US Dollar declined, supporting demand for safe-haven assets Always trade with strict risk management. Your capital is the single most important aspect of your trading business. Please note that times displayed based on local time zone and are from time of writing this report. Click HERE to access the full HFM Economic calendar. Want to learn to trade and analyse the markets? Join our webinars and get analysis and trading ideas combined with better understanding of how markets work. Click HERE to register for FREE! Click HERE to READ more Market news. Michalis Efthymiou HFMarkets Disclaimer: This material is provided as a general marketing communication for information purposes only and does not constitute an independent investment research. Nothing in this communication contains, or should be considered as containing, an investment advice or an investment recommendation or a solicitation for the purpose of buying or selling of any financial instrument. All information provided is gathered from reputable sources and any information containing an indication of past performance is not a guarantee or reliable indicator of future performance. Users acknowledge that any investment in Leveraged Products is characterized by a certain degree of uncertainty and that any investment of this nature involves a high level of risk for which the users are solely responsible and liable. We assume no liability for any loss arising from any investment made based on the information provided in this communication. This communication must not be reproduced or further distributed without our prior written permission.