⤴️-Paid Ad- Check advertising disclaimer here. Add your banner here.🔥
All Activity
- Past hour
-
Might be helpful. https://youtu.be/hMURCHLnZVE?si=8GoEEQ6HWlIrhZMg
-
Dont most of prop firms have this included in their dashboards?
- Today
-

HFMarkets (hfm.com): Market analysis services.
AllForexnews replied to AllForexnews's topic in Fundamental Analysis
Date: 4th May 2026. RBA Rate Hike Bets Support the Australian Dollar. Markets take a slightly stronger ‘risk-on’ sentiment on Monday, mainly due to lower oil prices and earnings data. Oil prices have fallen from above $110 per barrel to $101, driven mainly by the US pledge to assist ships to leave the Strait. However, the price remains above $100, which is a key level for market sentiment. The stock market also trades at all-time highs, while the VIX has almost lost all gains from 2026 which is key for bullish sentiment. However, a key development will also be the Reserve Bank of Australia and the Australian Dollar. The AUD has been the best-performing currency of the past month. EURAUD - Markets Expect The RBA to Hike Interest Rates Despite Middle East volatility, the Australian Dollar remains by far 2026’s best-performing currency. The AUD Index is trading 8.00% higher this year while the second best-performing is only seeing a gain of 2.40%. The key reasoning behind the AUD’s strength is the country’s economic performance, limited risk to trade tensions, and hawkish monetary policy. For this reason, the market will be focusing on the Reserve Bank of Australia’s rate decision and guidance. Australia had been one of the few countries struggling with inflation. Even though inflation was not necessarily at a dangerous level, the rate did not fall below 3.00% for nine months. However, now with the energy difficulties, inflation is rising to severe levels, which can trigger a reaction from the RBA. Inflation in Australia is at 4.7%, higher than the US, Japan, EU, and the UK. Markets expect the RBA to increase interest rates from 4.10% to 4.35%, the highest since 2024. If the central bank does indeed hike tomorrow, the AUD may find further support. However, the forward guidance provided by the RBA governor, Michele Bullock, will also be key. In addition to the above, Australia’s first-quarter trade data was mixed. Import prices rose 0.1% QoQ but fell 0.3% YoY, as a stronger Australian Dollar helped offset higher import costs. Markets also watched reports of a potential 2.25% levy on Facebook, TikTok, and Google if they fail to agree on payment terms with local media for news content distribution. The measure could redirect around AUD 1.0-1.5B annually to the media sector. However, it may increase regulatory pressure on tech firms and risk a negative response from the White House, including possible trade tariff measures. HFM - EURAUD 30-Minute Chart A key interest for technical analysts has been the EURUSD and AUDUSD, as both currencies are the worst-performing. When monitoring the EURAUD, the wave patterns are clearly providing a bearish bias. Swing highs and lows are consecutively lower and the price continues to trade below key moving averages but not below the VWAP. As the price is forming a slight retracement during this morning’s Asian session, traders are closely watching for when momentum may be regained. If the price falls below 1.62720, a bearish breakout may indicate a further decline. If the price falls below 1.62666, sell signals are likely to strengthen. Crude Oil - Trump Offers To Assist Ships Out of the Strait of Hormuz Crude Oil is likely to have an influence on most currencies, even the Australian Dollar which is the best-performing. If the price of Crude Oil again rises, the US Dollar is known to follow, while the AUD is known to fall. The price of the commodity fell lower this morning but in recent minutes has seen strong bullish price action. Currently, investors are expecting the conflict to continue to de-escalate. This can be seen in the stock market as well as in the Dollar. However, Crude Oil is yet to fall below $100 per barrel. The latest developments are that President Trump has told ships that the US will help them through the Strait of Hormuz. In addition to this, China has told Chinese companies to defy any US sanctions while Iran continues to offer the US a one-month deal to end the conflict and reopen the Strait. HFM - Crude Oil 3-Hour Chart In terms of technical analysis, the price of Crude Oil towards the end of last week was seeing a significant drop. However, the price is largely trading upwards during today’s session. The bullish price movement is potentially also due to Trump’s tariff threats to the EU. However, if the price falls back below $101.90, sell signals will again materialise. Key Takeaways: Risk appetite has improved, supported by lower oil prices, strong earnings data, record-high stocks, and a falling VIX. The Australian Dollar remains strongly supported, with markets expecting the RBA to hike rates from 4.10% to 4.35%. Australian inflation remains a key concern, sitting at 4.7% and potentially forcing the RBA to maintain a hawkish stance. Oil remains a major market risk, as prices are still above $100 despite easing from recent highs. Always trade with strict risk management. Your capital is the single most important aspect of your trading business. Please note that times displayed based on local time zone and are from time of writing this report. Click HERE to access the full HFM Economic calendar. Want to learn to trade and analyse the markets? Join our webinars and get analysis and trading ideas combined with better understanding of how markets work. Click HERE to register for FREE! Click HERE to READ more Market news. Michalis Efthymiou HFMarkets Disclaimer: This material is provided as a general marketing communication for information purposes only and does not constitute an independent investment research. Nothing in this communication contains, or should be considered as containing, an investment advice or an investment recommendation or a solicitation for the purpose of buying or selling of any financial instrument. All information provided is gathered from reputable sources and any information containing an indication of past performance is not a guarantee or reliable indicator of future performance. Users acknowledge that any investment in Leveraged Products is characterized by a certain degree of uncertainty and that any investment of this nature involves a high level of risk for which the users are solely responsible and liable. We assume no liability for any loss arising from any investment made based on the information provided in this communication. This communication must not be reproduced or further distributed without our prior written permission. -
Thanks, you're awesome
-
 techfo reacted to a post in a topic:
M.V's 4 Indicators
techfo reacted to a post in a topic:
M.V's 4 Indicators
-
 bingojingo reacted to a post in a topic:
Auto Fib Indicator
bingojingo reacted to a post in a topic:
Auto Fib Indicator
-
Also you need a microprocessor knowledge, you must have at least to have a basic knowledge of higher language like fortran or something , to alter binary code.
-
This is exactly what I started, and with Claude it is actually working out well. I now have a pretty decent indicator suite I was able to build for just my trading style. I am finally now on all my own code, describing to Claude exactly what I want with volume etc. It worked out and took a lot of trial and error. I have found that creating something on my own to my style was a lot better than taking any indicator that was out there and trying to run with it.
-
You have Zeus 1.3 unlock?
-
Hey does anyone have version 1.3 Zeus
-

roboforex Market Fundamental Analysis by RoboForex
RBFX Support replied to RBFX Support's topic in Fundamental Analysis
DE 40 forecast: the index tested the support level The DE 40 stock index continues its upward momentum despite a pullback to the support level. The DE 40 forecast for today is positive. Brent forecast: key takeaways Recent data: Germany’s preliminary CPI came in at 0.6% in April Market impact: the data provides a positive backdrop for the German stock market Fundamental analysis Germany’s inflation data appears moderately positive for the DE 40 index, as the monthly CPI came in at 0.6% versus a forecast of 0.7% and slowed notably from the previous 1.1%. For the market, this means that price growth in April was slightly weaker than expected, suggesting pressure on interest rate expectations could ease slightly. For the DE 40, the impact is likely to be moderately positive, rather than outright bullish. Despite the slower monthly reading, annual inflation in Germany is expected to stand at 2.9% in April, according to Destatis preliminary estimates, following 2.7% in March. RoboForex Market Analysis & Forex Forecasts Attention! Forecasts presented in this section only reflect the author’s private opinion and should not be considered as guidance for trading. RoboForex bears no responsibility for trading results based on trading recommendations described in these analytical reviews. Sincerely, The RoboForex Team -
https://filebin.net/v5ivgrl64kctjg9x https://limewire.com/d/D9tjn#GzIymbHbpl
-
 Xander joined the community
 -
PS: why do you think there is so much software for NT? It's definitely not because everyone is a programmer. A few years ago this would of been impossible - so at least give it a go.
-
Just vibe code like most - alot of traders that actually make $, have at least tried writting one simple indicator with Ai. Not saying that's gonna make you money, but it's gonna get you closer.
-
Market Technical Analysis by RoboForex
RBFX Support replied to RBFX Support's topic in Technical Analysis
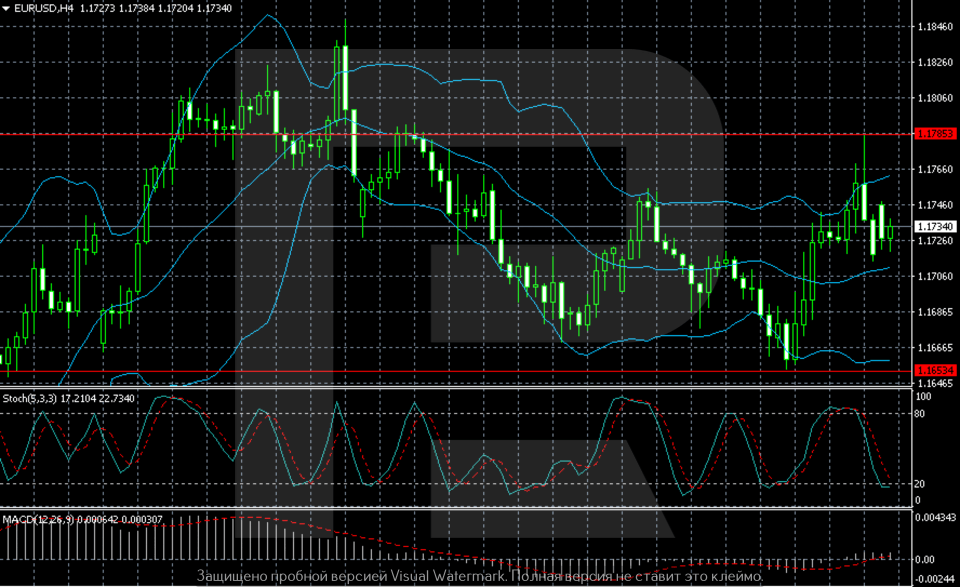
EURUSD on hold: what comes next The EURUSD pair is holding at 1.1734, with everyone conserving strength without fresh news. Discover more in our analysis for 4 May 2026. Technical outlook The EURUSD H4 chart shows that after growth towards the 1.1800–1.1850 zone, the market formed a local high and entered a correction phase. The decline developed gradually, without sharp impulses, with lower highs forming, indicating weakening upward momentum. The EURUSD pair is in a consolidation phase after last week’s sharp moves. Read more - EURUSD Forecast Attention! Forecasts presented in this section only reflect the author’s private opinion and should not be considered as guidance for trading. RoboForex bears no responsibility for trading results based on trading recommendations described in these analytical reviews. Sincerely, The RoboForex Team
-
https://limewire.com/d/6c4rn#WlaHOYoJlo
-
techfo reacted to a post in a topic:
The Market Doesn’t Wait for You
-
techfo reacted to a post in a topic:
M.V's 4 Indicators
-
could you please reupload this. thanks
-
You mean this thing? https://ibb.co/xt4zMWs5
-
The people that are willing to unlock should set something like this up and get tips for the work they do. https://buymeacoffee.com/
-
techfo reacted to a post in a topic:
https://www.dtbtraders.com/
-
techfo reacted to a post in a topic:
https://www.dtbtraders.com/
-
techfo reacted to a post in a topic:
https://www.dtbtraders.com/
-
techfo reacted to a post in a topic:
buysideglobal.com
-
techfo reacted to a post in a topic:
buysideglobal.com
- Yesterday
-
lalelulilo reacted to a post in a topic:
(Req) bill williams profitunity course
-
hi @fryguy1 would it be possible to reupload this please?
-
It's easy to say, I want to do it myself, but if you don't know Python and windows programming and you have not master it, how could you do it. I don't know what is your background, but it you don't master this thing, how could you do it. Now I am making my Excel macro script, and I found out that I need to know a very deep knowledge of Windows command because I need to call some of its program to work in Visual Basic.
-
So you do advise to use an additional indicator? I have been looking at HA candles to check if there is a cleaner trend in the short time frames and wait for a potential pull back. So not always trading breakouts only, but breakouts of a microtrend or pullback for a max 10 points scalp. I have based it on a FX strategy which is called Pip & Run..
-

Indicators to trade like Fabio Valentini ,Carmine Rosato ,etc.
roddizon1978 replied to ⭐ kapitansb's topic in Ninja Trader 8
This is probably Mr T family trading or close associate or somebody smart enough because this trade came out when Mr T was speaking this, insider trading Profit first exit =50($/pt) x 12 (pt) x 365 (no of Trade) = $219,000 Profit 2nd exit =$50 x 23 x 403 =$463,450 Total Profit = $ 682,000 -
Those breakouts in the yt video are complicated sometimes theres buyers at those lows to continue trading with trend so is a conflict area need more to confirm is a break is more cleaner to watch swing breakouts
- 11 replies
-
- 1
-
-
- ninjatrader
- futures
- (and 4 more)
-
Ok thanks bro! Will try it!
-
Friend if journal is what you're loking for, you need to check this out. It gives you that and so much more.
-

Indicators to trade like Fabio Valentini ,Carmine Rosato ,etc.
kkreig replied to ⭐ kapitansb's topic in Ninja Trader 8
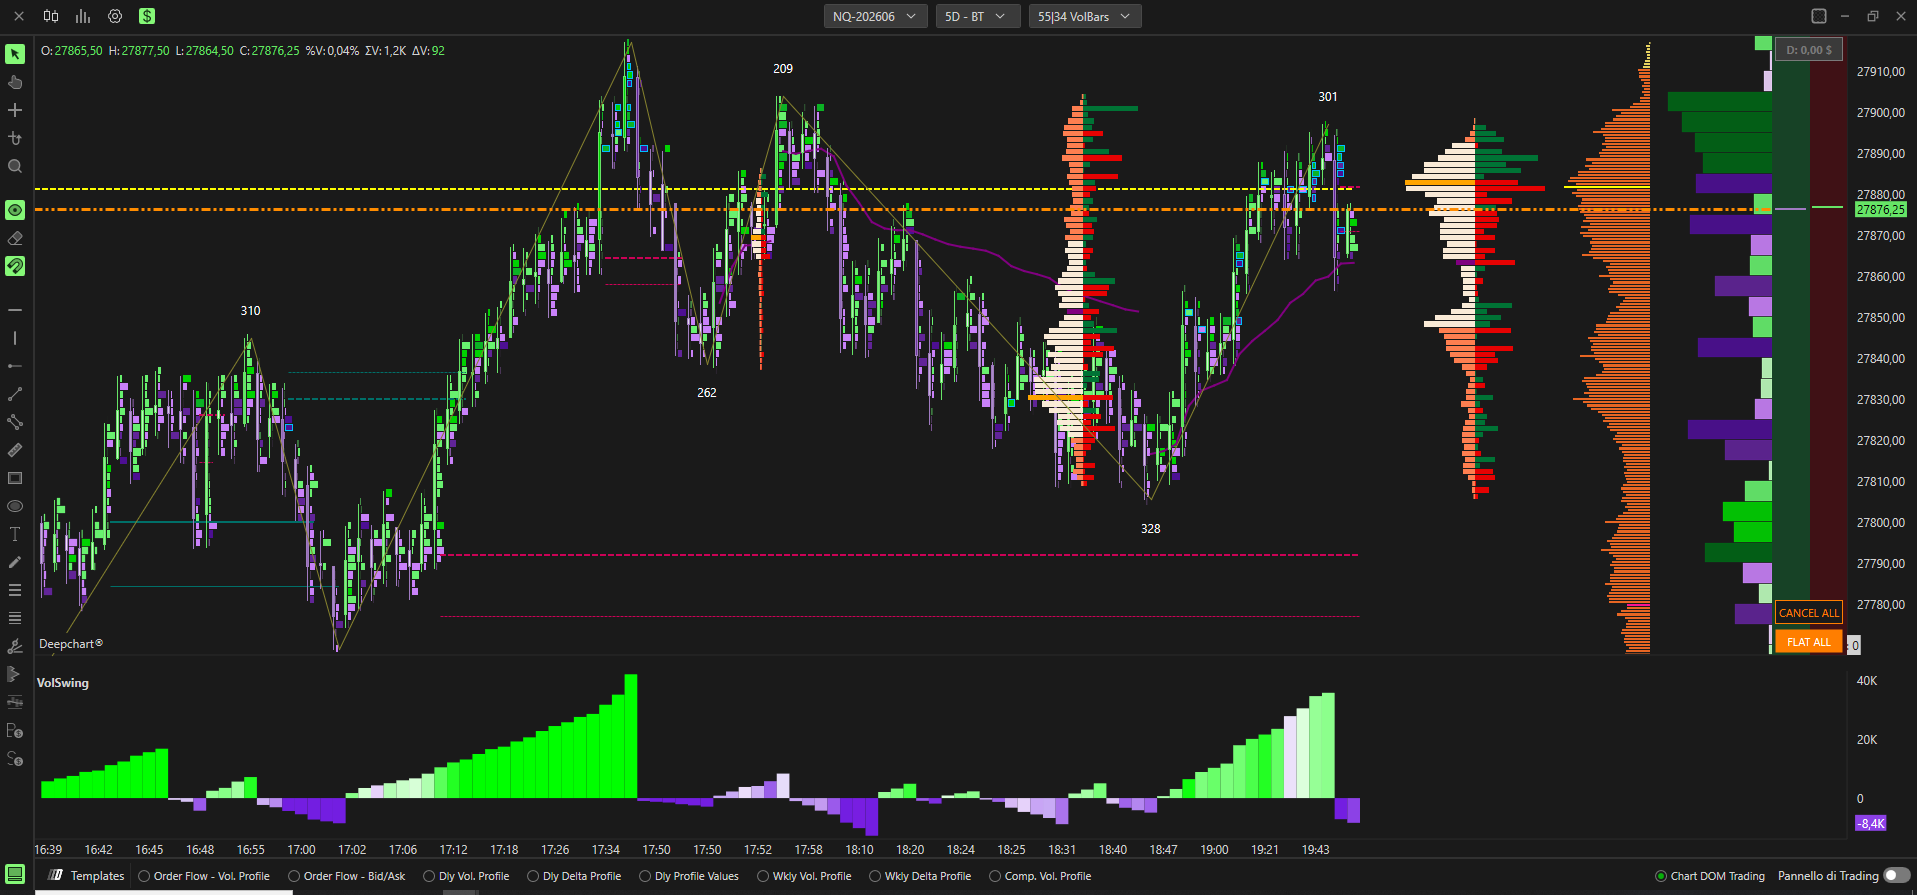
Original Deepchart No Fake Deepchart_hfxQh0Rh0V.mp4