All Activity
- Past hour
- Today
-
Should be pretty straight forward, it loads as an indicator instead of a strategy. Use the HFT bars on a 30 setting and set your SL/TP to your accepted risk level. Here's a video of it running. https://www.youtube.com/watch?v=2yROeWQJPyU
-

HFMarkets (hfm.com): Market analysis services.
AllForexnews replied to AllForexnews's topic in Fundamental Analysis
[b]Date: 9th July 2025.[/b] [b]Symmetrical Triangle Support: Gold Rebound Imminent?[/b] Gold’s price comes under pressure for a fourth day, primarily due to positive US data and a stronger Dollar. The US employment data from the previous week is the main driver of a weaker price as rate cuts become less likely and sentiment rises. Though both technical and fundamental analysts are contemplating whether the trend will suddenly change. Gold Continues to Decline The bearish price movement came after surprisingly positive employment data on July 3rd. The latest employment report revealed robust growth, with the NFP change expanding by 147,000. This figure far surpassed the 111,000 forecast and even exceeded May's 144,000, largely attributed to significant hiring in the civil service (73,000) and healthcare (39,000). As a result, the Unemployment Rate edged down to 4.1%, though Average Hourly Earnings saw a marginal decrease. Gold has also come under pressure from the strengthening US Dollar and the Federal Reserve. The US Dollar Index has risen more than 1% over the past week, pressuring Gold due to its inverse correlation. The market also now expects a more hawkish Federal Reserve and this can be seen through indications available by stock exchanges. For example, the Chicago exchange previously stated a 6% possibility of an interest rate pause in September. That figure has now risen to 34%. Although traders should note that this may change depending on tonight's FOMC Meeting Minutes. Gold price movement will also depend on the current developments within the Oil market, geopolitics, earnings season and the US trade policy. What Could Trigger Gold to Rebound? While geopolitical tensions seem to be improving, other factors suggest potential for an upside. Crucially, ongoing geopolitical tensions, particularly concerning Iran's nuclear program, remain a significant wild card. Any escalation could swiftly push Gold prices higher, as seen in the first 2 weeks of June 2025. According to analysts, this remains an issue as experts believe Iran will continue to enrich uranium and no agreement has been made with the US so far. In addition to this, despite minor deadline extensions from July 9th, the Trump administration's ongoing pursuit of new 25% tariffs on imports from Japan and South Korea (effective August 1st). This continues to generate significant market volatility and uncertainty, which if continues, may support Gold’s rebound. These impending tariffs are particularly impactful given both nations' considerable trade deficits with the US. Another major issue is the EU, which is yet to make an agreement in principle with the US. The US has proposed a deal to the EU with a 10% baseline tariff on most goods, offering exemptions for sectors like aircraft, spirits, and cosmetics. However, the U.S. is currently unwilling to exempt sensitive industries like cars, steel, and aluminium, which the EU has strongly requested. If no agreement is made, the ‘risk-off’ sentiment can support another bullish trend for Gold. Commodity Futures Trading Commission and Technical Analysis Show Symmetrical Triangle There's a strong preference for buying in all types of contracts. Investors who use actual money hold significantly more ‘buy’ positions (167,386 thousand) than ‘sell’ positions (36,902 thousand). Last week, buyers increased their holdings by 4,217 thousand deals, while sellers increased theirs by 1,925 thousand, confirming a global trend towards investment. In terms of technical analysis, most indicators continue to signal downward price movement. However, on the daily chart, the price is forming a symmetrical triangle pattern and trading at the support level. Therefore, traders will monitor if the price reacts to this support level and if the US Dollar weakens throughout the day. XAUUSD Daily Chart Key Takeaway Points: Gold's price is falling, driven by strong US job data, a strengthening US Dollar and low rate cut expectations. Geopolitical risks and new US tariffs could trigger a Gold rally if this escalates to trigger a risk-off sentiment. Gold's technical charts show a symmetrical triangle pattern, and the price is trading close to its support level. However, trend indicators point towards bearish momentum. Despite Trump’s extensions for trade agreements, the market remains cautious as no agreement has yet been made with Korea, Japan and the EU. [b]Always trade with strict risk management. Your capital is the single most important aspect of your trading business.[/b] [b]Please note that times displayed based on local time zone and are from time of writing this report.[/b] Click [url=https://www.hfm.com/hf/en/trading-tools/economic-calendar.html][b]HERE[/b][/url] to access the full HFM Economic calendar. Want to learn to trade and analyse the markets? Join our webinars and get analysis and trading ideas combined with better understanding of how markets work. Click [url=https://www.hfm.com/en/trading-tools/trading-webinars.html][b]HERE[/b][/url] to register for FREE! [url=https://analysis.hfm.com/][b]Click HERE to READ more Market news.[/b][/url] [b]Michalis Efthymiou HFMarkets[/b] [b]Disclaimer:[/b] This material is provided as a general marketing communication for information purposes only and does not constitute an independent investment research. Nothing in this communication contains, or should be considered as containing, an investment advice or an investment recommendation or a solicitation for the purpose of buying or selling of any financial instrument. All information provided is gathered from reputable sources and any information containing an indication of past performance is not a guarantee or reliable indicator of future performance. Users acknowledge that any investment in Leveraged Products is characterized by a certain degree of uncertainty and that any investment of this nature involves a high level of risk for which the users are solely responsible and liable. We assume no liability for any loss arising from any investment made based on the information provided in this communication. This communication must not be reproduced or further distributed without our prior written permission. -
 J W reacted to a post in a topic:
markttechniktrading.de
J W reacted to a post in a topic:
markttechniktrading.de
-

REQ : Jigs@w Institutional Training Course
⭐ navigator replied to Bill A's topic in Learning Resources
Yes, they have a partnership. The Institutional course is provided by AXIA. -
please any one having working Fibonacci_Galactic_Trader ?? please upload new link
-
TradingView also has regular free to join contests with cash prices. They even provide free live data during the contest.
-
Videos, webinars etc are usually better for high-frequency trading, scalping strategies. Also podcasts to learn on the go. But for longer term swing trading strategies or risk management, trading mindset studies, books are absolutely fine in my opinion.
-
Hello Rashid, Welcome to the forum and good luck with your trading journey. If we can help you with anything, just let us know. :)
-
⭐ navigator changed their profile photo
-

Market Technical Analysis by RoboForex
RBFX Support replied to RBFX Support's topic in Technical Analysis
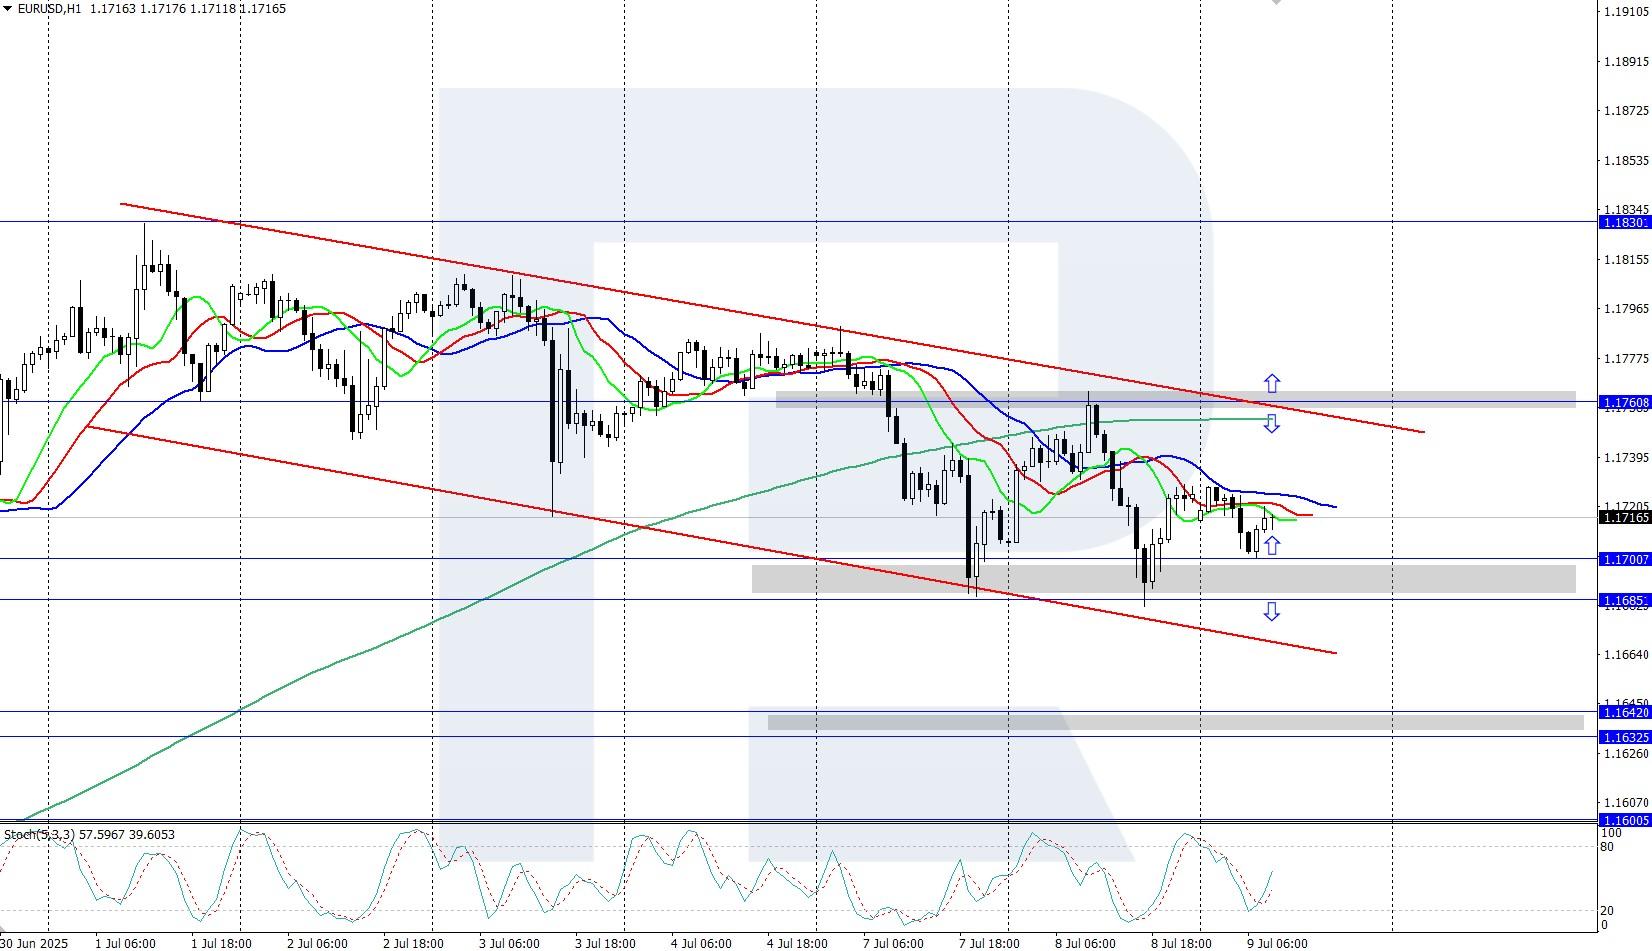
EURUSD: the pair soared above 1.1700 ahead of the FOMC minutes EURUSD rate is rising, climbing above 1.1700 amid expectations of the FOMC minutes publication, which may hint at an imminent rate cut. Details – in our analysis for 9 July 2025. EURUSD technical analysis On the H4 chart, EURUSD quotes show a local upward reversal, rising above the 1.1700 mark. The daily trend for the pair is upward, confirmed by the rising Alligator indicator. It is possible that the downward correction is already ending, and a new upward impulse may follow. EURUSD quotes are moderately rising, climbing above the 1.1700 mark on information about possible agreements on reducing trade tariffs between the US and the EU. Read more - EURUSD Forecast Attention! Forecasts presented in this section only reflect the author’s private opinion and should not be considered as guidance for trading. RoboForex bears no responsibility for trading results based on trading recommendations described in these analytical reviews. Sincerely, The RoboForex Team
-
roboforex Market Fundamental Analysis by RoboForex
RBFX Support replied to RBFX Support's topic in Fundamental Analysis
GBPUSD in an uptrend despite global risks The GBPUSD rate is strengthening but remains under pressure from global tensions and calls for increased defence spending. Current quote – 1.3593. Details – in our analysis for 9 July 2025. GBPUSD forecast: key trading points The UK is working on an agreement with the US to cancel steel tariffs, fearing an increase up to 50% An increase in steel tariffs could have a devastating impact on the British steel industry GBPUSD forecast for 9 July 2025: 1.3770 Fundamental analysis The GBPUSD rate is recovering after three consecutive days of decline. The British pound came under pressure due to rising global tensions and mounting calls for increased defence spending, creating long-term budgetary uncertainty. Despite the current bearish correction, the GBPUSD currency pair continues to move within an uptrend. The Office for Budget Responsibility (OBR) warned that government debt could reach 270% of GDP by 2070, due to demographic changes and rising healthcare and pension costs. RoboForex Market Analysis & Forex Forecasts Attention! Forecasts presented in this section only reflect the author’s private opinion and should not be considered as guidance for trading. RoboForex bears no responsibility for trading results based on trading recommendations described in these analytical reviews. Sincerely, The RoboForex Team -
I think you are talking about this contest, It's monthly competition so you should expect the result at the end of month. But for demo contest, you should have > 1k% profit gain to be awarded.
-
Welcome to Indo-Investasi.com. Please feel free to browse around and get to know the others. If you have any questions please don't hesitate to ask.
-
 dkingmichael joined the community
 -
I'll take either one if anyone has it. You can attach indicators in new version
-
What's the difference with latest one and the last one?
-
Webinars are a great way to learn without stress. I don’t always have time to read full books, but I can join short webinars. HFM is doing a good job offering these sessions. It shows they care about traders, not just trading.
- Yesterday
-
 ⭐ mangrad reacted to a post in a topic:
HFT WarHammer Unlocked
⭐ mangrad reacted to a post in a topic:
HFT WarHammer Unlocked
-
Nice, Thank You.
-
roddizon1978 reacted to a post in a topic:
HFT WarHammer Unlocked
-
Playr101 reacted to a post in a topic:
jenacie.com
-
Harrys reacted to a post in a topic:
Imbalance Blocks
-
Playr101 reacted to a post in a topic:
apexinsights.llc
-
Playr101 reacted to a post in a topic:
HFT WarHammer Unlocked
-
well looks lke dnspy did a closer to ninjascript, of converting the cs file so was able to get that one working. but still would like to know how to do that in dnspy as when i went to edit the strategy cs it had a boatload of compile errors.
-
 CBDQueen joined the community
 -
You can edit the code directly with dnSpy
-
laser1000it, which of those bots is HFT Spectre. I see different others, but not the Spectre. Thank you
-
Thank you TickHunter. How does it work for you? Which setting should we use to use this bot? For some reason for me it doesn't take any trades... Thank you in advance!
-
Hi Indo-Investasi traders! 👋 I'm Bud, the admin of BudgetForex – your one-stop shop for the latest EAs, trading systems, and trading courses at unbeatable prices. We offer a huge selection of products for MT4, MT5, NinjaTrader 8, and TradingView, all heavily discounted and constantly updated. 🔥 Special for Indo-Investasi members: I’m offering you an exclusive extra 15% discount on top of the already discounted prices! ✅ Use coupon code: INDO15 🛒 Just enter it on the Cart page before checkout to apply the extra discount. Visit us at: https://budgetforex.com If you have any questions or need recommendations on EAs, systems, or courses, feel free to reach out. I’m always happy to help fellow traders! Wishing you success and profits, Bud Admin – BudgetForex
-
You need the source code
-
HFMarkets (hfm.com): Market analysis services.
AllForexnews replied to AllForexnews's topic in Fundamental Analysis
Date: 8th July 2025. AUD Rallies as RBA Chooses a Surprise Rate Pause. The Reserve Bank of Australia kept its official cash rate at 3.85%, surprisingly avoiding another interest rate cut. Previously, analysts were expecting Australia’s central bank to again cut interest rates by a further 0.25% to 3.60%. As a result, the Australian Dollar is the day’s best-performing currency so far. AUDUSD - RBA Keeps Rates Unchanged The Australian Dollar rose in value due to the surprisingly hawkish central bank; however, traders tend to speculate a bullish currency against a poorly performing currency. By doing so, traders can avoid two conflicting currencies. The worst-performing currencies over the past 30 days are the US Dollar and the Japanese Yen. Therefore, the AUDUSD and AUDJPY are particularly interesting. The AUDUSD rose up to 1.05% during this morning’s Asian Session and is forming its first bullish candlestick after 3 days of consecutive declines. The US Dollar continues to come under pressure from its trade policy. The latest developments are related to Japan and South Korea, which will see a 25% tariff imposed from August 1st. Japan has the 7th largest deficit with the US, and South Korea has the 8th largest. Furthermore, investors had been shorting the US Dollar over the past 2 weeks over expectations of a dovish central bank. According to experts, the US President is likely to put in place a chairman, which is known for his dovish nature and is in line with the current ‘Trump-economics’, but this idea has come under pressure from the latest employment data. The latest employment data read significantly stronger than previous projections. AUDJPY - JPY Struggles Due To US Tariffs The Japanese Yen is one of the worst-performing currencies of the day, primarily due to President Trump confirming 25% tariffs on Japan. The AUDJPY rose to its highest level since February 21st. Following May's surprisingly low inflation and a deceleration in first-quarter economic growth, forecasts for a rate cut became almost universal. In regards to the Reserve Bank of Australia, according to economists, the central bank is likely to pause rate cuts for 3-4 months before continuing to cut rates towards the end of the year. According to the Governor of the RBA, the committee is looking to wait for confirmation that indeed inflation has fallen and will remain low before cutting rates. This confirms that the RBA is looking to cut, but the timing will depend on inflation over the next months. The country’s inflation rate is currently 2.4%. If the rate remains at this level for a further 2 months or falls even lower at the next release, a rate cut will become more likely. In terms of technical analysis, the price of the AUDJPY is trading significantly higher than the main moving averages. This indicates the level of demand but also prompts caution as investors consider if the price is overbought in the short term. However, if the price declines back to the 95.291 support level, the AUDJPY will no longer be overbought. As a result, traders may take into consideration buying at the discounted price. The performance of the AUDJPY will also depend on tomorrow’s rate decision from the Reserve Bank of New Zealand, as well as the Federal Reserve’s FOMC Meeting Minutes. If the RBNZ decide to cut as per current expectations, the AUD may find further support. Key Takeaway Points: RBA surprisingly held interest rates at 3.85%, despite expectations for a cut, causing the AUD to strengthen significantly. The US Dollar (USD) and Japanese Yen (JPY) are under pressure due to renewed US trade tariff threats (25% on Japan/South Korea from August 1st) and expectations of dovish US monetary policy. AUDUSD and AUDJPY are favoured pairs as traders look to go long on the strong AUD against underperforming currencies. AUDJPY hit a high not seen since February 21st. The RBA needs further inflation confirmation before resuming rate cuts later this year, indicating a potential pause for 3-4 months. [b]Always trade with strict risk management. Your capital is the single most important aspect of your trading business.[/b] [b]Please note that times displayed based on local time zone and are from time of writing this report.[/b] Click [url=https://www.hfm.com/hf/en/trading-tools/economic-calendar.html][b]HERE[/b][/url] to access the full HFM Economic calendar. Want to learn to trade and analyse the markets? Join our webinars and get analysis and trading ideas combined with better understanding of how markets work. Click [url=https://www.hfm.com/en/trading-tools/trading-webinars.html][b]HERE[/b][/url] to register for FREE! [url=https://analysis.hfm.com/][b]Click HERE to READ more Market news.[/b][/url] [b]Michalis Efthymiou HFMarkets[/b] [b]Disclaimer:[/b] This material is provided as a general marketing communication for information purposes only and does not constitute an independent investment research. Nothing in this communication contains, or should be considered as containing, an investment advice or an investment recommendation or a solicitation for the purpose of buying or selling of any financial instrument. All information provided is gathered from reputable sources and any information containing an indication of past performance is not a guarantee or reliable indicator of future performance. Users acknowledge that any investment in Leveraged Products is characterized by a certain degree of uncertainty and that any investment of this nature involves a high level of risk for which the users are solely responsible and liable. We assume no liability for any loss arising from any investment made based on the information provided in this communication. This communication must not be reproduced or further distributed without our prior written permission. -
Can anyone explain the process to modify a dll generated by Ninjatrader without having the original source code? I have a dll file that I can see the C# code using DotPeek or dnSpy, I want to modify a bit of that code then recompile the dll without having to take the cs file and re-engineering it back to ninjascript. There is no Agile protection in the code. What I found trying to take the decomplied cs file and trying to code it in ninjascript is a nightmare as so many things have to be coded in the ninjascript methods ie State = 2 , would be State == State.Configured, that's easy but many other lines are not translating easily. I think there is some kind of debug mode that lets you open in Visual Studio and has all the resources of Ninjatrader but haven't got that figured out.
-
This is the the description of the programmer of the indicator: "REQUIRES ORDERFLOW LICENSE --No Tick Replay Required-- The only reason I have Volumetric Bars (Foot Prints) visible is so I can see stacked imbalances... I wanted to change that... Imbalance Blocks is a powerful Order Flow-based indicator designed specifically for NinjaTrader 8 users with access to Volumetric Bars (Order Flow Suite). This tool scans each bar's bid/ask volume structure to detect stacked imbalances—key zones where aggressive buyers or sellers dominated the tape—and then paints those zones directly on your price chart as visual blocks. Highlights areas where buyers or sellers were clearly in control (via stacked volume imbalances). Brings attention to price zones that could act as support/resistance, reaction zones, or breakout levels. Unlike single-level imbalance indicators, this one identifies diagonally stacked clusters that can indicate not just volume disparity—but intentional, sustained buying or selling effort. How It Works Using a secondary Volumetric Data Series, the indicator evaluates each tick level of each bar and checks for buy and sell imbalances based on a configurable volume ratio (e.g., 3:1). When a certain number of these imbalances stack diagonally, the indicator renders a color-coded block on the chart—highlighting a meaningful price structure that may otherwise go unnoticed. These blocks extend horizontally into future bars, providing a visual anchor for potential reactions, retracements, or trade setups. Ideal Use Cases Retest/Reaction Trades: Wait for price to revisit a previously defined imbalance zone. Breakout Confirmation: Use block zones to validate that a breakout was supported by real order flow. Confluence Zones: Pair with support/resistance, volume profile, VWAP, or price action. Requirements Requires NinjaTrader 8 with Order Flow Volumetric Bars enabled If you do not have the Order Flow suite, the indicator will notify you and gracefully disable itself." Could anyone with an educated version of NT8 test and provide a feedback on how good is and if is has plots? Thank you ImbalanceBlocks.zip
-
- 3
-
-
-
 @AllIn I see some results posted there and you may be right we never now if is the owner or not and about cherrypicking I wouldn't be surprised @Ninja_On_The_Roof Kiss Orderflow indeed has Trapper Buyers/Sellers but what I really liked here it was the habillity to use on strategy builder and from the description it comes already with a strategy. From the video (short) it seems dececent but would like to hear more opinions