All Activity
- Past hour
-
I think that this worth to give it a try
-

HFMarkets (hfm.com): Market analysis services.
AllForexnews replied to AllForexnews's topic in Fundamental Analysis
[b]Date: 30th April 2025.[/b] [b]JPY in Focus: BOJ Decision and Trade Tensions Set the Stage[/b] Markets in Japan reopen after a bank holiday and investors again turn their attention to the Japanese Yen. The Japanese Yen along with the Euro and Swiss Franc has been the best-performing currency in 2025 so far. However, tariffs and the global trade policy make further rate hikes uncertain ahead of tomorrow’s Bank of Japan press conference. Bank of Japan and the JPY The primary reason for the bullish performance of the Japanese Yen this year is the BOJ’s rate hikes and the currency's safe-haven nature. Previously economists' projections for the Bank Of Japan was for the regulator to increase interest rates to 1.00% in 2025. However, the uncertainties within the market surrounding the trade policy and a possible recession puts the hawkish path at risk. The Bank of Japan is scheduled to meet tomorrow during the Asian session. The regulator’s interest rates are likely to remain the same, but the guidance for the upcoming months will be key. The latest Reuters Tankan survey for April showed improved sentiment within the manufacturing sector. However, consumer confidence remains subdued, largely due to stalled trade negotiations with the US and continued uncertainty in bilateral relations, factors that complicate long-term economic assessments. Given these conditions, the Bank of Japan is expected to adopt a cautious, wait-and-see approach. However, it may also signal the possibility of further monetary tightening in the second half of the year. Inflation has remained above the 2.0% target for nearly three years, with recent data suggesting that the trend is set to persist. In March, the Core Consumer Price Index accelerated, driven by sustained increases in food prices. Meanwhile, the CPI excluding fresh food and energy rose to 2.9%, its highest level in a year, highlighting persistent underlying price pressures. The US Trade Policy Currently, there seems to be a clear correlation between the trade policy and the USDJPY, similar to the EURUSD. As tensions escalate, investors reduce their exposure to the US Dollar in favour of the Japanese Yen, Euro and Swiss Franc. However, whether the ‘trade conflict’ will indeed escalate or not cannot be certain. For the JPY to maintain its bullish path, an escalation in tensions or rate hikes potentially will be necessary. Before President Trump announced the tariffs on April 2nd, the Bank of Japan was planning at least 2 further 0.25% hikes. Investors will closely scrutinize the BoJ’s Governor’s comments regarding future hikes. On the other hand, the Federal Reserve is not likely to cut interest in May according to the Chicago Exchange. A rate cut in May can become a possibility if this week shows a sudden dip in the employment sector. According to the Chicago Exchange, there is a 60% chance of a 0.25% cut on May 7th and a 90% chance for July 30th if a cut is not done in May. USDJPY - Technical Analysis USDJPY 15-Minute Chart The USDJPY trades within range-bound trading conditions neither seeing a clear breakout below or above the key levels. The exchange rate also trades very close to the average price of the past 2-weeks. However, this is likely to change as the US releases further employment data today and Friday as well as tomorrow’s Bank of Japan rate decision and press conference. If the price of the USDJPY declines below the support level at 141.970 sell signals are likely to strengthen as long as the price does not obtain an oversold indication on oscillators. On the other hand, if the USDJPY rises above the resistance level at 142.752, buy signals can strengthen. Key Takeaway Levels: The Japanese Yen will remain strong in 2025, but trade tensions and recession risks cloud further rate hikes. Previously rate hikes were one of the key factors supporting the Japanese Yen. The Bank of Japan is likely to hold rates tomorrow, with guidance being the key market focus. Inflation in Japan remains above target, with core CPI hitting 2.9%—the highest in a year. USDJPY trades in a tight range; key breakout levels are 141.970 (support) and 142.752 (resistance). [b]Always trade with strict risk management. Your capital is the single most important aspect of your trading business.[/b] [b]Please note that times displayed based on local time zone and are from time of writing this report.[/b] Click [url=https://www.hfm.com/hf/en/trading-tools/economic-calendar.html][b]HERE[/b][/url] to access the full HFM Economic calendar. Want to learn to trade and analyse the markets? Join our webinars and get analysis and trading ideas combined with better understanding of how markets work. Click [url=https://www.hfm.com/en/trading-tools/trading-webinars.html][b]HERE[/b][/url] to register for FREE! [url=https://analysis.hfm.com/][b]Click HERE to READ more Market news.[/b][/url] [b]Michalis Efthymiou HFMarkets[/b] [b]Disclaimer:[/b] This material is provided as a general marketing communication for information purposes only and does not constitute an independent investment research. Nothing in this communication contains, or should be considered as containing, an investment advice or an investment recommendation or a solicitation for the purpose of buying or selling of any financial instrument. All information provided is gathered from reputable sources and any information containing an indication of past performance is not a guarantee or reliable indicator of future performance. Users acknowledge that any investment in Leveraged Products is characterized by a certain degree of uncertainty and that any investment of this nature involves a high level of risk for which the users are solely responsible and liable. We assume no liability for any loss arising from any investment made based on the information provided in this communication. This communication must not be reproduced or further distributed without our prior written permission. -

Market Technical Analysis by RoboForex
RBFX Support replied to RBFX Support's topic in Technical Analysis
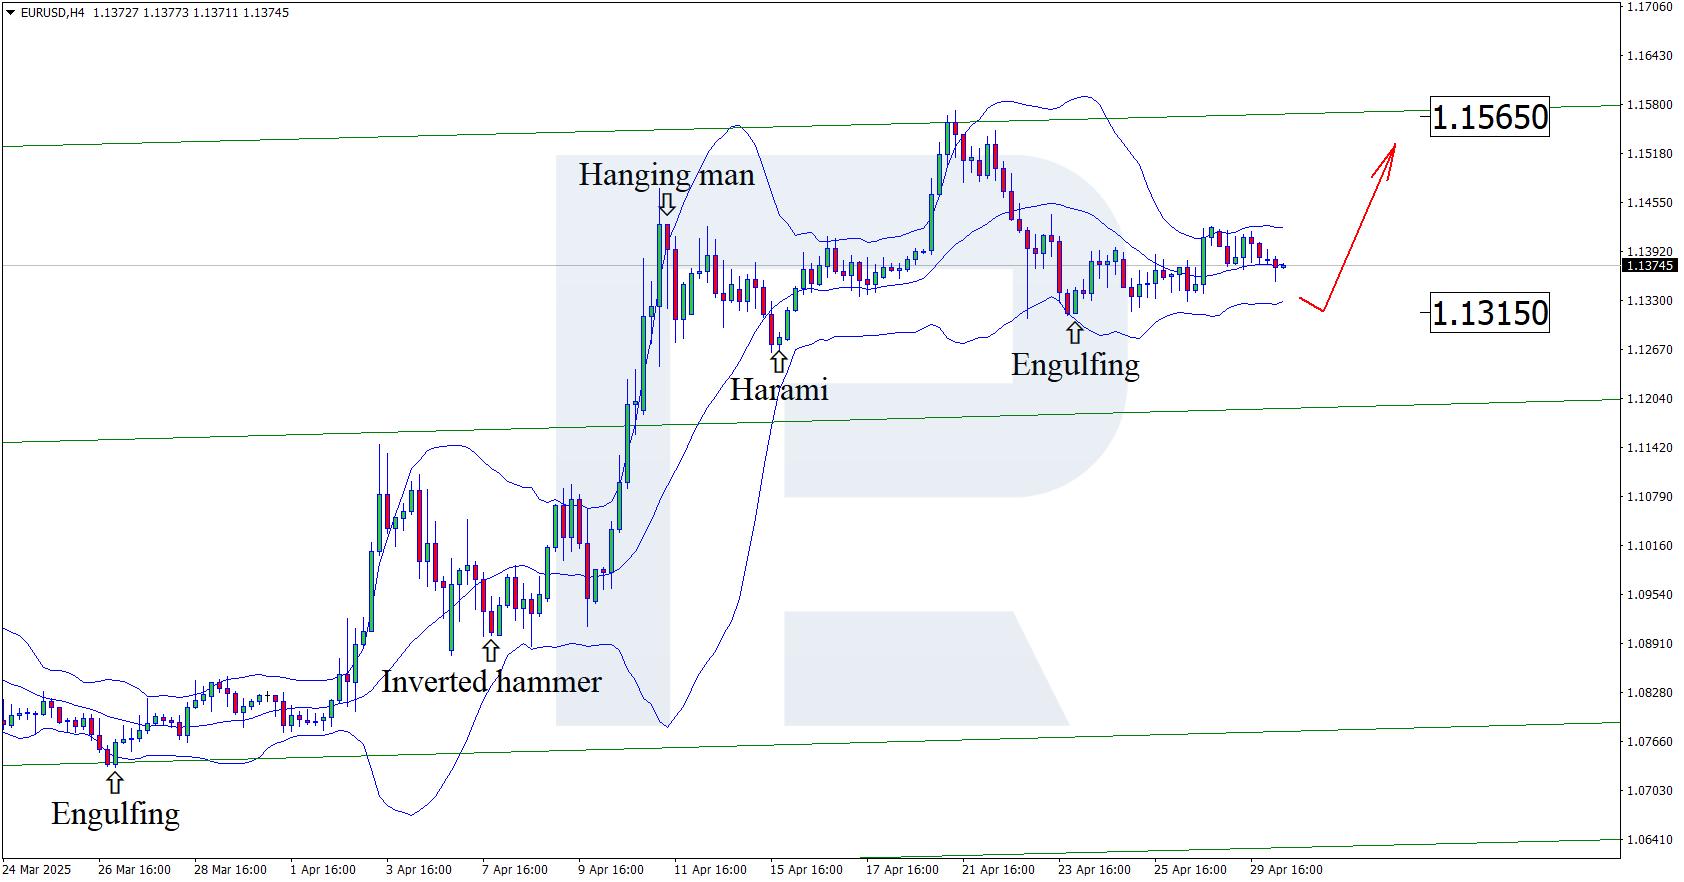
US and EU GDPs collapse, what is next for EURUSD A decline in US GDP could offer the euro an opportunity to strengthen, pushing EURUSD quotes towards 1.1565. Discover more in our analysis for 30 April 2025. EURUSD technical analysis On the H4 chart, the EURUSD pair has formed an Engulfing reversal pattern near the lower Bollinger band. The pair currently maintains its upward trajectory in response to this signal. Since the price remains within an ascending channel, further growth towards the nearest resistance at 1.1565 is expected. A breakout above this level would open the path for continued bullish momentum. Amid weakening US economic data, today's EURUSD forecast is rather optimistic. Read more - EURUSD Forecast Attention! Forecasts presented in this section only reflect the author’s private opinion and should not be considered as guidance for trading. RoboForex bears no responsibility for trading results based on trading recommendations described in these analytical reviews. Sincerely, The RoboForex Team
-
roboforex Market Fundamental Analysis by RoboForex
RBFX Support replied to RBFX Support's topic in Fundamental Analysis
GBPUSD breaks three-year highs The GBPUSD rate continues to climb confidently, setting a new three-year high at 1.3443. Market participants are awaiting key US data today, including ADP employment figures and Q1 GDP. Find more details in our analysis for 30 April 2025. GBPUSD forecast: key trading points Market focus: ADP employment data and Q1 GDP figures will be released during the American session today Current trend: uptrend in place GBPUSD forecast for 30 April 2025: 1.3443 and 1.3300 Fundamental analysis The GBPUSD pair surged to a three-year high, driven by expectations that the Bank of England will proceed more cautiously with rate cuts compared to other major central banks. Markets are currently pricing in around 85 basis points of easing for 2025, similar to the Fed’s outlook. Today’s spotlight is on key US economic indicators, with April’s ADP employment report and the Q1 GDP reading scheduled for release. The ADP reading is expected to grow by 118 thousand, with GDP up 0.2%. Stronger-than-expected results could support the US dollar and lead to a pullback in the GBPUSD pair, while weaker data would likely fuel further gains for the pound. RoboForex Market Analysis & Forex Forecasts Attention! Forecasts presented in this section only reflect the author’s private opinion and should not be considered as guidance for trading. RoboForex bears no responsibility for trading results based on trading recommendations described in these analytical reviews. Sincerely, The RoboForex Team - Today
-
 ⭐ Mestor reacted to a post in a topic:
strategies.steady-turtle.com
⭐ Mestor reacted to a post in a topic:
strategies.steady-turtle.com
-
adonis reacted to a post in a topic:
Favorite Indies
-
adonis reacted to a post in a topic:
Favorite Indies
-

ERTS (Easy Renko Trading System) Needs Unlocking
Ninja_On_The_Roof replied to TickHunter's topic in Ninja Trader 8
TDU has one that is called TrailingStop and MagicTrend. ARC has one that is called ATRStop. Nonza.Co has one that is called SolarWind ( or now called SolarWave). -
Nothing is showing up on chart as well when enabled. Just a naked chart.
-
its not letting to change the Risk Per trade from 100 to any other number..
-
How did you install it? Majority of Apmoo's works, one much unzip files then copy and paste them into your Ninjatrader Bin/Custom folder. Side notes, I am against the idea of having a bunch of indicators on my charts. Just because I have 10 of them, just to make my charts look beautiful or to make me feel somehow, secured and safe...That doesn't mean that I would make loads of money trading. I believe in simplicity. I only use what I actually need, to determine my entries, my potential target profits and stoplosses. I remember when I first started out many years back. I used to have tons of indicators on my charts. Then eventually, I realized I never truly and fully used all of them at the same time to enter a trade. As far as for stoplosses, I don't believe in using a certain amount of dollars for my stoplosses. I think that is just crazy. Maybe you have a goal of losing only, let's say, $200 for your stoploss. That's your max pain threshold for each trade. But guess what, that $200 stoploss you place on your charts might not just be at the right place. It gotta be placed at the right places, based on technical levels and stuff. Not based upon just pure dollar amount. Imagine your stoploss is placed somewhere in the middle of recent high or low, support resistance, price pulls back a bit to try to retest these areas, and it already hits you in the head hard right before it reaches back, then turns around and continues in same original direction of your entry. Just because you used $200 as your stoploss.
-
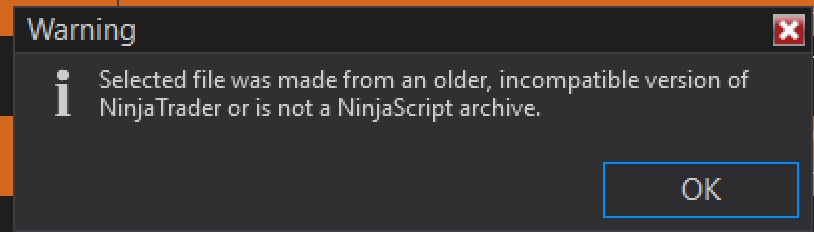
Not able to import , getting the following error
-
Thanks @Ninja_On_The_Roof
-
https://workupload.com/file/WGv8Dnk9AUx https://workupload.com/file/4XS4zYb6943 Many thanks to Apmoo.
-
Let's take this opportunity and share our favorite indies and not just favorite ones but also profitable. Maybe then, when combined, we would have a perfect and most powerful "system" out there.😂
-
⭐ ralph kabota reacted to a post in a topic:
ERTS (Easy Renko Trading System) Needs Unlocking
-
 ⭐ puwing reacted to a post in a topic:
Favorite Indies
⭐ puwing reacted to a post in a topic:
Favorite Indies
-
Could someone point me to the indicator files please? I could not find them anywhere on this site.
-
thanks for sharing. I really appreciate it. I started looking into it. What timeframe you use? Also want to see if I got it right. Turning red means bullish movement coming and blue mean bearish move? I appreciate it
-
Almost he got some of the lines. Its gonna be hard to correct it with just letting the deepseek or chatgpt correct or translate it to another script unless he could understand the theory of the wolfe wave. but with your files , maybe I feed him with this theory, maybe he could understand it better. LOL.
-
⭐ osijek1289 reacted to a post in a topic:
strategies.steady-turtle.com
-
need to work with all bar type aiken aish or tbar or ninzarenko can be good return approach resultat
-
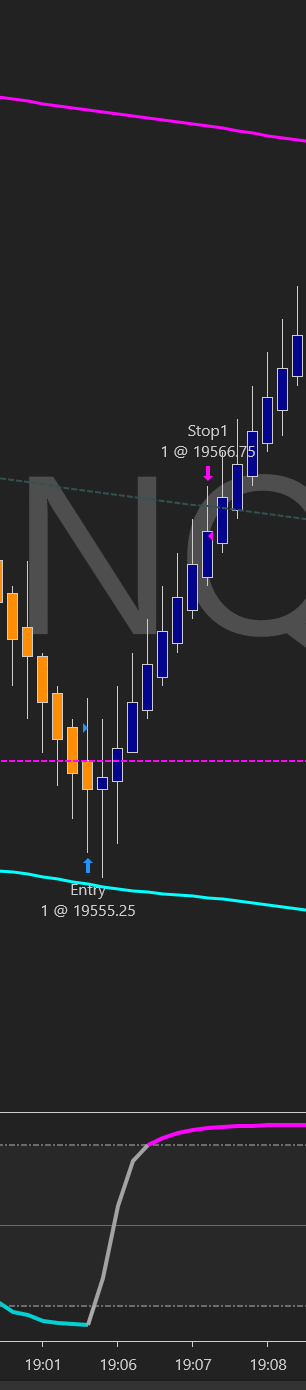
Example of a trade I just took. Got in a little early, should wait for first candle of opposite direction.
-
Thank you T!!!
-
⭐ ralph kabota reacted to a post in a topic:
Ultimate Scalper Pro & Ultimate Backdoor Needs Unlocking
-
⭐ ralph kabota reacted to a post in a topic:
Ultimate Scalper Pro & Ultimate Backdoor Needs Unlocking
-
⭐ rcarlos1947 reacted to a post in a topic:
Favorite Indies
-
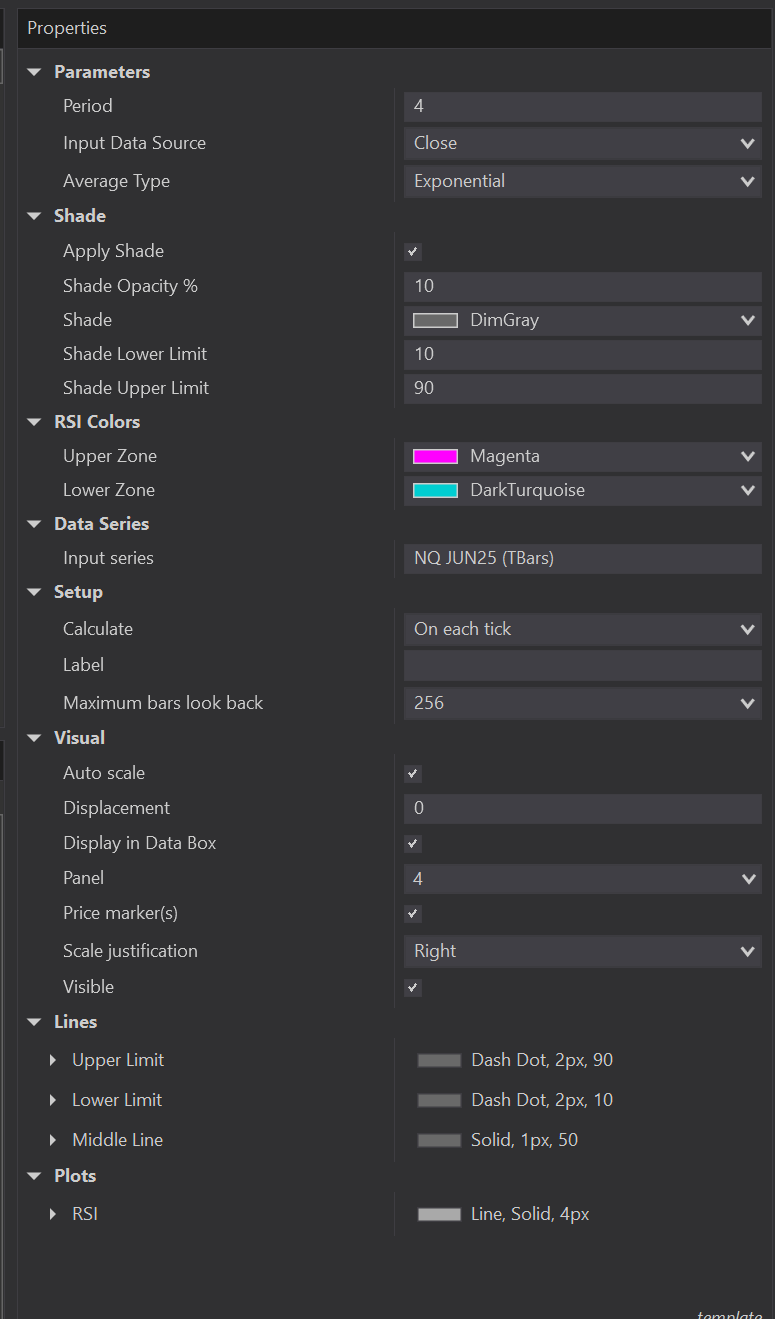
The RSI I use. https://workupload.com/file/U7eNQak4EcD
-
Can you pls share the indicators also?
-
⭐ ralph kabota reacted to a post in a topic:
strategies.steady-turtle.com
-
Probably going to bore you with this one but I have RSI on every chart, I use it differently though. I'll post settings and the one I use.
-
@Members: Can you pls share those 2 indicators, you were referring to?
- Yesterday
-
WolfeWaveVisual Indicator - User Manual Overview The WolfeWaveVisual indicator is designed to automatically identify and display Wolfe Wave patterns on your NinjaTrader 8 charts. This implementation features enhanced visualization, flexible detection parameters, and real-time alerts. Key Features Automatic Pattern Detection: Identifies both bullish and bearish Wolfe Wave patterns Clear Visual Markers: Highlights each swing point with diamonds and numbered labels ZigZag Visualization: Shows the underlying price structure used for pattern detection Target Price Projection: Calculates and displays potential price targets based on pattern geometry Configurable Parameters: Adjust sensitivity and visualization to suit different markets and timeframes Debug Mode: Provides detailed information about pattern detection process Real-time Alerts: Notifies you when new patterns form Parameter Settings Parameter Description Recommended Range FractalStrength Number of bars on each side to confirm swing points 2-5 MaxLookback Maximum number of bars to analyze for patterns 100-500 PatternTolerance Flexibility in pattern validation (higher = more patterns) 0.3-0.7 MinPointsForPattern Minimum number of swing points before pattern checking 5-10 ShowAllPoints Display all detected zigzag points True ShowTargetProjection Display target price projection lines True DebugMode Show detailed debug information True (initially) Color Settings Setting Description BullishColor Color for bullish Wolfe Wave patterns BearishColor Color for bearish Wolfe Wave patterns ZigZagColor Color for the zigzag connecting swing points Pattern Identification The indicator identifies two types of Wolfe Wave patterns: Bullish Wolfe Wave Forms during downtrends Consists of 5 points (3 valleys and 2 peaks) Point 5 is lower than point 3 Points 1-3 and 2-4 converge Potential buying opportunity at point 5 Bearish Wolfe Wave Forms during uptrends Consists of 5 points (3 peaks and 2 valleys) Point 5 is higher than point 3 Points 1-3 and 2-4 converge Potential selling opportunity at point 5 Troubleshooting Issue Solution No patterns detected Increase PatternTolerance, decrease FractalStrength Too many false patterns Decrease PatternTolerance, increase FractalStrength ZigZag lines missing Ensure ShowAllPoints is enabled No visual elements Check that the indicator is applied to price panel Tips for Best Results Use on higher timeframes (H1, H4, Daily) for more reliable patterns Combine with volume analysis and support/resistance levels Start with DebugMode enabled to understand detection process Adjust FractalStrength based on market volatility Consider patterns more reliable when they align with the overall trend Technical Notes Indicator recalculates on each new bar Pattern detection uses a zigzag-based approach Target prices are calculated using projection of line 1-3 Alerts trigger once when a pattern is first detected
-
 iamhktr joined the community
 -
Looking how perfect it just nailed this move down. Both indies were in synchronization. https://limewire.com/d/ucK14#3i6GG0k3lP Just to be clear though, I am not promoting nor I am recommending anything here nor your results or outcomes would be the same as mine. Just sharing my thoughts.