All Activity
- Past hour
-

A new diamond in the rough- a very good educator
darius00101 replied to Traderbeauty's topic in Ninja Trader 8
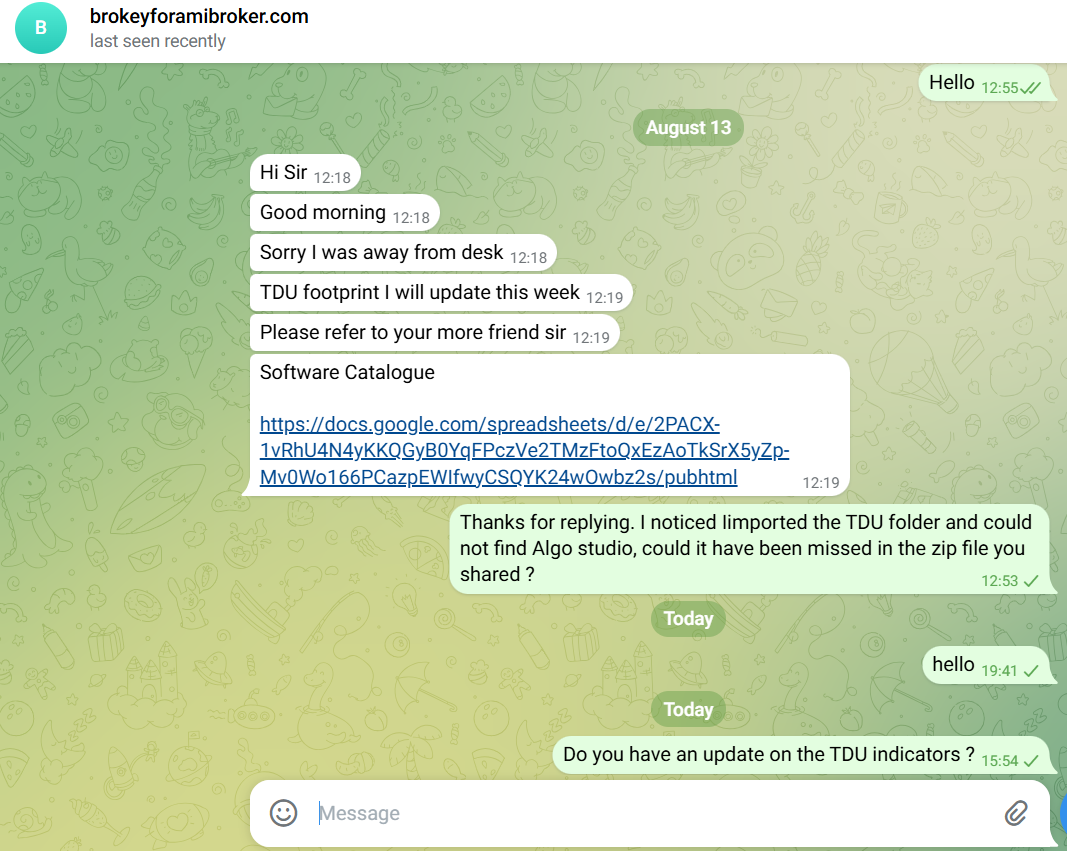
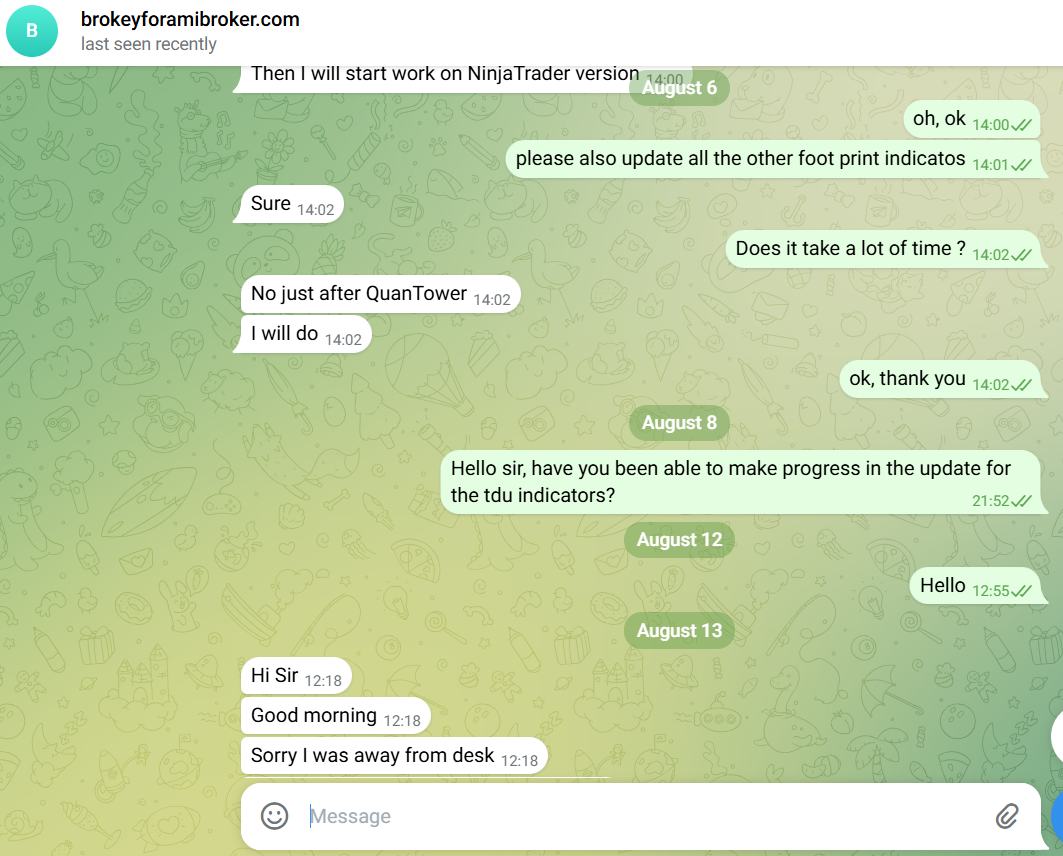
Thanks for the comments on TDU Algo Studio, as this educator said everything was included in the TDU package I was just trying to get an answer. But I am more concerned that I was told the version of the indicator were the latest and that they will be updated, as of today, I have not recevied a response yet. I replied on this thread asking for help because some people had good experience with brokey, is my first purchase. I hope this is just a delay in comunication and not that I got scammed. I have not tried purchasing from jhon, so I cannot compare. - Today
-

A new diamond in the rough- a very good educator
Denis replied to Traderbeauty's topic in Ninja Trader 8
i believe you got sold a free floating version for some mullah. welcome to jungle mate and sorry your loss but just look around you will find almost every single indicator here by few good members like apmoo and couple of others. what may look like gold is just a glitter at most of the time except jhon. -
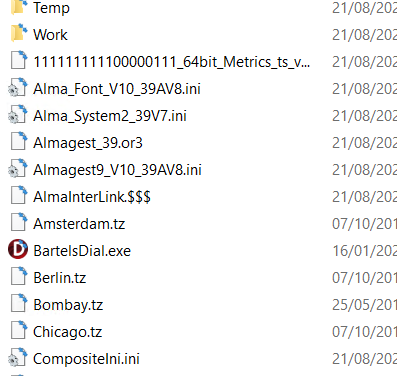
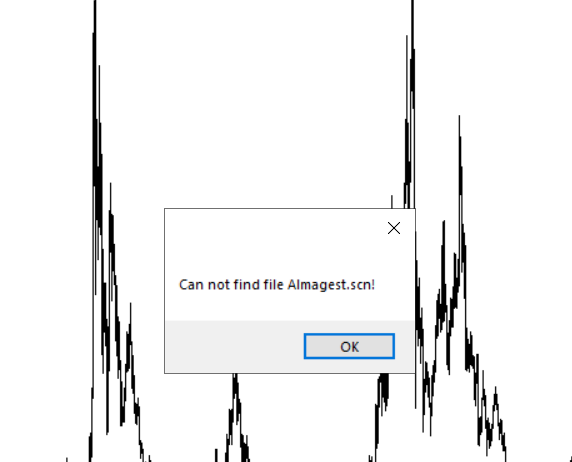
Did a fresh install. Same error. those files not just not there
-

REQ : david weis catching trend reversal dvd
owh5v replied to owh5v's topic in Forex Clips & Movie Request
hey yes i checked it all links are dead!! -

A new diamond in the rough- a very good educator
⭐ rcarlos1947 replied to Traderbeauty's topic in Ninja Trader 8
@darius00101 Be aware that if you're hoping for the latest TDU Algo Studio you may be disappointed to find that what is educated already is only the earliest versions. The current versions have not been cracked as far as I know. This forum has a request for @apmoo@kimsam@the_evil to give it a try at educating it. -

Market Technical Analysis by RoboForex
RBFX Support replied to RBFX Support's topic in Technical Analysis
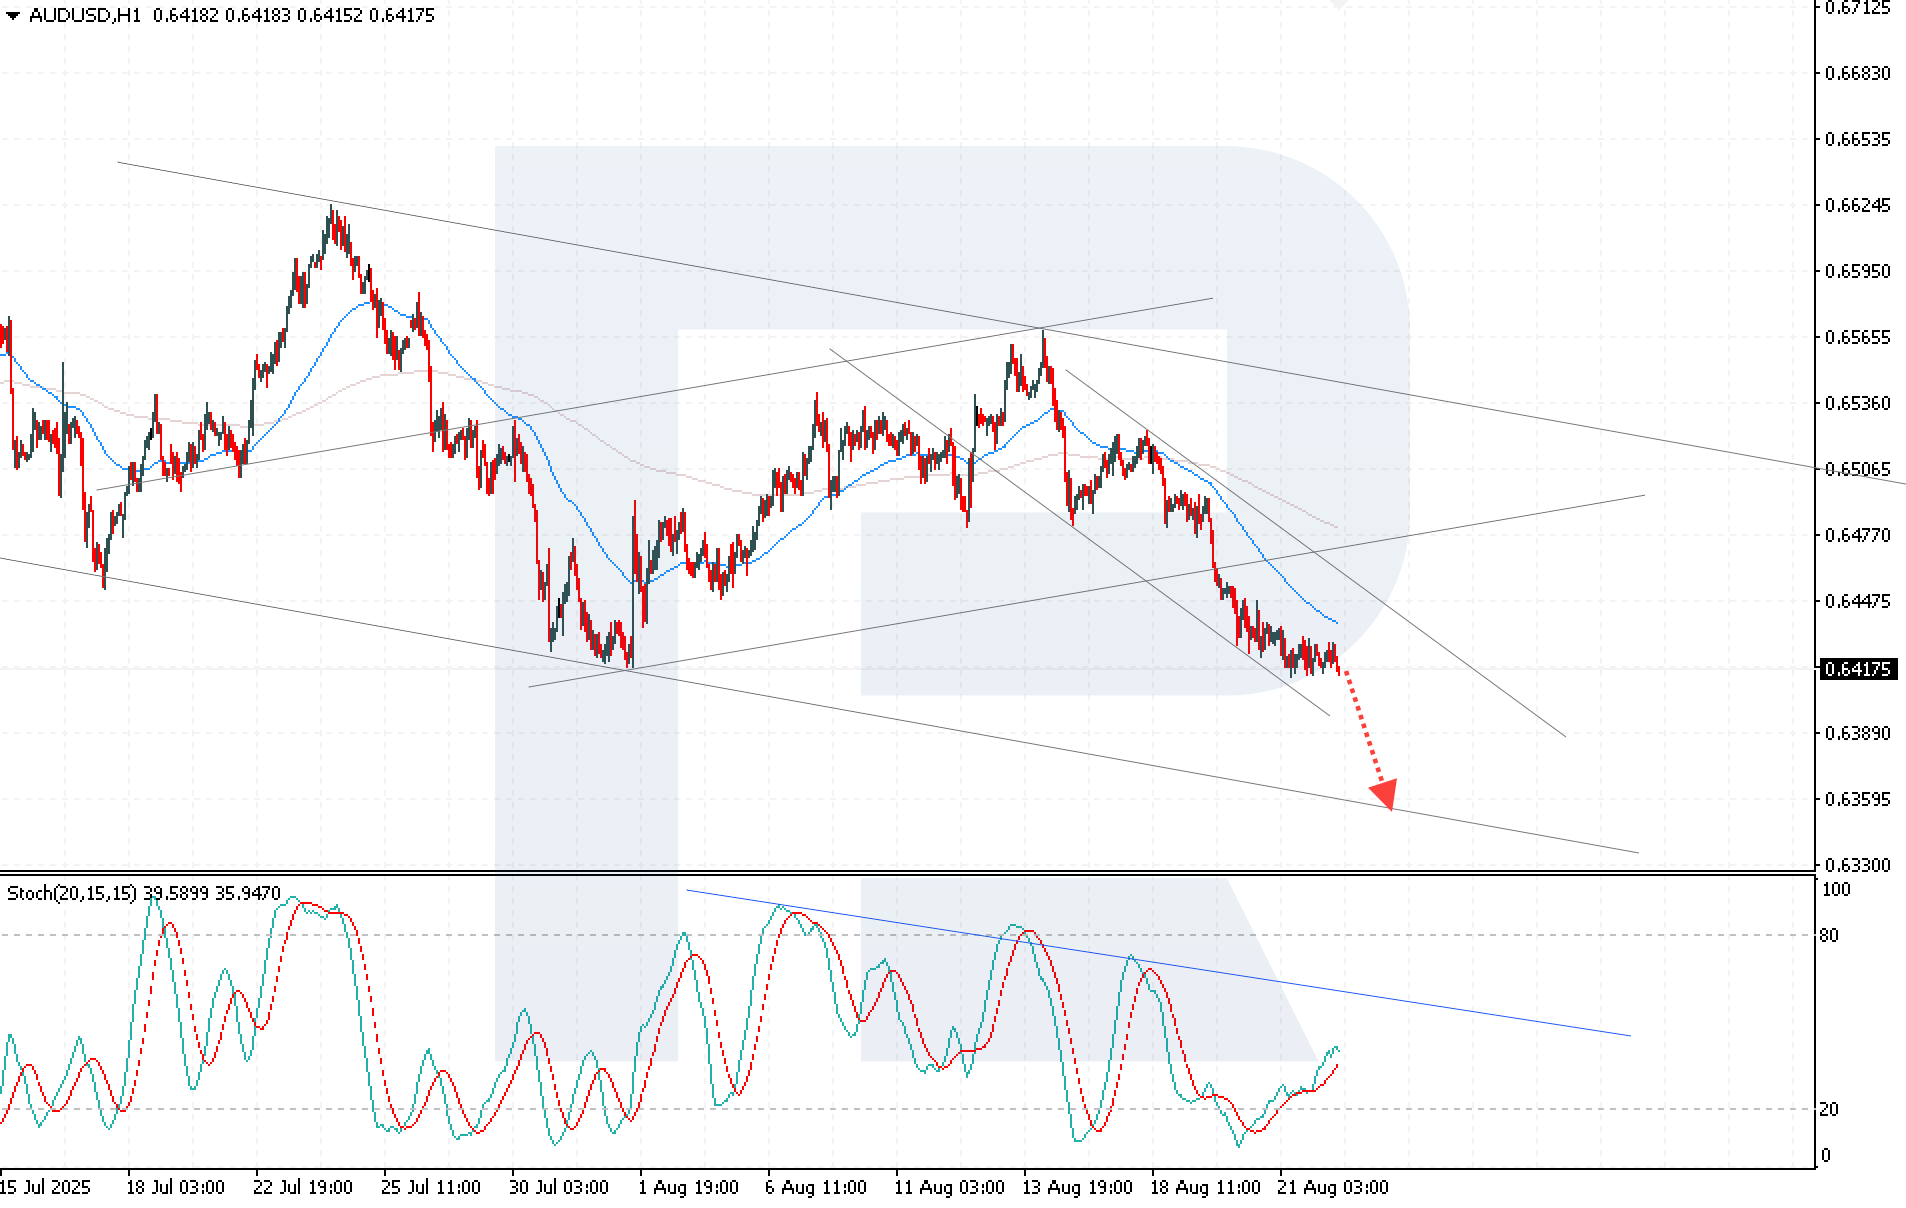
AUDUSD decline slows ahead of Powell’s speech The AUDUSD rate continues to fall amid expectations of Fed Chair Jerome Powell’s speech, with the price currently at 0.6417. Find more details in our analysis for 22 August 2025. AUDUSD technical analysis The AUDUSD rate remains within a descending channel. Sellers consolidated below the 0.6440 level, which increases downside pressure on the pair and raises the likelihood of further bearish momentum. The AUDUSD pair continues to fall, but reaching key support and rising business activity create conditions for possible short-term stabilisation Read more - AUDUSD Forecast Attention! Forecasts presented in this section only reflect the author’s private opinion and should not be considered as guidance for trading. RoboForex bears no responsibility for trading results based on trading recommendations described in these analytical reviews. Sincerely, The RoboForex Team
-
roboforex Market Fundamental Analysis by RoboForex
RBFX Support replied to RBFX Support's topic in Fundamental Analysis
US Tech forecast: the index continues to rise, but correction risks grow The uptrend in the US Tech stock index has shifted into a downward correction. The US Tech forecast for next week is negative. US Tech forecast: key trading points Recent data: the US manufacturing PMI preliminarily came in at 53.3 in August Market impact: this data strengthens expectations for overall economic momentum, which may be viewed positively by equity investors Fundamental analysis The US manufacturing PMI reached 53.3 points in August 2025, significantly above the forecast of 49.7 and the previous reading of 49.8. A PMI reading above 50 indicates an expansion in manufacturing activity. This result signals that the industrial sector is in a growth phase with increasing demand for goods. Although PMI directly relates to industrial production, its positive reading indirectly impacts the high-tech sector. Rising manufacturing activity requires more automation, digitalisation of processes, and the use of advanced technologies. This boosts demand for semiconductor products, cloud services, software, and industrial robotics. As a result, the tech-heavy index may find additional support. RoboForex Market Analysis & Forex Forecasts Attention! Forecasts presented in this section only reflect the author’s private opinion and should not be considered as guidance for trading. RoboForex bears no responsibility for trading results based on trading recommendations described in these analytical reviews. Sincerely, The RoboForex Team -
sure, let me do a clean install again.
-

Can anybody educate best0rderflow.com trial indicator?
arabitech replied to ⭐ levelupdown's topic in Ninja Trader 8
Discord links usually expires after sometimes. -
Both new and the old veterans can take help from a demo account to go back or forward test the markets.
-

HFMarkets (hfm.com): Market analysis services.
AllForexnews replied to AllForexnews's topic in Fundamental Analysis
[b]Date: 22nd August 2025.[/b] [b]The Fed’s Cut For September is Dimming, Pressuring Stocks![/b] US stocks continue to decline as the possibility of the Federal Reserve adjusting rates in September is becoming less likely. Inflation continues to be a concern for the FOMC, while the latest economic data indicates growth for the US economy. The US Purchasing Managers’ Index is the latest economic data made public, but the US significantly beat projections. The market now turns its attention to the Jackson Hole Symposium and the Fed Chairman’s speech at 14:00 GMT. Global Economy Obtains Boost From Latest Data The Purchasing Managers’ Index from around the globe was generally positive, with most countries beating previous expectations. However, the US PMI data was surprisingly significantly higher than economists were expecting. Services PMI Data - 55.4 Vs 54.2 Projections Manufacturing PMI Data - 53.3 vs 49.7 Projections (highest in 2 years) Positive economic data is usually observed to create a bullish trend within the stock market. However, under the current market conditions, where investors are looking for certainty over the Federal Reserve’s next move, the positive data is fueling the downward momentum. Currently, the economic data and comments from members of the Federal Open Market Committee are raising doubts over a September rate cut. The Fed Bank of Chicago President, Austan Goolsbee, is the latest member to speak at the Jackson Hole Symposium. He told journalists that inflation is lower than expected, but there is data which is a concern for the regulator. ‘The last inflation report that came in, where you saw services inflation, which is probably not driven by the tariffs, ’ significantly increased, as has producer inflation. However, most members of the FOMC are also concerned about the employment sector, which is cooling down and why investors are keen for interest rates to start falling. The possibility of an interest rate cut in September has now fallen from 85.5% to 73.0% which means a cut is still a likely outcome. The market is likely to obtain further clarity on the matter as the Federal Reserve Chairman is due to speak at 14:00 GMT. The NASDAQ and SNP500 are likely to experience high volatility during this time. NASDAQ Performance and Technical Analysis The NASDAQ has not risen in value since August 12th and is currently trading 3.70% lower than its recent high. Currently, all global indices are trading lower, the VIX index edges higher, and the put/call order ratio rises to the 0.70 mark. These factors currently provide a bearish bias for the NASDAQ and point to further downward price movement. The price will depend on the Fed speech this afternoon and NVIDIA’s quarterly earnings report on the 27th. The report has a consensus Earnings Per Share forecast of $0.94 (Zacks, 14 analysts), up from $0.60 a year ago. If higher than expectations, the price of the most influential stock for the NASDAQ potentially may see significant gains in the upcoming weeks. NASDAQ 30-Minute Chart The price of the NASDAQ continues to remain below the 75-bar EMA, below the day’s VWAP and the 50.00 level on the RSI. This points to a continued bearish trend for the upcoming sessions, as do the bearish crossovers on the smaller timeframes. Based on signals from price action momentum, if the price remains below 23,104.42, sell signals are likely to remain intact. Key Takeaway Points: Strong US PMI data has reduced expectations of a September rate cut, with odds falling from 85.5% to 73%. The uncertainty continues to pressure stocks. While inflation is easing, services and producer prices remain elevated, adding pressure on the Fed. Investors await Fed Chair Powell’s speech at 14:00 GMT, which could drive volatility in the NASDAQ and S&P 500. The NASDAQ is 3.7% off recent highs, trading below key technical levels, with sentiment bearish unless NVIDIA’s upcoming earnings surprise to the upside. [b]Always trade with strict risk management. Your capital is the single most important aspect of your trading business.[/b] [b]Please note that times displayed based on local time zone and are from time of writing this report.[/b] Click [url=https://www.hfm.com/hf/en/trading-tools/economic-calendar.html][b]HERE[/b][/url] to access the full HFM Economic calendar. Want to learn to trade and analyse the markets? Join our webinars and get analysis and trading ideas combined with better understanding of how markets work. Click [url=https://www.hfm.com/en/trading-tools/trading-webinars.html][b]HERE[/b][/url] to register for FREE! [url=https://analysis.hfm.com/][b]Click HERE to READ more Market news.[/b][/url] [b]Michalis Efthymiou HFMarkets[/b] [b]Disclaimer:[/b] This material is provided as a general marketing communication for information purposes only and does not constitute an independent investment research. Nothing in this communication contains, or should be considered as containing, an investment advice or an investment recommendation or a solicitation for the purpose of buying or selling of any financial instrument. All information provided is gathered from reputable sources and any information containing an indication of past performance is not a guarantee or reliable indicator of future performance. Users acknowledge that any investment in Leveraged Products is characterized by a certain degree of uncertainty and that any investment of this nature involves a high level of risk for which the users are solely responsible and liable. We assume no liability for any loss arising from any investment made based on the information provided in this communication. This communication must not be reproduced or further distributed without our prior written permission. -

Should we join forces with TGF Community? [Answer please]
soussay replied to MrAdmin's topic in Announcements
Really yes, when accepting the forum rules😊 -
 Minerva reacted to a post in a topic:
Timingsolution & Nifty Updates - 3
Minerva reacted to a post in a topic:
Timingsolution & Nifty Updates - 3
-
Re-run the TSA setup rather than asking for files. The setup is posted in the 1st thread.
-
GainX reacted to a post in a topic:
Greatest Trades of All Time!
-
GainX reacted to a post in a topic:
Greatest Trades of All Time!
- Yesterday
-
A new diamond in the rough- a very good educator
darius00101 replied to Traderbeauty's topic in Ninja Trader 8
Hi , i am new to the forum and made a purchase to brokey in August 6, the indicator was sent to me in minutes. Unfortunately it was not the latest version and brokey said that it can be updated. Maybe someone can help me get in touch with this person, the communication has not been very fluid. Is someone else experiencing the same delay ? Here is my conversation after making the purchase.
-
can you share those files pls
-

REQ : david weis catching trend reversal dvd
E-Money replied to owh5v's topic in Forex Clips & Movie Request
Using the search function, there is already post about this. Did you check that post for the links? Moderators should delete this request. -
 ⭐ Minion reacted to a post in a topic:
Issues? We changed hosting. Report here
⭐ Minion reacted to a post in a topic:
Issues? We changed hosting. Report here
-
HFMarkets (hfm.com): Market analysis services.
AllForexnews replied to AllForexnews's topic in Fundamental Analysis
[b]Date: 21st August 2025.[/b] [b]Has Gold’s Bullish Trend Lost Its Steam?[/b] The price of Gold has been trading within a recurring price range between $3,240 and $3,456 throughout the summer months, leaving traders wondering. Has the commodity, which has witnessed one of the strongest trends of the past 2 years, lost its steam? Most economists believe that Gold will continue to experience a bullish trend throughout the remaining months of 2025. However, technical analysis is not currently indicating upward price movement for the medium to long term. Instead, indications currently point to the range-bound condition continuing, meaning the average price will play a key role in analysis and traders’ targets. Average Price of Range: $3,330.50 XAUUSD Daily Chart Throughout August, the price of Gold has mainly fallen due to peace talks between Russia, the US and Ukraine keeping to a positive tone. The increased likelihood of a ceasefire would boost the market’s sentiment towards risk, pressuring the price of Gold. Economists advise that the price of Gold is likely to come under pressure in the event that the conflict comes to an end, but is not likely to fully correct the gains over the past 2-years. Furthermore, yesterday, the US Department of Commerce broadened its sectoral tariffs, which had previously focused mainly on metals and automobiles. The new measures impose 50% duties on an additional 407 categories of imported goods, including fire extinguishers, building materials, and aluminium or steel-based chemicals. Experts caution that these tariffs could intensify inflationary pressures, as they now cover goods valued at an estimated $320 billion, up from $190 billion. The additional cost, if put into effect, is likely to be passed on to consumers, resulting in inflation. Therefore, easing the monetary policy in the near term will become more difficult for the Federal Reserve. If the Federal Reserve opts not to cut interest rates in September, the price of Gold may witness renewed pressure. Currently, an interest cut remains the main likelihood; however, the possibility of a pause continues to increase. Due to the high producer inflation and new tariffs, investors are contemplating whether the Fed will indeed cut in September. Currently, the Fedwatch Tool’s possibility reading for a ‘pause’ continues to rise to 21%. This is significantly higher than last week’s reading of 7.9%. The ongoing Jackson Hole Symposium may also provide further indications of the future path of interest rates. If a pause by the Federal Reserve continues to become a likely possibility, and the Ukraine-Russia conflict looks on track to reduce tensions. The price of Gold may break the current pattern and decline. The commodity’s main support level can be seen at $3,122.00. [b]Always trade with strict risk management. Your capital is the single most important aspect of your trading business.[/b] [b]Please note that times displayed based on local time zone and are from time of writing this report.[/b] Click [url=https://www.hfm.com/hf/en/trading-tools/economic-calendar.html][b]HERE[/b][/url] to access the full HFM Economic calendar. Want to learn to trade and analyse the markets? Join our webinars and get analysis and trading ideas combined with better understanding of how markets work. Click [url=https://www.hfm.com/en/trading-tools/trading-webinars.html][b]HERE[/b][/url] to register for FREE! [url=https://analysis.hfm.com/][b]Click HERE to READ more Market news.[/b][/url] [b]Michalis Efthymiou HFMarkets[/b] [b]Disclaimer:[/b] This material is provided as a general marketing communication for information purposes only and does not constitute an independent investment research. Nothing in this communication contains, or should be considered as containing, an investment advice or an investment recommendation or a solicitation for the purpose of buying or selling of any financial instrument. All information provided is gathered from reputable sources and any information containing an indication of past performance is not a guarantee or reliable indicator of future performance. Users acknowledge that any investment in Leveraged Products is characterized by a certain degree of uncertainty and that any investment of this nature involves a high level of risk for which the users are solely responsible and liable. We assume no liability for any loss arising from any investment made based on the information provided in this communication. This communication must not be reproduced or further distributed without our prior written permission. -
 ashokaraj joined the community
 -
Somehow those files are missing
-
 qifaso joined the community
 -

The major update in Amibroker 6.93 c****ed, AFLWIZ.
tony01 replied to ⭐ Atomo12345's topic in Amibroker
I don't understand why Amibroker is so difficult to crack, because there are great crackers on the net.If someone knows a good cracker, send me the link to contact him. Thanks -
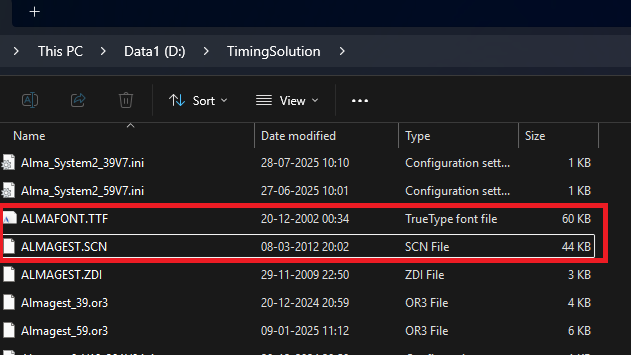
I am not sure about the error or the weird symbols but I suspect 2 files as in the picture should be present in the installed directory. If not a reinstallation might help (the original TSA setup not the Terra updates).
-
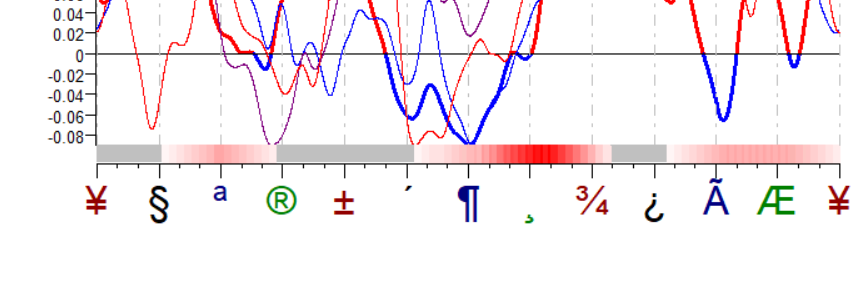
Also when i click at astronomy, the symbols look every weird
-
Hockman reacted to a post in a topic:
Timingsolution & Nifty Updates - 3
-
Heyy, Thank you so much for this. I just have this query, the transit thingy is not working for me, whenever i click on it, it gives this error..