⤴️-Paid Ad- Check advertising disclaimer here. Add your banner here.🔥
All Activity
- Past hour
-
Sorry, that is it. BWT and MWT are the best. Looks like they improved the MWT recently...so i don't which version you have. But this is most of it. Which file did you load?
- Today
-
 ⭐ option trader reacted to a post in a topic:
All the cycles knwes for Amibroker 7.00.1 64 bit.
⭐ option trader reacted to a post in a topic:
All the cycles knwes for Amibroker 7.00.1 64 bit.
-
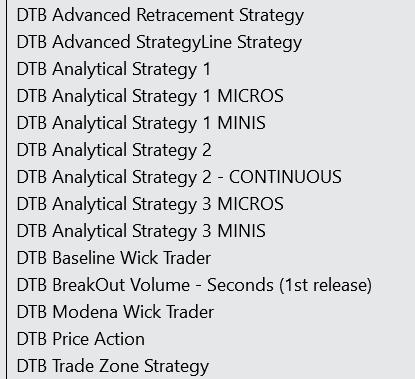
by DWT, did you mean BWT? (Baseline Wick Trader)? This is the list of bots I can see:

-
 Oana SSS reacted to a post in a topic:
https://www.dtbtraders.com/
Oana SSS reacted to a post in a topic:
https://www.dtbtraders.com/
-
nefre821 reacted to a post in a topic:
Timingsolution & Nifty Updates - 3
-
You posted it in a separate thread but people like to create duplicates. So, MWT and DWT are the bots to use? They have many templates. Do you know which ones to recommend using?
-
chauchau1208 reacted to a post in a topic:
Timingsolution & Nifty Updates - 3
-
fxtrader99 reacted to a post in a topic:
https://www.dtbtraders.com/
-
I shared the most recent files a couple of days ago but i don't see my link anywhere
-
Tried this before. MWT strategy in there does not look right and the DWT strategy there is missing. Those are their main strategies
-

NQ Ultra - Futures Trading Bot // https://tradegreater.com/
Boka replied to luludulu's topic in Ninja Trader 8
forward test or market replay -

NQ Ultra - Futures Trading Bot // https://tradegreater.com/
sa5f replied to luludulu's topic in Ninja Trader 8
So, how do you backtest? -
⭐ sapperindi reacted to a post in a topic:
Timingsolution & Nifty Updates - 3
-
NQ Ultra - Futures Trading Bot // https://tradegreater.com/
Boka replied to luludulu's topic in Ninja Trader 8
HA Candles backtest results are absolutely 100% incorrect. -
NQ Ultra - Futures Trading Bot // https://tradegreater.com/
sa5f replied to luludulu's topic in Ninja Trader 8
My Heiken Ashi Backtest -
⭐ ralph kabota reacted to a post in a topic:
Timingsolution & Nifty Updates - 3
-
⭐ ralph kabota reacted to a post in a topic:
Timingsolution & Nifty Updates - 3
-
NQ Ultra - Futures Trading Bot // https://tradegreater.com/
Boka replied to luludulu's topic in Ninja Trader 8
Which candles are you using to run this algo? If you are using Renko candles, then the backtest results are absolutely 100% incorrect. -
hxxps://workupload.com/file/739h9rzK6xw 🍦
-
NQ Ultra - Futures Trading Bot // https://tradegreater.com/
sa5f replied to luludulu's topic in Ninja Trader 8
Have you noticed a discrepancy? The results from backtesting and live trading are completely different—the disparity is massive. Is there any way to make the backtesting results more closely align with live performance? -
SPAR reacted to a post in a topic:
Entropy Voltex by renkokings
-
SPAR reacted to a post in a topic:
Entropy Voltex by renkokings
- Yesterday
-
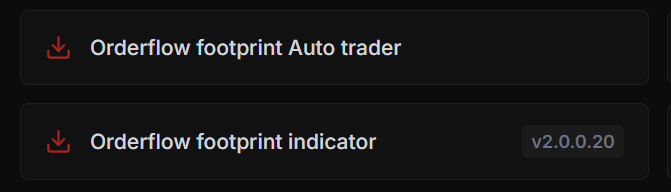
 which v26 are you referring to? I only see 2.0.0.20 on their website. Tnis is wnat it looks like without tick replay: https://ibb.co/vpRdTpC
-
I 100% agree. NinzaCo's marketing (and many others like it) is all about visual impact and instant gratification. A video can never, and I mean never, be the basis for judging a trading system. Videos are, by definition, 'cherry-picked', meaning they only show the specific market segments where the indicator worked perfectly! To consider a trading system truly reliable and profitable, you need much more than a few catchy clips. Here is what actually matters: Rigorous Statistical Backtesting: 10 trades are not enough. You need a sample size of hundreds, if not thousands, of trades across different market cycles (trends, sideways markets, high and low volatility). Max Drawdown Analysis: The real question isn’t 'how much does it make when it wins,' but rather 'how much do you lose and how long do you stay in the red' when the system inevitably goes through a losing streak. Profit Factor and Risk/Reward: A system that wins 90% of the time but has a terrible risk/reward ratio (where one single loss wipes out ten wins) is destined to fail. Forward Testing (Live or Demo): You have to see how the system reacts in real-time, accounting for spread, slippage, and actual volatility. Robustness and Overfitting: Many of these indicators are over-optimized for past data. They worked great yesterday, but they will stop working tomorrow because they cannot adapt to changing market conditions.
-
As I have said in the past, plenty of times. The "phenomenon" of NinzaCo stuff. Once you see 1 of their stuff, your first impression is always...You really want it. You really wanna buy it. The fact that we already have more than 20 plus of their indicators posted. Yet, how many of them you actually keep and use for your daily trading? They always look good the second you see it. Especially the video clips of their indicators. Winners after winners. So effortlessly. So easy. So stress free. But, in reality of actual trading, really?🤗
-
Try this. Comes with all the bots. https://limewire.com/d/w3GMj#dWqQuOtFr0
-
 Also TDU Footprint would be great! I compared how it works against Tick Replay vs Live Data no tick replay - and it produces same data without tick replay on live data... TDU Footprint indicator latest V26 beta is great - anyone can educate it along with Footprint Trader?
 -
they offer 2 days free trial: https://tradingacademi.com/product/xtrend-algo-gold-edition-v6-2-day-free-trial-ninjatrader-8/ Did you try it out to see if it is any good?
-
How good is it? I guess you could keep creating a new account and get another 7 days trial.
-

Complete Elliott Waves formulas for Metastock 20.
⭐ Atomo12345 replied to ⭐ Atomo12345's topic in Trading Platforms
I think that the best are these four waves. For example this {Bullish Elliott Waves (Fifth Wave)} for S&P500, forecast the actual objective for the Fifth Wave to 7500-7700 probably to the end of July-August 2026. -
U can share your version please @trader88
-
Modena Wick on 200/10 DTB doing quite good today on MNQ: https://ibb.co/XfGpGgtC
-

Complete Elliott Waves formulas for Metastock 20.
⭐ epictetus replied to ⭐ Atomo12345's topic in Trading Platforms
Thanks for sharing, that's great information. When it comes to Elliott Wave theory, I think the main issue is the correlation between large and small waves. It would be great to be able to do this in a healthy way. -

Market Technical Analysis by RoboForex
RBFX Support replied to RBFX Support's topic in Technical Analysis
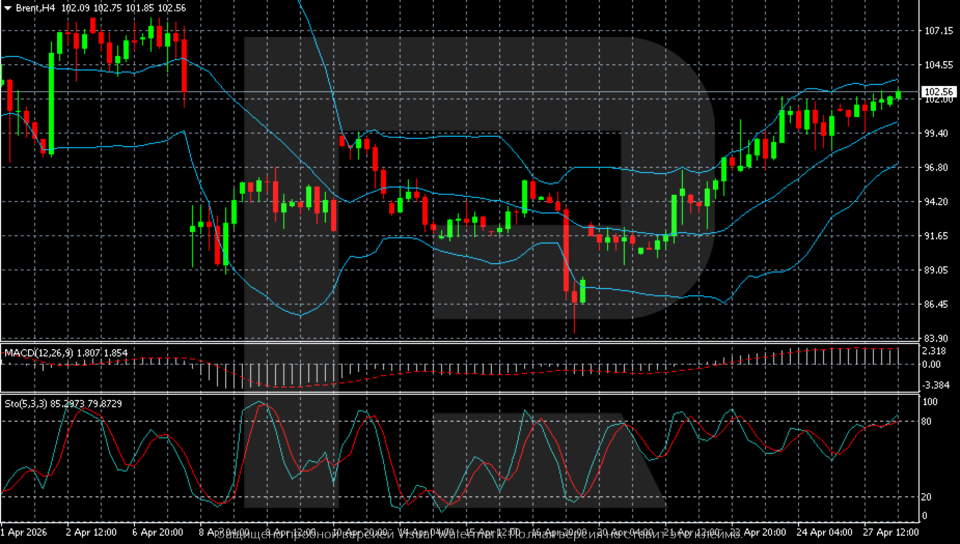
Brent stabilises after a volatile start to the week, but the key developments still lie ahead Brent is in a strong position at 102.56 USD, with negotiations continuing, while the risk premium remains high. Find out more in our analysis for 28 April 2026. Technical outlook The Brent H4 chart shows that after a sharp fall to the area below 90, the market reversed and moved into a confident recovery. A series of higher lows and higher highs has formed, indicating upward momentum. Brent prices continue to rise as the conflict in the Middle East continues. Read more - Brent Forecast Attention! Forecasts presented in this section only reflect the author’s private opinion and should not be considered as guidance for trading. RoboForex bears no responsibility for trading results based on trading recommendations described in these analytical reviews. Sincerely, The RoboForex Team
-
roboforex Market Fundamental Analysis by RoboForex
RBFX Support replied to RBFX Support's topic in Fundamental Analysis
US 500 forecast: the index extends gains and hits new all-time highs After reaching another all-time high, the US 500 index is showing signs of a short-term correction in its uptrend. The US 500 forecast for today is positive. US 500 forecast: key takeaways Recent data: US services PMI came in at 51.3 in April Market impact: the data is positive for the stock market Fundamental analysis The US services PMI came in at 51.3, above expectations of 50.5 and the previous reading of 49.8. Since the index moved back above the 50-point threshold, this signals the services sector has returned to expansion after the prior weak reading. Investor sentiment is also being influenced by the progress of US-Iran talks, which have not yet provided clear signals that the conflict is coming to an end. For the US 500 index, this release can be viewed as moderately positive overall, as the services sector represents a large share of the US economy and is directly tied to consumer demand, employment, corporate earnings, and overall business resilience. A stronger PMI could signal that the economy retains the ability to grow despite high interest rates and consumer caution. RoboForex Market Analysis & Forex Forecasts Attention! Forecasts presented in this section only reflect the author’s private opinion and should not be considered as guidance for trading. RoboForex bears no responsibility for trading results based on trading recommendations described in these analytical reviews. Sincerely, The RoboForex Team