
⤴️-Paid Ad- Check advertising disclaimer here. Add your banner here.🔥
All Activity
- Past hour
-

VIP Membership - FREE upgrade for OLD and ACTIVE Members
Scott Branser replied to MrAdmin's topic in Announcements
THANK YOU! Can I be added as well? thx! -
 ytt2 joined the community
 - Today
-
 AI debt hits #Oracle and indices In posts from October 8 the vulnerability of the AI arms race was considered: building data centers requires huge investments, and high interest rates increase the cost of borrowing. At that time, FreshForex analysts expected increased pressure on #NQ100 and #SP500. The latest sell-off supported this scenario. During the session on October 14, #Oracle lost about 9%, and the technology sector came under fire after US inflation statistics. At the time of preparing the material #Oracle is around $130.20, #NQ100 — 29,637.7 points, #SP500 — 7,702.5 points. Use bonus 300% on deposit from $100! Trade with increased volume and earn more profit. Learn more Why pressure may persist US inflation reached 3.7% year-on-year, exceeding the forecast of 3.6%. This intensified fears of a new Fed rate hike. For companies that finance AI infrastructure expansion through borrowing, such a turn means the risk of additional expenses even before investments begin to generate sufficient profit. Projects with long payback periods are particularly sensitive to interest rates. Expenses for equipment and construction arise now, while revenue from new capacities comes later. If the cost of borrowing rises, companies have to allocate more funds to interest payments. This can limit free cash flow and reduce stock attractiveness. Tension is also evident in the debt market. The cost of five-year credit default swap protection for #Oracle rose to a record 288 basis points. Creditors demand more for taking on risk, and equity investors more carefully assess the company's future cash flows. This increases pressure on businesses that need to continue large-scale investments. #Dell also came under pressure The sale also affected AI equipment manufacturers. As of October 14 #Dell lost 11.4%. An additional blow was the downgrade by Barclays: after a rapid rise in shares, analysts doubted that corporate spending on AI would provide sufficient business acceleration to justify high valuations. Now #Dell is around $506.70. According to FreshForex analysts, after such a sharp drop, a rebound is possible, but a sustainable recovery is still in question. For now, quotes remain below $520, there remains a risk of testing $500 with further decline to $490. The decline is not yet over According to FreshForex analysts, pressure on #Oracle, #NQ100, and #SP500 will persist in the upcoming trading sessions. Expensive borrowing remains a problem for the AI sector, so rebounds after the sell-off currently look like a temporary respite. The target indicated in the previous article 7,700–7,750 for #SP500 has been reached. Now a test of 7 650, and then — 7 600. For #NQ100, a return to 29 550 with a possible continuation of the decline to 29 400. For #Oracle, the nearest milestone is— $129,20: its breakout will pave the way to $120–123. For #Dell, maintaining quotes below $520 maintains the scenario of decline to $500, and then — $490. Our terminal offers 250+ trading instruments, including currency pairs, CFDs on stocks, indices, and crypto assets. Follow trends and earn! Profit from a downturn
 -
 2707 joined the community
 -

HFMarkets (hfm.com): Market analysis services.
AllForexnews replied to AllForexnews's topic in Fundamental Analysis
[B]Date: 16th October 2026.[/B] [B]NASDAQ Rebounds 2% as Fed Comments Boost Sentiment, DAX Outperforms.[/B] The stock market ends its four-day decline after regaining some confidence from the Federal Reserve Chair’s comments. At the IMF’s annual meeting, Kevin Warsh was clearly attempting not to create market volatility or further weaken sentiment. All indices, except the Nikkei 225, rose during the US session. Currently, the best-performing indices are European stocks, particularly the EURO STOXX 50 and German DAX. The worst-performing indices of the day so far are the Nikkei 225 and NASDAQ. Despite the rebound, investors should be aware that certain risks remain for the stock market. These include high energy prices, inflation, interest rates, and global debt risk. The NASDAQ Attempts to Rebound Despite Continued Risks & Concerns The NASDAQ rose 2.00% during the US session after declining to its lowest level since 18 September. The asset found support from a slightly dovish and confident Fed Chair, as well as positive retail sales figures. The retail sales figure rose to 0.8%, slightly lower than the previous month, but higher than market expectations. In the previous days, the market faced mounting concerns over a possible economic slowdown. For this reason, the higher retail sales figure was particularly important in calming concerns. In addition, retail sales reading higher for two consecutive months boosts expectations of a positive earnings season. During the IMF’s annual meeting, Kevin Warsh and Christine Lagarde sounded relatively confident and dovish while speaking to journalists. Federal Reserve Chair Kevin Warsh made no comments regarding higher rates or his outlook for the US economy. Investors took the lack of comments on inflation as a dovish tilt, boosting the stock market. Nevertheless, concerns and risks continue to mount for the stock market. In addition to higher consumer inflation, producer inflation again rose above expectations. Markets were expecting the Producer Price Index to rise 0.6% and core producer inflation to rise 0.3%. The final figures were more than double, with the Producer Price Index rising 1.3%. Furthermore, Warsh warned that artificial intelligence may be driving demand in the near term, and said that, as a central banker, he’s taking the new technology seriously but also ‘soberly, responsibly’. Technology companies will start to announce their earnings reports next week. NASDAQ stocks due to announce their earnings report next week: Netflix - After Market Close Tuesday - 22nd Most Influential Stock - down 20% in 2026 Intuitive Surgical - After Market Close Tuesday - 38th Most Influential Stock - down 23% in 2026 Meta - After Market Close Wednesday - 8th Most Influential Stock - up 13% in 2026 Tesla - After Market Close Wednesday - 10th Most Influential Stock - down 17% in 2026 Lam Research - After Market Close Wednesday - 19th Most Influential Stock - up 49% in 2026 HFM - NASDAQ 15-Minute Chart In terms of technical analysis, the price of the index is obtaining bullish sentiment on smaller time frames, but medium-term timeframes paint a different picture. On the 1-hour chart, the price continues to move downwards, and the upward price movement marginally forms a retracement. Monitoring the 5-minute timeframe, if the price falls below $29,879.90, the short-term buy indications will fade and the chart will become more bearish. On larger time frames, this will apply when the price falls back below $29,647.85. If the price is to decline, the main support levels can be seen at $29,433.75 and $29,000.00. The outcome of the above earnings reports will significantly influence whether the index will rise or fall. German DAX - Weaker AI Demand & Defense Spending Boosts the DAX Due to concerns regarding AI and also US inflation, investors are turning to the German DAX. The German DAX has only risen by 1.40% in 2026 and is trading at a more competitive entry price. The German DAX is known to be a more stable option when investors wish to reduce exposure to the US and AI. Concerns about excessive AI valuations and financing costs have pressured technology companies. The DAX has relatively limited exposure to major AI-related stocks, making it less vulnerable to the selloff than some technology-heavy indices. However, next week’s earnings data will impact this. If tech earnings impress, the NASDAQ could rise again while the DAX may trade sideways. German 10-year government bond yields have declined to around 3.35%, easing some pressure on equity valuations and borrowing costs. However, falling yields also reflect concerns about economic growth. Nonetheless, for now, strong performance in German stocks supports the DAX. Rheinmetall rose 3.87% on Thursday, helping support the DAX. Defence stocks have benefited from continued investor interest amid geopolitical tensions. HFM - DAX 30-Minute Chart If the DAX is to continue rising, key levels that investors will be monitoring are the 25,655.00 and 26,630.00. Key Takeaways: The NASDAQ rebounds 2% as Fed comments and stronger-than-expected US retail sales restore investor confidence. The German DAX outperforms as investors shift towards European stocks amid AI valuation concerns. High energy prices, inflation, interest rates, and global debt continue to pose risks to stock markets. Upcoming earnings from Meta, Tesla, Netflix, and other major companies could influence the NASDAQ’s next direction. [B]Always trade with strict risk management. Your capital is the single most important aspect of your trading business.[/B] [B]Please note that times displayed based on local time zone and are from time of writing this report.[/B] Click [URL='https://www.hfm.com/hf/en/trading-tools/economic-calendar.html'][B]HERE[/B][/URL] to access the full HFM Economic calendar. Want to learn to trade and analyse the markets? Join our webinars and get analysis and trading ideas combined with better understanding of how markets work. Click [URL='https://www.hfm.com/en/trading-tools/trading-webinars.html'][B]HERE[/B][/URL] to register for FREE! [URL='https://analysis.hfm.com/'][B]Click HERE to READ more Market news.[/B][/URL] [B]Michalis Efthymiou HFMarkets[/B] [B]Disclaimer:[/B] This material is provided as a general marketing communication for information purposes only and does not constitute an independent investment research. Nothing in this communication contains, or should be considered as containing, an investment advice or an investment recommendation or a solicitation for the purpose of buying or selling of any financial instrument. All information provided is gathered from reputable sources and any information containing an indication of past performance is not a guarantee or reliable indicator of future performance. Users acknowledge that any investment in Leveraged Products is characterized by a certain degree of uncertainty and that any investment of this nature involves a high level of risk for which the users are solely responsible and liable. We assume no liability for any loss arising from any investment made based on the information provided in this communication. This communication must not be reproduced or further distributed without our prior written permission. -

Market Technical Analysis by RoboForex
RBFX Support replied to RBFX Support's topic in Technical Analysis
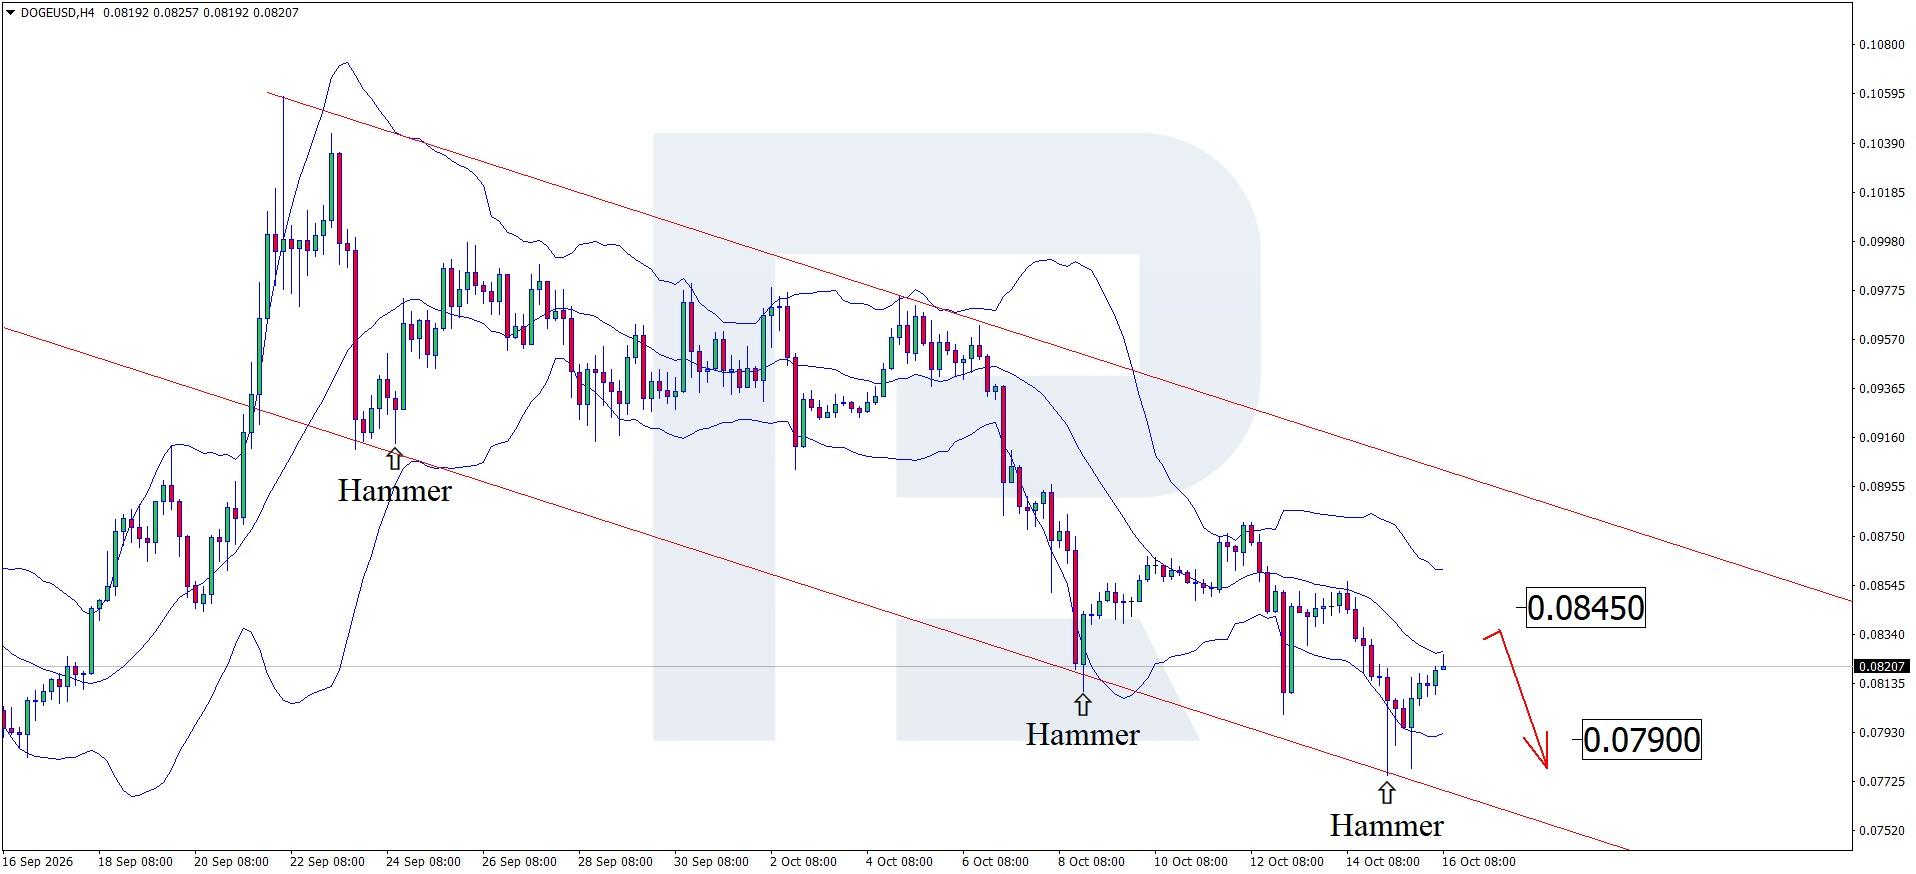
300 million DOGE transferred to an exchange: market fears a new wave of selling An unknown wallet has transferred 300 million DOGE to an exchange, increasing the supply of coins available there. The price currently stands at 0.0820. Technical outlook On the DOGEUSD H4 chart, the price has formed a Hammer reversal pattern near the lower Bollinger Band. At this stage, quotes may continue their corrective wave as the signal plays out, with the pullback target at the 0.0845 resistance level. Rising US inflation, capital outflows from risky assets, and unlimited issuance create a bearish fundamental backdrop for Dogecoin. Read more - DOGEUSD Forecast Attention! Forecasts presented in this section only reflect the author’s private opinion and should not be considered as guidance for trading. RoboForex bears no responsibility for trading results based on trading recommendations described in these analytical reviews. Sincerely, The RoboForex Team
-
roboforex Market Fundamental Analysis by RoboForex
RBFX Support replied to RBFX Support's topic in Fundamental Analysis
US Tech enters a downtrend The US Tech has shifted into a downtrend following the release of US inflation data and concerns about revenue growth in the AI sector. The price currently stands at 29,920. US Tech forecast: key takeaways Yields on 30-year US Treasury bonds have begun to decline thanks to demand from the US Treasury The US Consumer Price Index rose by 3.7% year-on-year US Tech forecast for 16 October 2026: 28,175 Fundamental analysis US consumer inflation data for September 2026, released on 14 October, creates a largely negative outlook for the US stock market, particularly the technology sector and the US Tech index. Annual CPI accelerated from 3.4% to 3.7%, exceeding analysts' forecast of 3.6%. Month-on-month inflation came in at 0.6%, in line with expectations but significantly higher than August's 0.4% reading. The published figures could have the greatest impact on the US Tech index, as technology companies are particularly sensitive to changes in interest rates and US Treasury yields. RoboForex Market Analysis & Forex Forecasts Attention! Forecasts presented in this section only reflect the author’s private opinion and should not be considered as guidance for trading. RoboForex bears no responsibility for trading results based on trading recommendations described in these analytical reviews. Sincerely, The RoboForex Team -
Hello les gars , je suis de france aussi , je. Inès de découvrir ce forum via un pote , je trade ES& NQ (micro aussi) sur le DOM JIGSAW combiné avec les NIVEAUX D’options GEX au plaisir de partager avec vous
-
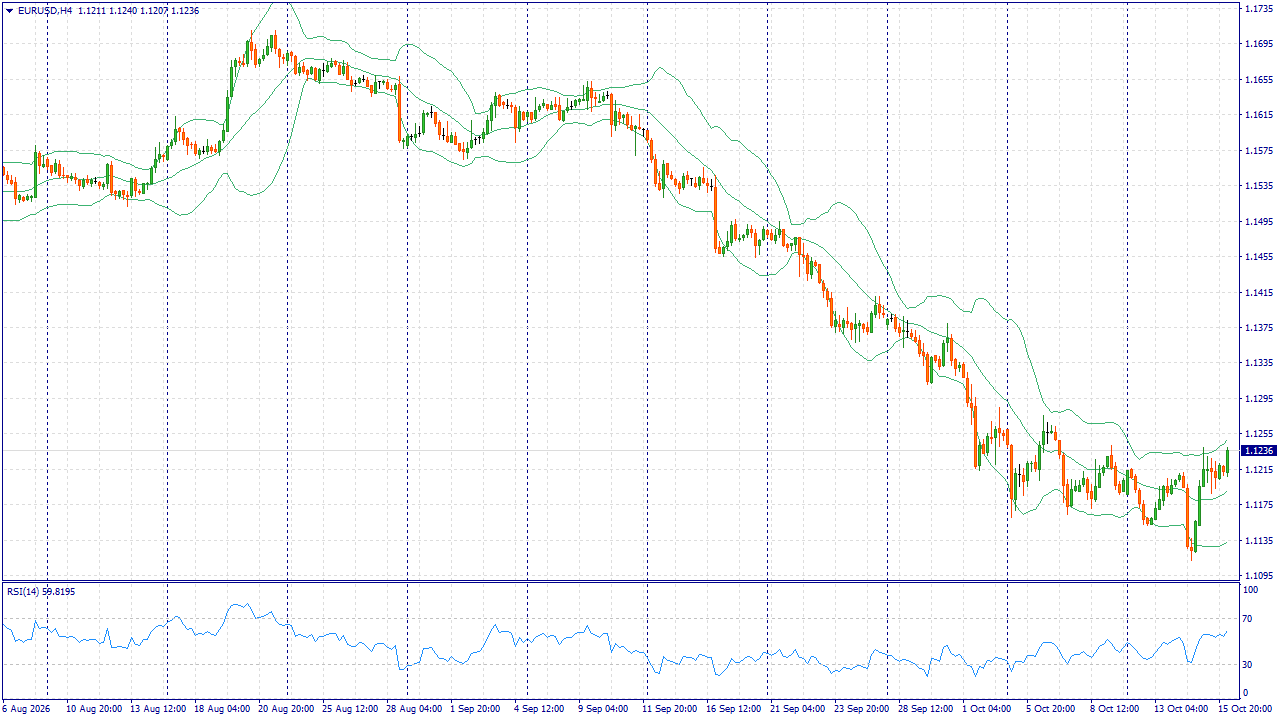
Fundamental Market Analysis for October 16, 2026 EURUSD EURUSD: The euro is supported by declining US bond yields: dollar investments become less attractive. Amid concerns over artificial intelligence spending, investors are buying US debt, but the currency itself has not yet benefited from this. For EURUSD, this creates an opportunity to continue its recovery after the recent decline. From the Eurozone side, today's final assessment of September inflation is important. Preliminary data showed price growth accelerating to 3.8% year-on-year, maintaining grounds for further ECB rate hikes. Confirmation of these figures will support euro interest rate expectations, although expensive energy simultaneously worsens the outlook for the European economy. The main risk to pair growth is a return to dollar demand with more hawkish Fed signals. Strong US inflation leaves such an opportunity, while France's debt problems limit the attractiveness of the euro. As long as US yields are falling and immediate tightening does not receive new confirmation, the base scenario for the current session allows for moderate EURUSD growth. Trading idea: BUY 1.1215, SL 1.1190, TP 1.1270 Up to $20 per lot with real funds - get guaranteed income by joining the promotion Cashback! You can find more analytical information on our website.
-
 k2xx joined the community
 - Yesterday
-
 GGPARIS joined the community
 -
Welcome to Indo-Investasi.com. Please feel free to browse around and get to know the others. If you have any questions please don't hesitate to ask.
-
 FunnyMoney joined the community
 -
roboforex Market Fundamental Analysis by RoboForex
RBFX Support replied to RBFX Support's topic in Fundamental Analysis
JP 225 declines: correction within the ascending channel exceeds 6.5% AI investment and industrial demand support the Japanese economy, but the JP 225 is forming a downward wave, with the price currently hovering at 64,656.0. JP 225 forecast: key takeaways Japan’s household spending fell by 3.1% year-on-year Rising US government bond yields are reducing investor demand for risk assets worldwide JP 225 forecast for 15 October 2026: 62,675.0 Fundamental analysis Household spending data for Japan released on 9 October 2026 indicates that domestic demand remains weak, despite some improvement compared to the previous month and analysts' expectations. In August, Japanese households' spending fell by 3.1% year-on-year in real terms, against a projected decline of 3.5%. For the Japanese stock index JP 225, the data has mixed implications. On the one hand, the better-than-expected result could provide moderate support to market sentiment, as it indicates a smaller deterioration in consumer activity than previously anticipated. RoboForex Market Analysis & Forex Forecasts Attention! Forecasts presented in this section only reflect the author’s private opinion and should not be considered as guidance for trading. RoboForex bears no responsibility for trading results based on trading recommendations described in these analytical reviews. Sincerely, The RoboForex Team -
HFMarkets (hfm.com): Market analysis services.
AllForexnews replied to AllForexnews's topic in Fundamental Analysis
[B]Date: 15th October 2026.[/B] [B]CPI Shock Triggers ‘Risk-Off’ Sentiment: What It Means for Gold and the NASDAQ.[/B] The US inflation rate, as well as core inflation data, reads higher than analysts' previous expectations. The US inflation rose from 3.4% to 3.7%, while core inflation rose to 2.6%. Both inflation readings are 0.1% higher than previous expectations, indicating that the Federal Reserve will almost certainly hike before year-end. The reading was quick to trigger volatility and strong order flow as markets reacted. One of the most volatile assets was Gold, which fell 2.30% from high to low. However, the asset that had the most one-sided trend was the NASDAQ. The NASDAQ is currently trading at a four-week low. US Consumer Price Index Prompt ‘Risk-Off’ Market Move The issue for investors is not necessarily that inflation is too high, but that the higher-than-expected inflation reading means inflation will remain above 2% for more years. If inflation remains above 2% for much longer, economists fear that the higher rate could become the new norm, which carries economic risks. Gasoline prices surged 9.1% during September, accounting for more than half of the monthly increase, while overall energy costs rose 5.2%. Inflation also affected housing, with shelter costs increasing 0.4%, alongside higher prices for airfares, used vehicles, recreation, and education. Looking ahead, economists expect inflationary pressures to remain elevated, particularly if geopolitical tensions continue to disrupt energy supplies. Higher fuel and transportation costs could gradually affect other sectors, making inflation more difficult to control. Lastly, markets have seen a surge in demand for bonds after the CPI release, indicating a move towards safer’ assets. Gold Being Paused By Two Driving Forces Gold initially fell 1.65% immediately after the Consumer Price Index release, before declining a further 0.28% in the hours that followed. However, since this decline, Gold has risen and fully regained all previous losses. The price this morning is showing a strong upward impulse wave, but is retracing as the European session nears. The reason for the original decline is that the impact the higher inflation figure has on the Federal Reserve, the US Dollar and bond Yields. Both bond yields and the US Dollar rose to new highs for 2026. In addition, markets are now considering a Federal Reserve rate hike for October. Rate hikes, a strong Dollar, and high bond yields are known to pressure Gold. This is also one of the reasons why Gold has been in a bearish trend over the past eight weeks. However, the higher inflation reading eventually prompts a ‘risk-off’ appetite. As the ‘risk-off’ sentiment gains momentum, the mood towards gold improves. Markets are now considering an economic slowdown. The Federal Reserve’s latest Beige Book highlights sluggish consumer spending, limited economic growth across several regions and signs of a softer labour market. Now, with higher inflation and oil prices remaining above $90 per barrel, economists believe a slowdown is plausible. If employment and economic growth weaken, the US Dollar loses its attractiveness and demand for gold rises. At the same time, the Federal Reserve will not be able to hike rates further to bring inflation down, further supporting Gold. For this reason, Gold is now correcting upwards, but technical analysts advise volatility in both directions is likely as investors weigh both positive and negative elements. Investors Dump NASDAQ In Exchange For Safer Assets While the direction of Gold is less certain due to both positives and negatives, the NASDAQ is witnessing a strong decline. The NASDAQ fell 2.16% on Wednesday and a further 1.25% during this morning’s Asian session. Economists are also saying that there is a direct switch between stocks and bonds. Investors are decreasing their exposure to the stock market and particularly to the AI trend. Economists are saying that risks are mounting and strong earnings are currently not adequate to offset other risks. On one side, investors are considering higher bond yields, Fed hikes, high oil prices, and fears over AI security. So far, earnings and economic resilience have kept the market afloat. However, investors now fear an economic slowdown in 2027. As a result, investors are decreasing exposure. HFM - NASDAQ 10-Minute Chart For this reason, the NASDAQ is also showing clear bearish indications from technical analysis. The price is trading below key moving averages and the VWAP. Currently, the order flow blocks are also indicating weak demand. Price action is also indicating a downward trend as the price maintains bearish momentum. However, oscillators are mainly indicating an oversold condition The key support level on the daily timeframe is at $28,866.70. Key Takeaways: Annual inflation rises to 3.7%, while core inflation reaches 2.6%, strengthening expectations of a Federal Reserve interest rate hike before year-end. Gold rebounds from its CPI losses as increased safe-haven demand offsets pressure from bond yields and a stronger US Dollar. The NASDAQ faces sustained selling pressure as investors reduce exposure to tech stocks amid inflation concerns and weakening risk appetite. Inflation, elevated energy prices, and signs of a weakening economy increase concerns about a potential US economic slowdown in 2027. [B]Always trade with strict risk management. Your capital is the single most important aspect of your trading business.[/B] [B]Please note that times displayed based on local time zone and are from time of writing this report.[/B] Click [URL='https://www.hfm.com/hf/en/trading-tools/economic-calendar.html'][B]HERE[/B][/URL] to access the full HFM Economic calendar. Want to learn to trade and analyse the markets? Join our webinars and get analysis and trading ideas combined with better understanding of how markets work. Click [URL='https://www.hfm.com/en/trading-tools/trading-webinars.html'][B]HERE[/B][/URL] to register for FREE! [URL='https://analysis.hfm.com/'][B]Click HERE to READ more Market news.[/B][/URL] [B]Michalis Efthymiou HFMarkets[/B] [B]Disclaimer:[/B] This material is provided as a general marketing communication for information purposes only and does not constitute an independent investment research. Nothing in this communication contains, or should be considered as containing, an investment advice or an investment recommendation or a solicitation for the purpose of buying or selling of any financial instrument. All information provided is gathered from reputable sources and any information containing an indication of past performance is not a guarantee or reliable indicator of future performance. Users acknowledge that any investment in Leveraged Products is characterized by a certain degree of uncertainty and that any investment of this nature involves a high level of risk for which the users are solely responsible and liable. We assume no liability for any loss arising from any investment made based on the information provided in this communication. This communication must not be reproduced or further distributed without our prior written permission. -
Market Technical Analysis by RoboForex
RBFX Support replied to RBFX Support's topic in Technical Analysis
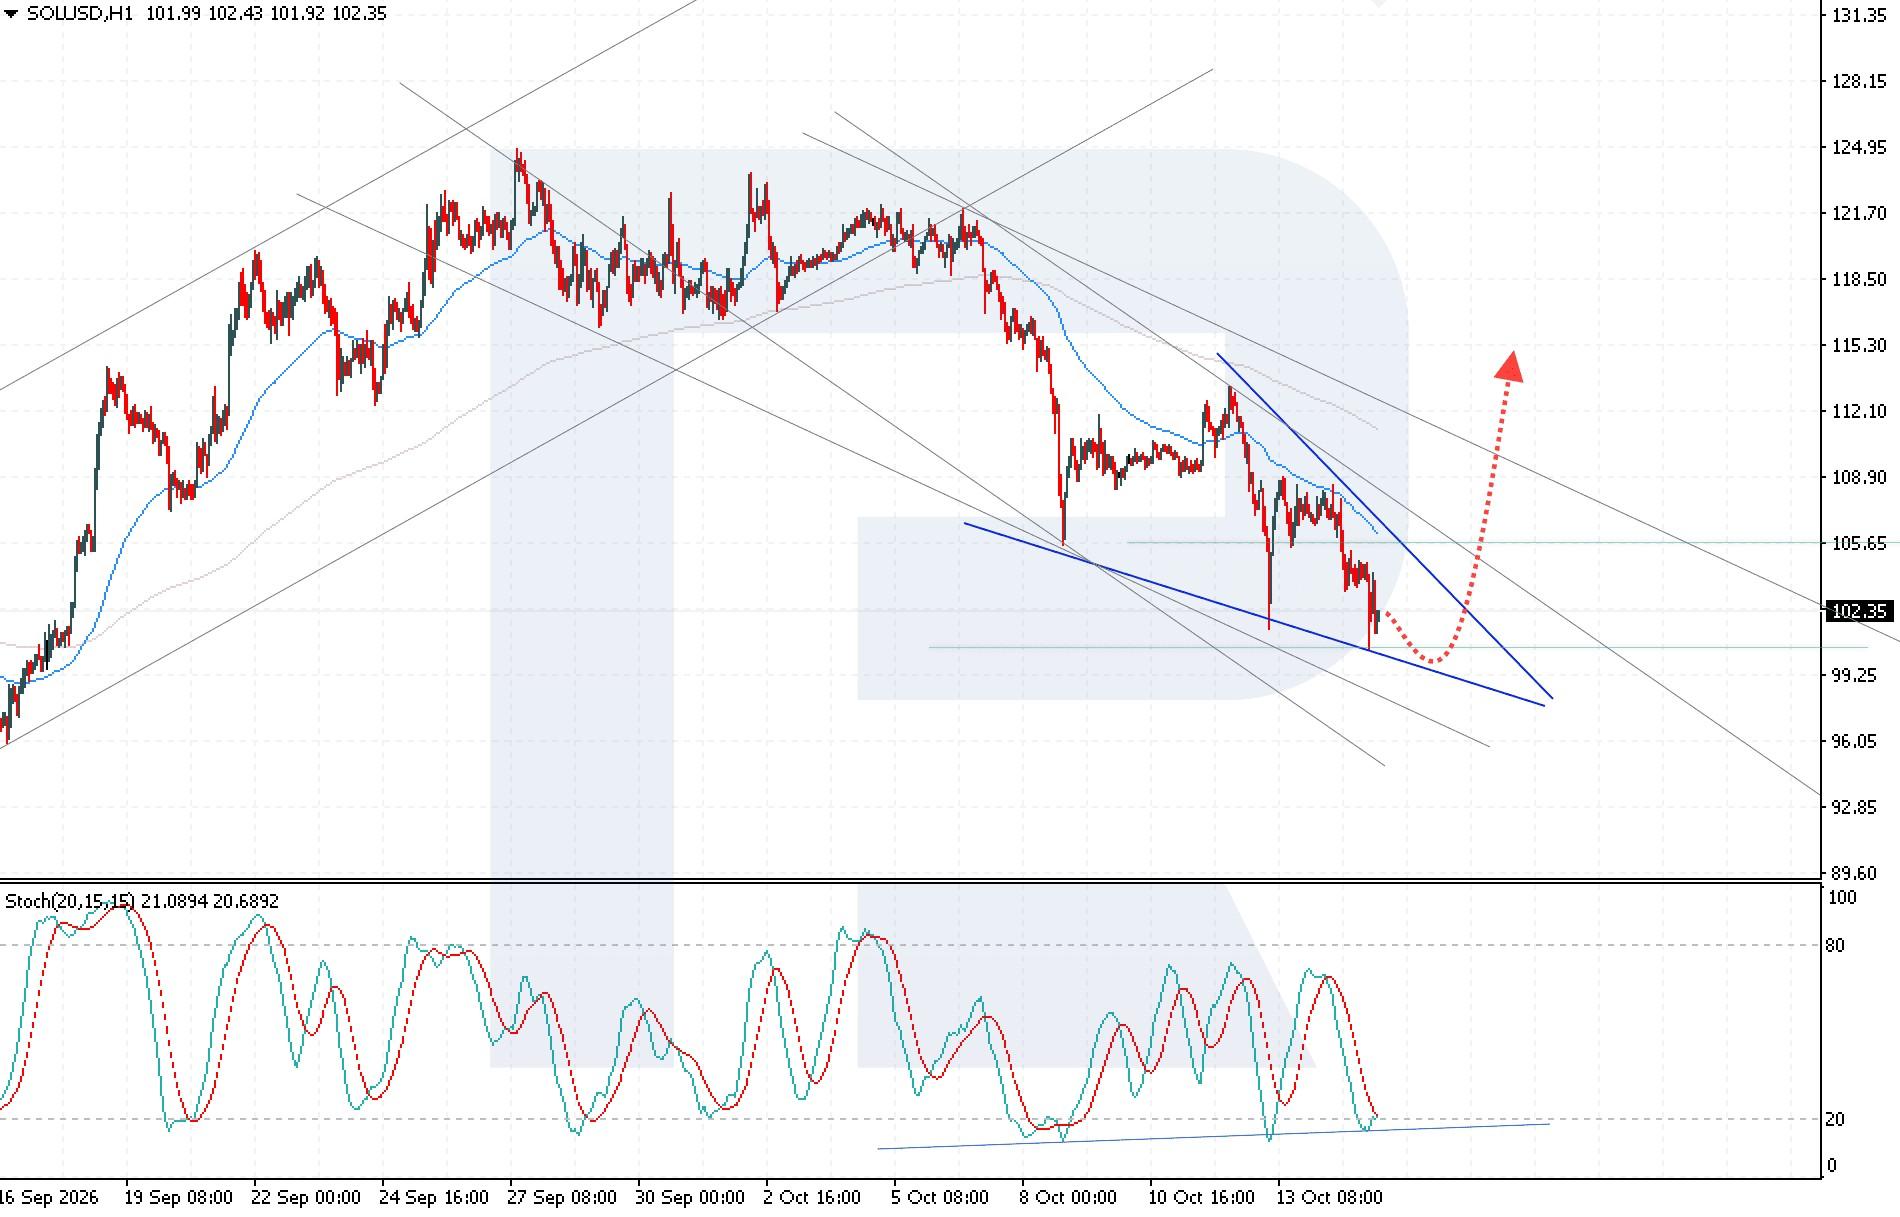
SOLUSD retains upside potential following a correction SOLUSD is declining for the fourth consecutive trading session amid capital outflows from ETFs, with the price currently standing at 102.35. Technical outlook SOLUSD prices are falling but continue to form a Wedge reversal pattern. Today's SOLUSD forecast anticipates renewed growth towards the 115.05 USD target. The SOLUSD forecast for 15 October 2026 indicates that the price remains under selling pressure amid continued ETF capital outflows. Read more - SOLUSD Forecast Attention! Forecasts presented in this section only reflect the author’s private opinion and should not be considered as guidance for trading. RoboForex bears no responsibility for trading results based on trading recommendations described in these analytical reviews. Sincerely, The RoboForex Team
-
Attached is a link to the video of the CNBC interview with this legendary trader. https://www.cnbc.com/video/2026/10/13/watch-cnbcs-full-interview-with-tudor-investment-corporation-founder-and-cio-paul-tudor-jones.html Paul-Tudor-Jones-Interview-10-13-26.txt
-
- 4
-

-

-
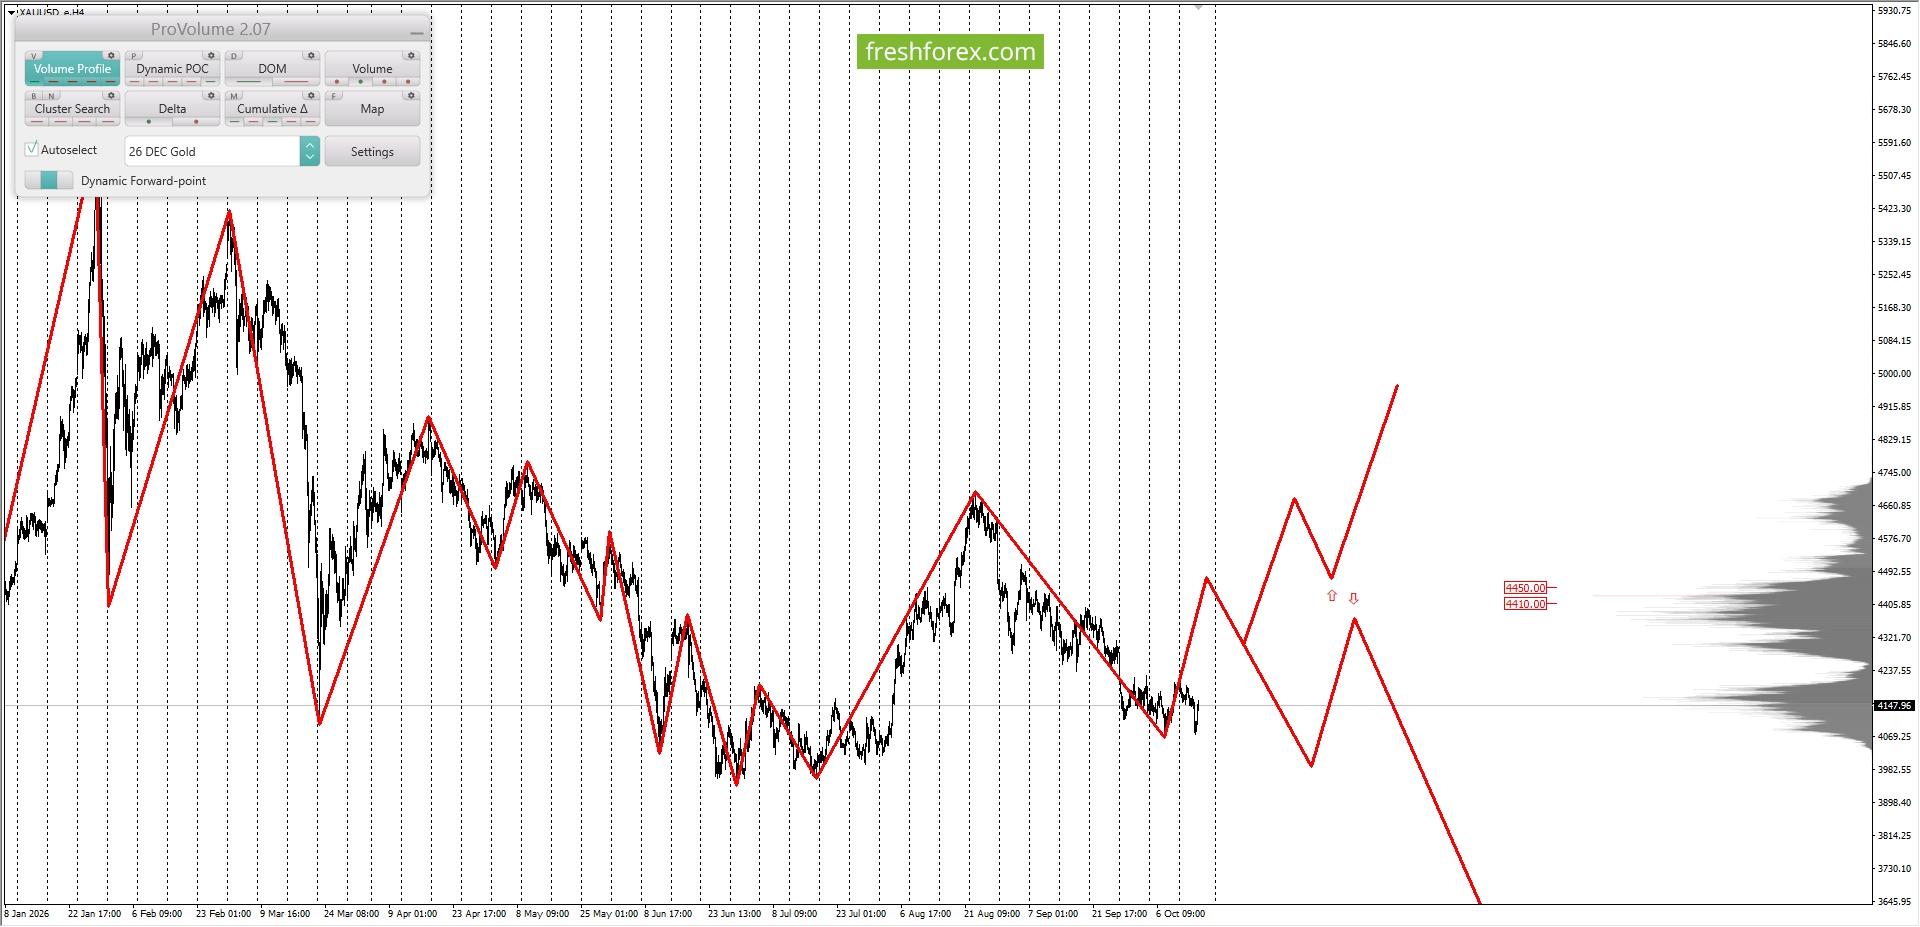
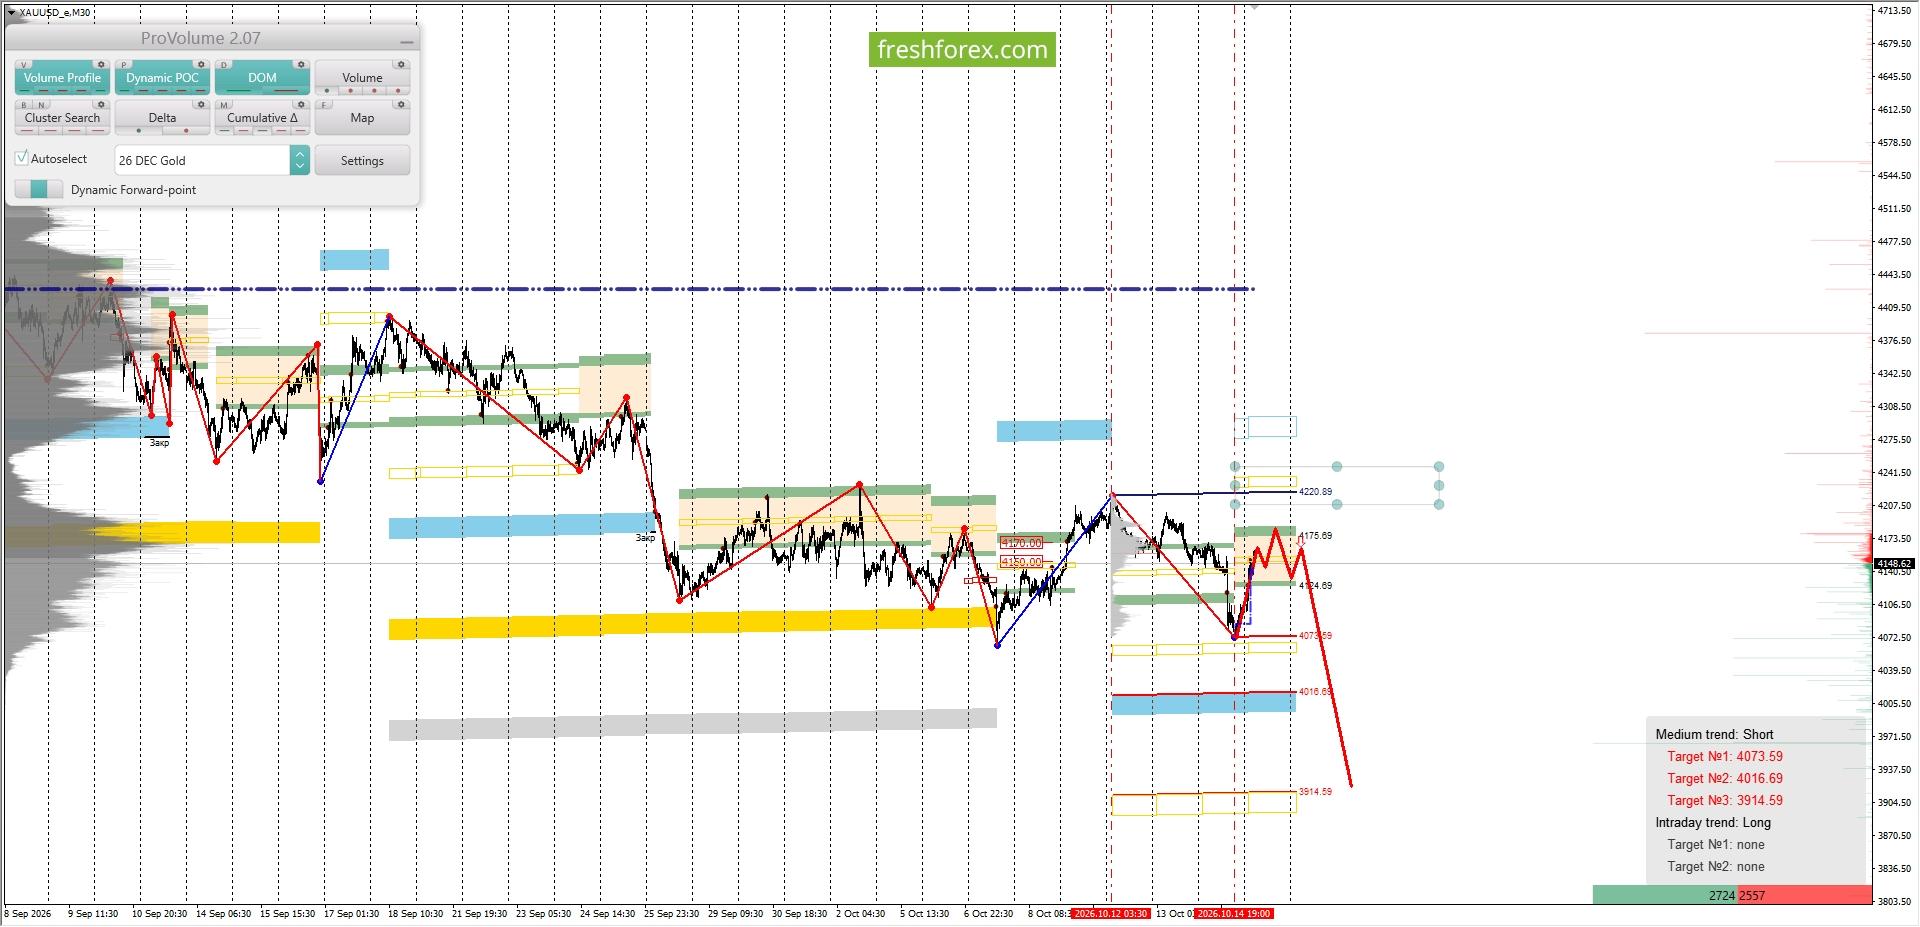
Analysis of margin levels for October 15, 2026 XAUUSD XAUUSD: SELL 4124.69-4175.69, TP1-4073.59, TP2-3914.59. Long-term trend: long. The maximum accumulation of volumes for the current contract is located in the range of quotes 4410.00–4450.00. Currently, investment operations on XAUUSD are being carried out below this range, which indicates weakness among buyers. Medium-term trend: short. The maximum accumulation of volumes for the medium-term trend is located in the range of quotes 4150.00-4170.00. Currently, investment operations on XAUUSD are being carried out below this range, which indicates strength among sellers. The area of favorable prices for selling from the perspective of margin support is located between the 1/4 and 1/2 zones constructed from the minimum of 14.10.2026. Quote of the lower boundary of zone 1/4 – 4124.69. Quote of the lower boundary of zone 1/2–4175.69. Intraday targets: update minimums from 10/14/2026–4073.59. Medium-term targets: test the lower boundary of GWCZ-3914.59. Trading recommendations: sell from the range of favorable prices when forming a reversal pattern. Sell: 4124.69-4175.69, Take Profit 1–4073.59, Take Profit 2–3914.59. Our company provides the opportunity to earn income not only from your trading. By attracting clients within the affiliate program, you can earn up to $30 per lot! You can find more analytical information on our website.
-
 Tomek joined the community
 -
And I got my first badge Rare First Post Making your first post Earned Just now
-
Hi all, I am new to the forum. Hope to help, learn, and grow Thank you flycrow
- Last week
-
 flycrow joined the community
 -
Welcome to Indo-Investasi.com. Please feel free to browse around and get to know the others. If you have any questions please don't hesitate to ask.
-
My software isn't updated to the latest versions. Would anyone be kind enough to send me a copy of their program—if it is up to date—via private message? Thank you, everyone. You can verify this by checking on Natural Cycle This is what's new. I don't mean the Tera update. Thank you all
-
Which platform do you personally use?
-
HFMarkets (hfm.com): Market analysis services.
AllForexnews replied to AllForexnews's topic in Fundamental Analysis
[B]Date: 14th October 2026.[/B] [B]US Inflation in Focus: Gold, Oil, and S&P 500 Brace for Volatility.[/B] US bond yields continue to decline for a fifth consecutive day, easing pressure on stocks and gold. Though investors continue to remain cautious before the releasing of today’s Consumer Price Index. As a result, Gold and the stock market continue to struggle to maintain bullish momentum and impulse waves. A factor that is dampening market sentiment are the higher oil prices. Oil prices, along with the inflation reading, will play a key role in determining how prices move throughout the rest of the week. Brent Oil Prices Remain Stubbornly High The price of Brent oil is declining this morning but remains above yesterday’s price range. The issue for the economy is that oil prices have remained above $100.00 for an extended period as tensions in the Gulf region continue to rise. The last time the price was below $100 per barrel was on 23 September. The conflict with the Yemeni Houthis is causing travel disruptions in Saudi Arabia. Major airlines, including Etihad Airways and Qatar Airways, have cancelled or suspended flights to the country. At the same time, concerns about energy supply disruptions are making transportation more expensive. Shipping and insurance costs have increased significantly, adding further pressure to global energy markets. Rising tensions in the Middle East can affect oil supplies and transportation costs, potentially pushing oil prices higher and increasing market volatility. However, this will depend on geopolitics. If the US inflation rate reads higher than expectations and oil prices rise throughout the day, the market could quickly see ‘risk-off’ sentiment. However, if prices continue to retrace lower and inflation fails to rise above expectations, market sentiment could improve. Key levels for market sentiment include $110 per barrel and $105. Gold Falls Despite Lower Bond Yields Despite the cooling bond yields, Gold continues to struggle to maintain bullish momentum. The downward price movement is largely driven by a lack of demand before the inflation release. The US will release its inflation data for September this afternoon at 12:30 GMT. Investors are awaiting this confirmation before determining how to trade and change their portfolios. In addition to the inflation reading, investors are also paying attention to the IMF’s comments, oil prices, and the Federal Reserve. The IMF issued a statement providing a stark warning about the risk of a global economic recession. The IMF warned that US economic growth alone will not be enough to reduce the country's rising national debt and budget deficit. It called for additional measures to improve government finances. When the economy and employment remain resilient and in growth mode the US Dollar and bonds are more attractive for investors while inflation and bond yields are high, particularly as the Federal Reserve keeps hiking. However, if a recession is imminent, the mood can change and boost demand for Gold. particularly if the Federal Reserve is no longer able to hike interest rates. HFM - Gold 30-Minute Chart In the short term, a higher inflation rate will pressure Gold, while a weaker reading will support Gold. Currently, technical analysis is providing a bearish bias as the price falls and remains below moving averages. S&P 500 - The Fed's John Williams Indicate A Prolonged Pause in 2027 The S&P 500 on Tuesday was both up and down in price movement, as it is this morning. Currently, all global indices are trading slightly higher, and the VIX Index is trading lower. This provides a slight bullish bias. However, the price movement is almost entirely dependent on the upcoming inflation release. For this reason, investors should be cautious. Federal Reserve Bank of New York President John Williams said he still sees one more interest rate hike as appropriate this year. This interest rate hike is already almost entirely priced into the market. For this reason, a hike will have a minor impact. The key factor will be whether the Fed is going to continue hiking in 2027. Williams said there are still signs inflation will slow and approach the Fed’s 2% target next year, as the impact from tariffs and an energy price shock fades. He also stated that a hike will not be necessary in 2027 if the Fed hikes in December. This could be a positive factor, but only if inflation indeed falls. HFM - S&P 500 1-Hour Chart Key Takeaways: US Inflation in Focus: September’s CPI release at 12:30 GMT could drive volatility across Gold, Oil and global stock markets. Brent Oil Above $100: Rising Middle East tensions and higher transportation costs continue to fuel inflation concerns, with $105 and $110 as key price levels. Gold Struggles Despite Falling Yields: US bond yields decline for a fifth consecutive day, but Gold remains under pressure as investors await inflation data. A higher-than-expected reading could add further downside pressure. S&P 500 Awaits Direction: US indices show a slight bullish bias, supported by falling bond yields and a lower VIX. However, inflation data and expectations for future Federal Reserve rate hikes remain the main drivers. [B]Always trade with strict risk management. Your capital is the single most important aspect of your trading business.[/B] [B]Please note that times displayed based on local time zone and are from time of writing this report.[/B] Click [URL='https://www.hfm.com/hf/en/trading-tools/economic-calendar.html'][B]HERE[/B][/URL] to access the full HFM Economic calendar. Want to learn to trade and analyse the markets? Join our webinars and get analysis and trading ideas combined with better understanding of how markets work. Click [URL='https://www.hfm.com/en/trading-tools/trading-webinars.html'][B]HERE[/B][/URL] to register for FREE! [URL='https://analysis.hfm.com/'][B]Click HERE to READ more Market news.[/B][/URL] [B]Michalis Efthymiou HFMarkets[/B] [B]Disclaimer:[/B] This material is provided as a general marketing communication for information purposes only and does not constitute an independent investment research. Nothing in this communication contains, or should be considered as containing, an investment advice or an investment recommendation or a solicitation for the purpose of buying or selling of any financial instrument. All information provided is gathered from reputable sources and any information containing an indication of past performance is not a guarantee or reliable indicator of future performance. Users acknowledge that any investment in Leveraged Products is characterized by a certain degree of uncertainty and that any investment of this nature involves a high level of risk for which the users are solely responsible and liable. We assume no liability for any loss arising from any investment made based on the information provided in this communication. This communication must not be reproduced or further distributed without our prior written permission. -
I seek some clarifications on the Terra part of the program. With only the patcher for Terra, is the TI(offline) menu active and one can use the modules in it? I deleted my serial and tested only with the patcher and I can get the Terra(offline) and all the modules work for me. Earlier I believe it wasn't active. The Solutions->AI Expert still requires a login info for activation. I am trying to understand how it goes from a few users as I believe if the AI Expert can be ignored or needs education from my side. Those interested can PM me, for confidentiality issues.